


FortiAnalyzer Analyzer-Collector configuration

This example illustrates how to set up FortiAnalyzer Analyzer and Collector modes and make them work together to increase the overall performance of log receiving, analysis, and reporting.
FortiAnalyzer provides two operation modes: Analyzer and Collector. Analyzer mode is the default mode that supports the full FortiAnalyzer features, while the primary task of a Collector is receiving logs from connected devices and uploading the logs to an Analyzer. Instead of writing logs to the database, the Collector retains the logs in their original (binary) format and sends the logs to the Analyzer. The following table shows a comparison of the supported features of the Analyzer and Collector modes.
|
FortiAnalyzer Feature |
Analyzer Mode |
Collector Mode |
|---|---|---|
| FortiView | Yes | No |
| Event Monitor | Yes | No |
| Reports | Yes | No |
| Log View | Yes | Compressed logs only; indexed logs not available. |
| Device Manager | Yes | Yes |
| System Settings | Yes | Yes |
In this example, Company A has a branch network with a FortiGate and a FortiAnalyzer 400E deployed in Collector mode. In its head office, Company A has another FortiGate and FortiAnalyzer 3000D deployed in Analyzer mode. Collector mode forwards the FortiGate logs in the remote branch to the Analyzer in the head office for data analysis and report generation. The Collector will also be used to archive logs.
Setting up the Collector
To set up the Collector:
- Configure the operation mode.
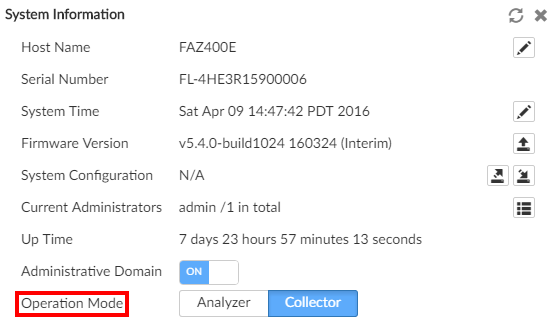
- Go to System Settings > Dashboard.
- In the System Information widget, select Collector as the Operation Mode.
- Go to Device Manager and click the Storage Used tab in the quick status bar to check the storage policy of the Collector.
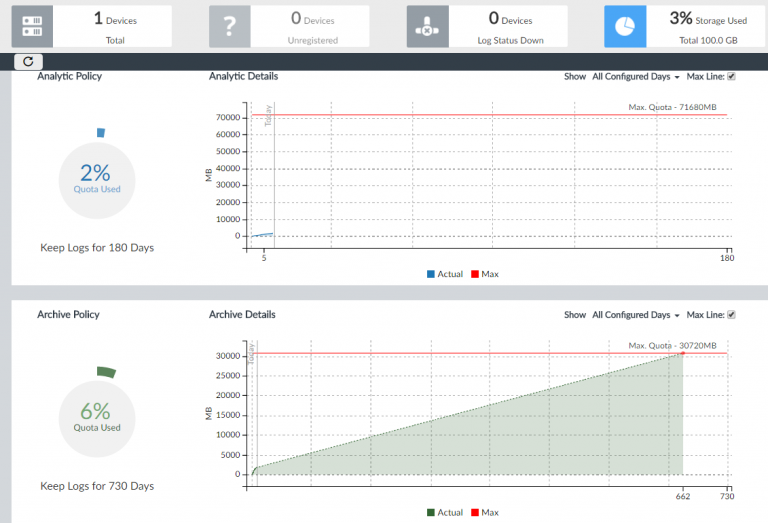
- Configure the storage policy of the Collector.
- To edit the date policy when ADOMs are enabled:
- Go to System Settings > All ADOMs.
- Double click the ADOM your Analyzer/Collector belongs to.
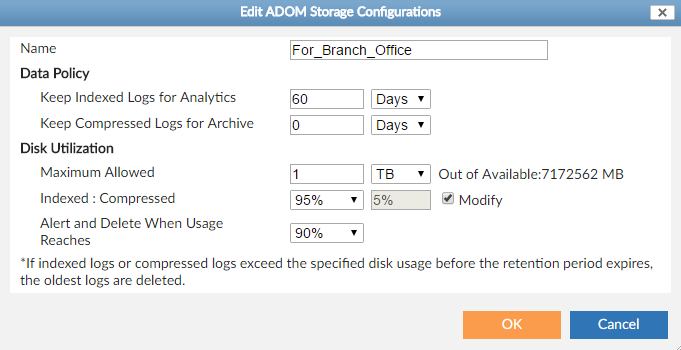
- On the Edit ADOM Storage Configurations page, edit the log storage policy.
- To edit the storage settings when ADOMs are disabled:
- Go to System Settings > Dashboards.
- In the System Information widget, click the edit icon for Log Storage Policy. In the Edit Log Storage Policy dialog box, change the settings.

- To edit the date policy when ADOMs are enabled:
- You can use the default admin account of the Analyzer or create a custom administrator account on the Analyzer. The Collector will need to provide the login credentials of this administrator account to get authenticated by the Analyzer for log aggregation.
|
|
For the Collector, you should allocate most of the disk space for compressed logs. You should keep the compressed logs long enough to meet the regulatory requirements of your organization. After this initial configuration, you can monitor the storage usage and adjust it as you go. |
To configure log forwarding:
- On the Collector, go to System Settings > Log Forwarding. Click Create New.
- Set the following settings:
- Set Server Name to a name you prefer.
- Set Remote Server Type to FortiAnalyzer.
- Set Server IP to the IP address of the Analyzer to which this Collector will forward logs.
- Click Select Device and select the FortiGate device of the branch office.
- Select both Enable Real-time Forwarding and Enable Log Aggregation.
- Provide the username and password of the Administrator account of the Analyzer.
- Click OK.

|
|
We recommend that you enable real-time forwarding to optimize performance. If you want the Collector to upload content files, which include DLP (data leak prevention) files, antivirus quarantine files, and IPS (intrusion prevention system) packet captures, you should also enable Log Aggregation so the Collector will send content files to the Analyzer at a scheduled time. |
|
|
Log forwarding is enabled by default. If you cannot see System Settings > Log Forwarding in the GUI, you will have to enable it first. Go to System Settings > Dashboard. In the CLI Console widget, enter the following CLI commands: config system admin setting set show-log-forwarding enable end |
Setting up the Analyzer
To set up the Analyzer:
- Configure the operation mode.
- Go to System Settings > Dashboard.
- In the System Information widget, select Analyzer as the Operation Mode.

- Go to Device Manager and click the Storage Used tab in the quick status bar to check the storage policy of the Analyzer.
- Configure the storage policy of the Analyzer using the corresponding instructions above for the Collector.

For the Analyzer, you should allocate most of the disk space for indexed logs. You may want to keep the indexed logs for 30-90 days. After this initial configuration, you can monitor the storage usage and adjust it as you go.
- Add the branch office FortiGate to the Analyzer.
- Go to Device Manager and click Unregistered Device in the quick status bar.
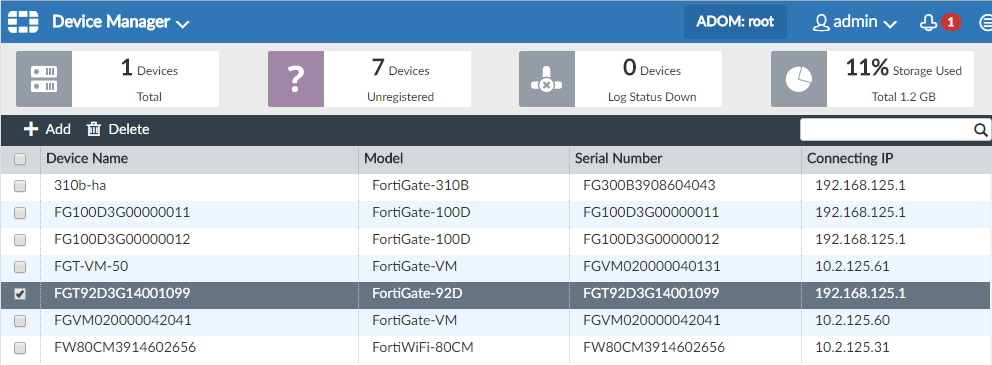
- Select the FortiGate device, and click Add.
- In the Add Device dialog box, select the ADOM you want to add to the FortiGate device (if ADOM is disabled, select root), and give the device a name. Once the FortiGate device is added, you can see it under the Device Total tab.

- Go to Device Manager and click Unregistered Device in the quick status bar.
- Make sure that the log aggregation service is enabled on the Analyzer.
- Go to System Settings > Dashboard.
- In the CLI Console widget, enter the following commands:
config system aggregation-service
	set accept-aggregation enable
end
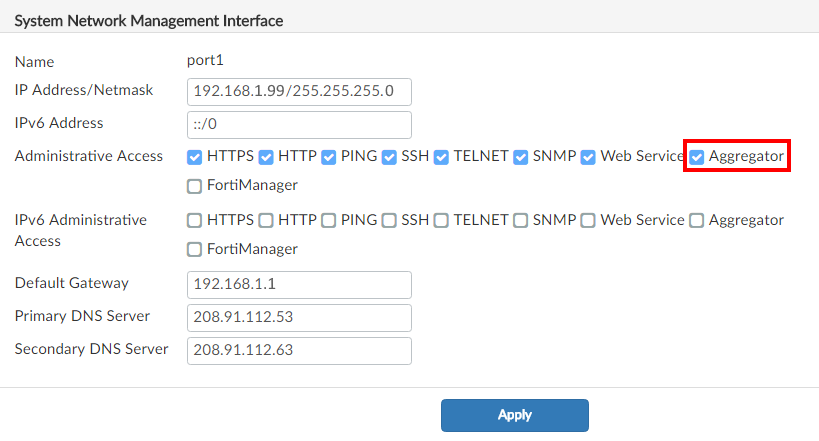
- Make sure the Analyzer interface receiving the logs allows aggregator access.
- Go to System Settings > Network.
- In the System Network Management Interface pane, select Aggregator under Administrator Access.
Results
At this point, the Collector will start to forward logs to the Analyzer. Log in to the Analyzer GUI and go to Log View. Select the branch office FortiGate device from the device list, and select Real-time Log from the Tools dropdown. You will see real-time logs arriving from the branch office FortiGate.