


Reports - Add web traffic charts to FortiClient report
Enhancements have been made to the current default FortiClient report by adding a new Web Traffic Summary section to show web traffic analytics with different dimensions: time, category, session, and users. This new section can be used for web traffic audits and analysis of the FortiClient endpoints in the network.
The Web Traffic Summary section of the FortiClient default report includes the following five sections:
- Web Traffic Trend Over Time
- Top Visited Web Categories
- Top Visited Websites
- Top Web Categories by Website and Session
- Top Browsing Users by Website
To view the Web Traffic Summary section of the FortiClient report:
- Go to Reports > Report Definitions > Templates.
- Locate FortiClient Default Report in the list and select a sample report link (HTML or PDF) in the Preview column.
The sample report is displayed.
Example of updated report (PDF format):
The Web Traffic Summary section has been added to the Table of Content.
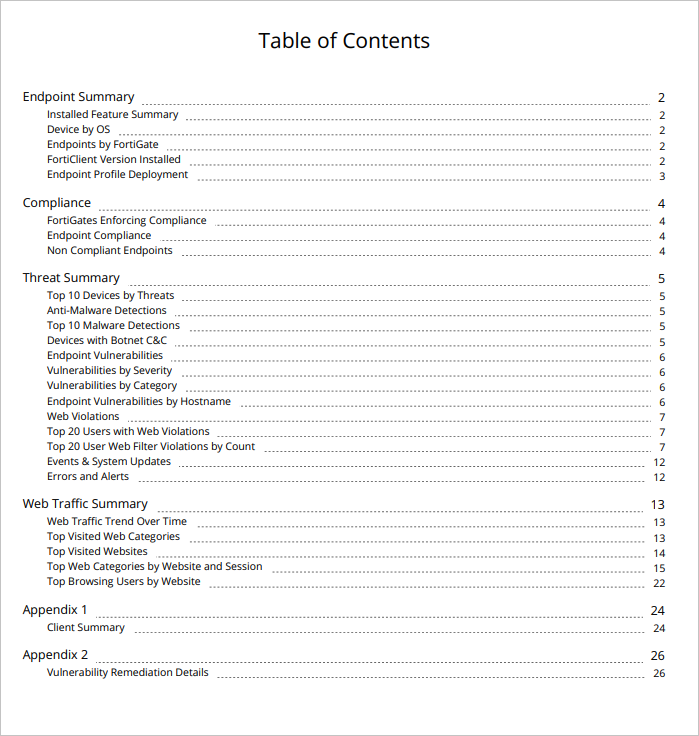
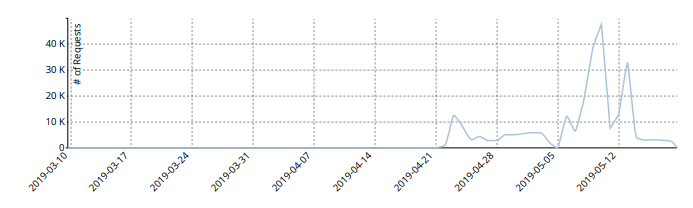
Five web traffic charts are added into the default report:
- Web Traffic Trend Over Time (line chart)
- Top Visited Web Categories (table chart)

- Top Visited Websites (table chart)

- Top Web Categories by Website and Session (table chart)

- Top Browsing Users by Website (table chart)
