


DPDK diagnostic commands
To view DPDK-related logs:
Enter the following command to view DPDK-related logs:
diagnose dpdk log show [log type]
Currently, FortiOS provides two DPDK-related logs:
|
Log |
Records kept |
|---|---|
|
early-init |
DPDK's early initialization procedure during system startup |
|
fdh |
Warnings and errors met during the initialization of FortiOS DPDK helper (FDH), i.e. DPDK engines |
Ensure that you double-check whether DPDK early initialization was successful. If successful, the end of the early-init log shows the following:
DPDK sanity test passed
If the DPDK early initialization was unsuccessful, refer to DPDK global settings to see if the DPDK-related options were properly set.
The early init-log also keeps records of last-edited DPDK configuration, enabled CPUs/ports, binding/unbinding of drivers, device PCI info, and so on.
To view DPDK-related statistics:
Enter the following command to view DPDK-related statistics:
diagnose dpdk statistics show [stats type]
Currently, FortiOS provides four types of DPDK-related statistics:
-
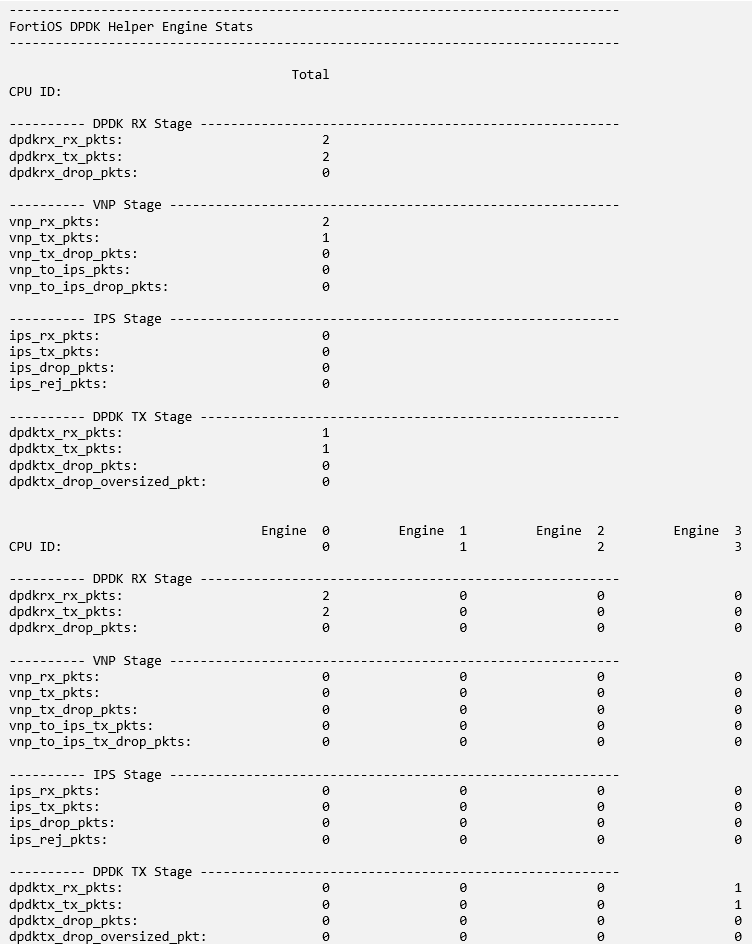
engine: provides per-DPDK engine statistics -
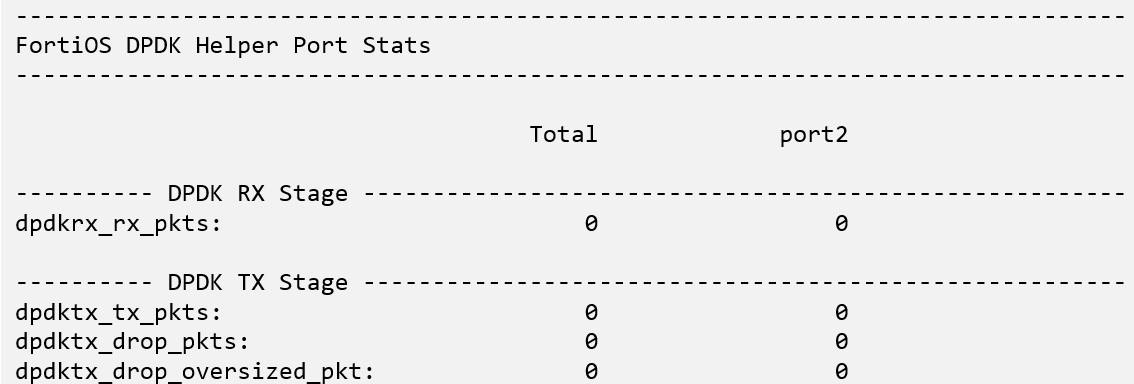
port: provides per-DPDK port statistics -
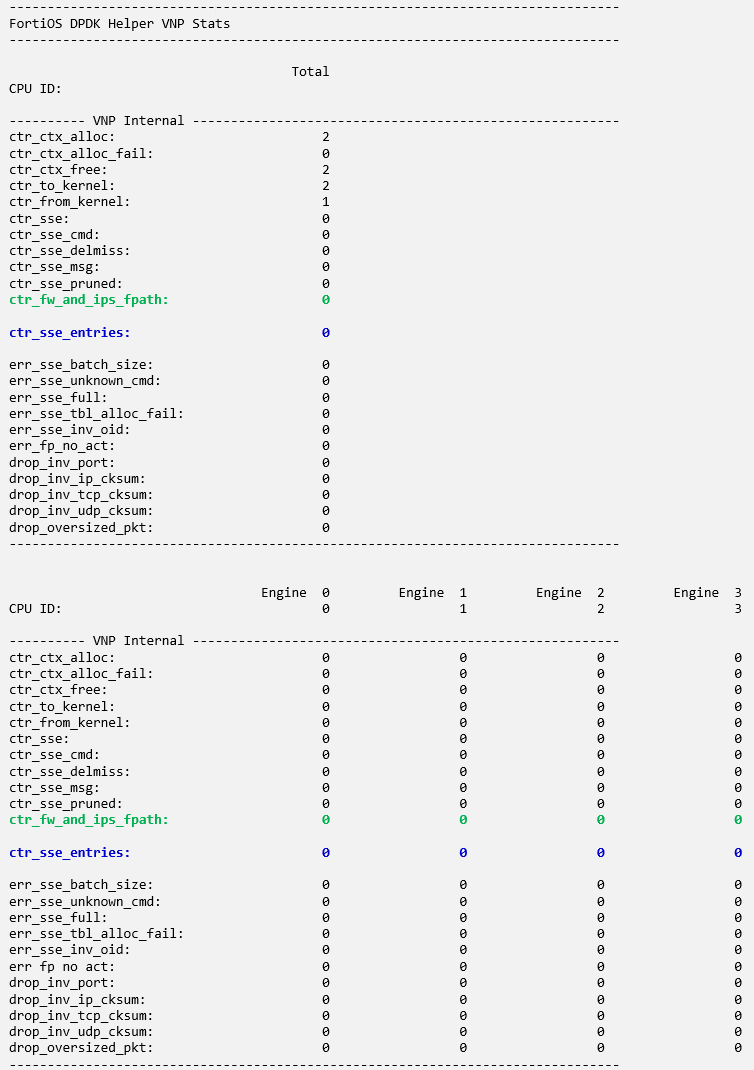
vnp: provides per-vNP engine statistics -
memory: provides a quick view of memory size reserved by each RTE memory zone
To reset statistics, enter the following command:
diagnose dpdk statistics clear all
This command resets engine and port statistics to zeroes, but does not affect vNP and memory statistics.
To check if traffic is properly forwarded, load-balanced, and offloaded to fast path:
A useful way to check whether traffic is properly forwarded is to check the port statistics. This shows the number of received/transmitted/dropped packets in each DPDK-enabled port.
Checking engine statistics is helpful in understanding how traffic is load-balanced among DPDK engines at each pipeline stage.
Checking vNP statistics provides insights to how traffic is offloaded from the slow path (traversing the kernel) to the fast path (firewall and IPS operations quickly processed by the vNP engine). In particular, observe the number of session search engine (SSE) entries pushed from kernel or IPS to vNP engine, shown bolded (ctr_sse_entries). The number of packets going through the SSE fast path is also important and is bolded (ctr_fw_and_ips_fpath).
To see DPDK CPU settings, run the following commands. In this case, N is the number of CPUs that the FortiGate-VM uses.
show dpdk cpus
config dpdk cpus
set rx-cpus "0-N"
set vnp-cpus "0-N"
set ips-cpus "0-N"
set tx-cpus "0-N"
end
To view DPDK performance:
The diagnose dpdk performance show command provides near real-time performance of each DPDK engine, in particular, the CPU usage. The system provides the following response:
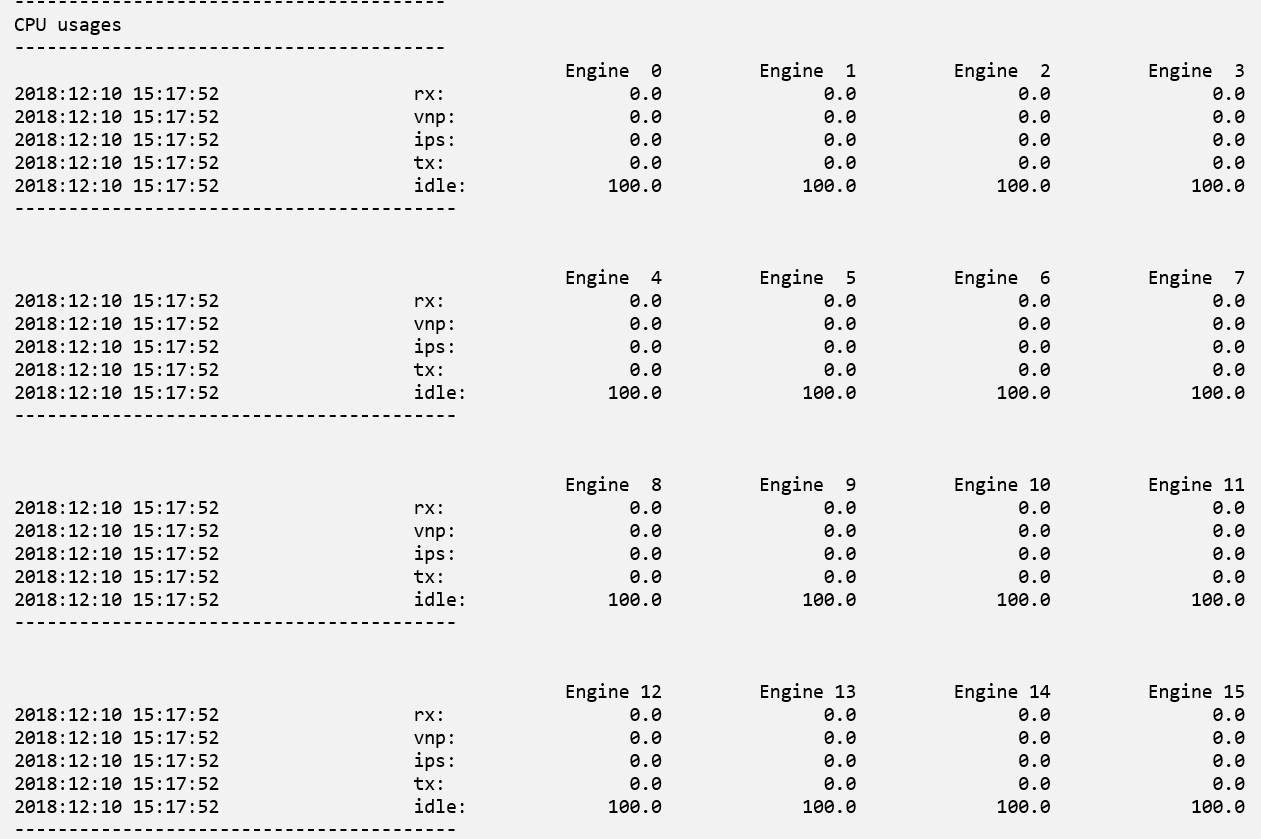
This provides better insight into how many CPUs to allocate to each pipeline stage.