
SD-WAN monitor table view
You can monitor SD-WAN devices and interfaces in the Table View section.
To monitor SD-WAN with Table View:
-
Go to the SD-WAN Manager > Network > Monitor or Device Manager > Monitors > SD-WAN Monitor pane.
-
Select Table View, you can view information about SD-WAN devices.
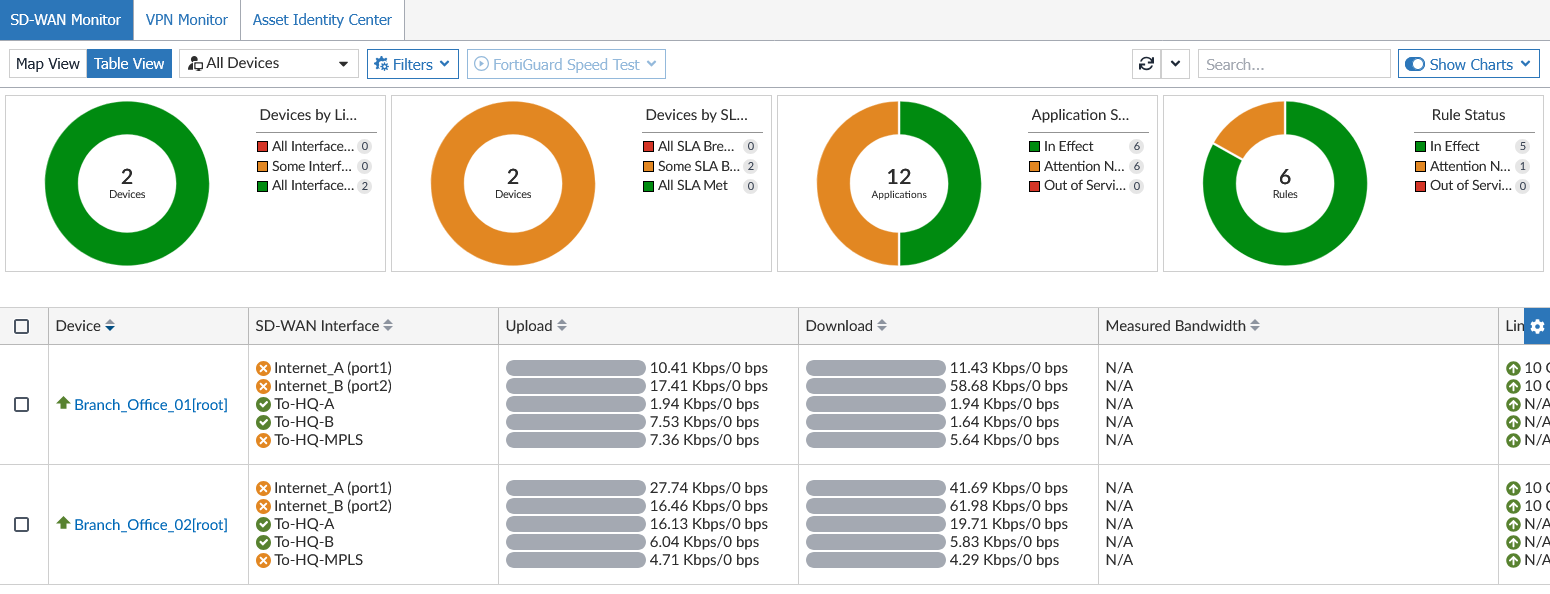
The following columns of information are shown for each device:
Device
Name of the device.
SD-WAN Interface
Interface members.
Upload
Volume of data transmitted up stream
Download
Volume of data transmitted down stream.
Measured Bandwidth
Displayed the measured bandwidth.
Link Mode
Displays the link status, speed, and duplex. Speed and duplex information is only available for physical interfaces.
Errors (TX/RX)
Displays the number of errors that have occurred during transmission (TX) and receiving (RX).
Applications
Add or remove the Applications from the Services Settings dropdown. The data is shown for the selected applications. The applications are specified in SD-WAN Rules > Destination type > Internet Service in FortiGate.
Automatic Refresh
FortiManager extracts the data from FortiGate devices based on the refresh settings. Select the automatic refresh interval from Every 5 Minutes to Every 30 Minutes.
When a single device is specified, additional realtime refresh options from Every 30 Seconds to Every 3 Minutes are available.
You can select Manual Refresh to refresh the data manually.

Hover over a service for a device that is shown in red. A pop-up shows the parameters that have failed the SLA criteria.
-
(Optional) Apply filters. Multiple filters can be applied simultaneously.
-
Click the Filters dropdown to view options to Show Unhealthy Devices Only and/or Show Unhealthy Interfaces Only.
-
Selecting one or more segments displayed in donut charts will apply corresponding filters to the table.
For example, selecting All Interfaces Down in the Devices by Link Status chart will filter the table to display only devices with all interfaces down.
-