


Tools
To locate network errors and other issues that may prevent connections from passing to or through the FortiWeb appliance, FortiWeb appliances feature several troubleshooting tools.
Troubleshooting methods and tips may use:
- The command line interface (CLI)
- The web UI
- External third-party tools
Some CLI commands provide troubleshooting information not available through the web UI; third-party tools on external hosts can test connections from perspectives that cannot be achieved locally.
See also
Ping & traceroute
If your FortiWeb appliance cannot connect to other hosts, try using ICMP (ping and traceroute) to determine if the host is reachable or to locate the node of your network at which connectivity fails, such as when static routes are incorrectly configured. You can do this from the FortiWeb appliance using CLI commands.
For example, you might use ping to determine that 192.0.2.87 is reachable:
execute ping 192.0.2.87
PING 192.0.2.87 (192.0.2.87): 56 data bytes
64 bytes from 192.0.2.87: icmp_seq=0 ttl=64 time=2.4 ms
64 bytes from 192.0.2.87: icmp_seq=1 ttl=64 time=1.4 ms
64 bytes from 192.0.2.87: icmp_seq=2 ttl=64 time=1.4 ms
64 bytes from 192.0.2.87: icmp_seq=3 ttl=64 time=0.8 ms
64 bytes from 192.0.2.87: icmp_seq=4 ttl=64 time=1.4 ms
--- 192.0.2.87 ping statistics ---
5 packets transmitted, 5 packets received, 0% packet loss
round-trip min/avg/max = 0.8/1.4/2.4 ms
or that 192.168.1.10 is not reachable:
execute ping 192.0.2.55
PING 192.0.2.55 (192.0.2.55): 56 data bytes
Timeout ...
Timeout ...
Timeout ...
Timeout ...
Timeout ...
--- 192.0.2.55 ping statistics ---
5 packets transmitted, 0 packets received, 100% packet loss
If the host is not reachable, you can use traceroute to determine the router hop or host at which the connection fails:
execute traceroute 192.0.2.55
traceroute to 192.0.2.55 (192.0.2.55), 32 hops max, 72 byte packets
1 192.168.1.2 2 ms 0 ms 1 ms
2 * * *
For details about CLI commands, see the FortiWeb CLI Reference:
https://docs.fortinet.com/document/fortiweb/
For details about troubleshooting connectivity, see Connectivity issues.
|
|
Both ping and traceroute require that network nodes respond to ICMP. If you have disabled responses to ICMP on your network, hosts may appear to be unreachable to ping and traceroute, even if connections using other protocols can succeed. |
Log messages
Log messages often contain clues that can aid you in determining the cause of a problem. FortiWeb appliances can record log messages when errors occur that cause failures, upon significant changes, and upon processing events.
Depending on the type, log messages may appear in either the event, attack, or traffic logs. The FortiWeb appliance must be enabled to record event, attack, and traffic log messages; otherwise, you cannot analyze the log messages for events of that type. To enable logging of different types of events, go to Log&Report > Log Config > Other Log Settings.
During troubleshooting, you may find it useful to reduce the logging severity threshold for more verbose logs, to include more information on less severe events. To configure the severity threshold, go to Log&Report > Log Config > Global Log Settings.
Diff
You can compare backups of the core configuration file with your current configuration. This can be useful if, for example:
- A previously configured feature is no longer functioning, and you are not sure what in the configuration has changed.
- You want to recreate something configured previously, but do not remember what the settings were.
Difference programs can help you to quickly find all changes.
There are many such difference-finding programs, such as WinMerge (http://sourceforge.net/projects/winmerge) and the original diff (http://www.gnu.org/s/diffutils). They can compare your configurations, line by line, and highlight parts that are new, modified, or deleted.
For instructions, see your difference program’s documentation.
See also
Packet capture
Packet capture, also known as sniffing or packet analysis, records some or all of the packets seen by a network interface (that is, the network interface is used in promiscuous mode). By recording packets, you can trace connection states to the exact point at which they fail, which may help you to diagnose some types of problems that are otherwise difficult to detect.
FortiWeb appliances have a built-in sniffer. Packet capture on FortiWeb appliances is similar to that of FortiGate appliances. You can perform the packet capture through CLI command or Web UI.
Packet capture via CLI command
To use the built-in sniffer, connect to the CLI and enter the following command:
diagnose network sniffer packet [{any | <interface_name>} [{none | '<filter_str>'} [{1 | 2 | 3} [<packets_int>]]]]
where:
-
<interface_name>is either the name of a network interface, such asport1, or enteranyfor all interfaces. -
'<filter_str>'is the sniffer filter that specifies which protocols and port numbers that you do or do not want to capture, such as'tcp port 80', or enternonefor no filters. Filters use tcpdump (http://www.tcpdump.org) syntax. - {1 | 2 | 3} is an integer indicating whether to display the network interface names, packet headers, and/or payloads for each packet that the network interface sends, receives, or sees:
-
1—Display the packet capture timestamp, plus basic fields of the IP header: the source IP address, the destination IP address, protocol name, and destination port number.Does not display all fields of the IP header; it omits:
- IP version number bits
- Internet header length (
ihl) - Type of service/differentiated services code point (
tos) - Explicit congestion notification
- Total packet or fragment length
- Packet ID
- IP header checksum
- Time to live (
TTL) - IP flag
- Fragment offset
- Options bits
- For example:
-
2—All of the output from1, plus the packet payload in both hexadecimal and ASCII. For example:
-
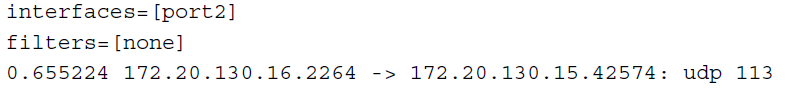
3—All of the output from2, plus the link layer (Ethernet) header. e.g.:

- <packets_int> is the number of packets the sniffer reads before stopping. Packet capture output is printed to your CLI display until you stop it by pressing Ctrl+C, or until it reaches the number of packets that you have specified to capture.
|
|
Packet capture can be very resource intensive. To minimize the performance impact on your FortiWeb appliance, use packet capture only during periods of minimal traffic, with a local console CLI connection rather than a Telnet or SSH CLI connection, and be sure to stop the command when you are finished. |
For example, you might capture all TCP port 443 (typically HTTPS) traffic occurring through port1, regardless of its source or destination IP address. The capture uses a high level of verbosity (indicated by 3).
A specific number of packets to capture is not specified. As a result, the packet capture continues until the administrator presses Ctrl+C. The sniffer then confirms that five packets were seen by that network interface.
(Verbose output can be very long. As a result, output shown below is truncated after only one packet.)
FortiWeb# diagnose network sniffer packet port1 'tcp port 443' 3
interfaces=[port1]
filters=[tcp port 443]
10.651905 192.168.0.1.50242 -> 192.168.0.2.443: syn 761714898
0x0000 0009 0f09 0001 0009 0f89 2914 0800 4500 ..........)...E.
0x0010 003c 73d1 4000 4006 3bc6 d157 fede ac16 .<s.@.@.;..W....
0x0020 0ed8 c442 01bb 2d66 d8d2 0000 0000 a002 ...B..-f........
0x0030 16d0 4f72 0000 0204 05b4 0402 080a 03ab ..Or............
0x0040 86bb 0000 0000 0103 0303 ..........
Instead of reading packet capture output directly in your CLI display, you usually should save the output to a plain text file using your CLI client. Saving the output provides several advantages. Packets can arrive more rapidly than you may be able to read them in the buffer of your CLI display, and many protocols transfer data using encodings other than US-ASCII. It is often, but not always, preferable to analyze the output by loading it into in a network protocol analyzer application such as Wireshark (http://www.wireshark.org).
For example, you could use PuTTY or Microsoft HyperTerminal to save the sniffer output to a file. Methods may vary. See the documentation for your CLI client.
Requirements
- Terminal emulation software such as PuTTY (http://www.chiark.greenend.org.uk/~sgtatham/putty/download.html)
- A plain text editor such as Notepad
- A Perl interpreter (http://www.perl.org/get.html)
- Network protocol analyzer software such as Wireshark (http://www.wireshark.org)
To view packet capture output using PuTTY and Wireshark
- On your management computer, start PuTTY.
- Use PuTTY to connect to the FortiWeb appliance using either a local console, SSH, or Telnet connection. For details, see the FortiWeb CLI Reference:
- Type the packet capture command, such as:
- In the upper left corner of the window, click the PuTTY icon to open its drop-down menu, then select Change Settings. A dialog appears where you can configure PuTTY to save output to a plain text file.
- In the Category tree on the left, go to Session > Logging.
- In Session logging, select Printable output.
- In Log file name, click the Browse button, then choose a directory path and file name such as
C:\Users\MyAccount\packet_capture.txtto save the packet capture to a plain text file. (You do not need to save it with the.logfile extension.) - Click Apply.
- Press Enter to send the CLI command to the FortiWeb appliance, beginning packet capture.
- If you have not specified a number of packets to capture, when you have captured all packets that you want to analyze, press Ctrl + C to stop the capture.
- Close the PuTTY window.
- Open the packet capture file using a plain text editor such as Notepad.
- Delete the first and last lines, which look like this:
- Convert the plain text file to a format recognizable by your network protocol analyzer application.
https://docs.fortinet.com/document/fortiweb/
diagnose network sniffer packet port1 'tcp port 443' 3
but do not press Enter yet.
=~=~=~=~=~=~=~=~=~=~=~= PuTTY log 12/28/2020.07.25 11:34:40 =~=~=~=~=~=~=~=~=~=~=~=
FortiWeb-2000 #
These lines are a PuTTY timestamp and a command prompt, which are not part of the packet capture. If you do not delete them, they could interfere with the script in the next step.
You can convert the plain text file to a format (.pcap) recognizable by Wireshark (formerly called Ethereal) using the fgt2eth.pl Perl script. To download fgt2eth.pl, see the Fortinet Knowledge Base article "Troubleshooting Tool: Using the FortiOS built-in packet sniffer (http://kb.fortinet.com/kb/documentLink.do?externalId=11186).
|
|
The fgt2eth.pl script is provided as-is, without any implied warranty or technical support, and requires that you first install a Perl module compatible with your operating system. |
To use fgt2eth.pl, open a command prompt, then enter a command such as the following:
fgt2eth.pl -in packet_capture.txt -out packet_capture.pcap
where:
-
fgt2eth.plis the name of the conversion script; include the path relative to the current directory, which is indicated by the command prompt -
packet_capture.txtis the name of the packet capture’s output file; include the directory path relative to your current directory -
packet_capture.pcapis the name of the conversion script’s output file; include the directory path relative to your current directory where you want the converted output to be saved
Viewing sniffer output in Wireshark

For additional information on packet capture, see the Fortinet Knowledge Base article "Troubleshooting Tool: Using the FortiOS built-in packet sniffer (http://kb.fortinet.com/kb/documentLink.do?externalId=11186).
For more information on CLI commands, see the FortiWeb CLI Reference:
https://docs.fortinet.com/document/fortiweb/
Packet capture via Web UI
- Go to System > Network > Packet Capture.
- Click Create New to create a new packet capture policy.
- Configure these settings:
Interface Select the network interface on which you want to capture packets. Filter Specify which protocols and port numbers that you do or do not want to capture, such as 'tcp and port 80 and host IP1 and ( IP2 or IP3 )', or leave this field blank for no filters.
Note that please use the same filter expression astcpdumpfor this filter, you can refer to the Linux man page of TCPDUMP (http://www.tcpdump.org/manpages/tcpdump.1.html).Maximum Packet Count Specify the maximum packets you want to capture for the policy. Capture will stop automatically if the total captured packets hits the count. - Click OK.
- Configure a packet capture policy from the policy table:
Interface The network interface on which the packet capture policy is applied. Filter The protocols and port numbers that the packet capture policy do or do not want to capture. Packets Current captured packet count. This value keeps increasing during the capture is running. Maximum Packet Count The maximum packets count of the policy. Progress Click the Start button aside No Running to start the capture.
During the capture processing, a progress bar is displayed to show the progress to the maximum packet count. Count of captured packets is displayed in Packets field.
Capture stops when hitting the maximum packet count, or you can click the Stop button to stop the capture anytime. Captured packets will be saved as a .pcap file.
Click the Download button to download the capture output file.
Click the Restart button to restart the capture.
Diagnostic commands in the CLI
Most diagnostic tools are in the CLI and are not available from the web UI. Many are shown in Solutions by issue type. For more information on the diagnose command and other CLI commands, see the FortiWeb CLI Reference:
https://docs.fortinet.com/document/fortiweb/
Retrieving debug logs
If your troubleshooting issue requires debugging, use a diagnose CLI command to enable debug logs, which saves the following logs to a file on the appliance’s internal flash disk:
- crash logs
- daemon logs
- kernel logs
- netstat logs
- core dump logs
- perf log
- top log
- tcpdump logs
Then, go to System > Maintenance > Debug > Download to retrieve the logs..
Note: To access this part of the web UI, your administrator’s account must have the prof_admin permission. For details, see Permissions.
For details, see the FortiWeb CLI Reference: