


HA trouble-shooting
Common Troubleshooting Steps
If a high availability (HA) cluster is not behaving as expected, use the following troubleshooting steps to help find the source of the problem:
1. Ensure the physical connections are correct:
-
Ensure that the physical interfaces that FortiWeb monitors to check the status of appliances in the cluster (Port Monitor in HA configuration) are in the same subnet.
-
Ensure that the HA heartbeat link ports are connected through crossover cables. Although the feature works if you use switches to make the connection, Fortinet recommends a direct connection.
2. Ensure the following HA configuration is correct:
-
Ensure that the cluster members have the same Group ID value, and that no other HA cluster uses this value.
-
Specify different Device Priority values for each member of the cluster and select the Override option. This configuration ensures that the higher priority appliance (the one with the lowest value) is maintained as the primary as often as possible.
3. Use the following commands to collect status information and diagnose logs for further analysis:
-
get system status / ha #HA status & basic running config view
-
diagnose system ha #More detailed HA information
-
execute ha dbver / md5sum / synchronize
-
diagnose debug application hamain / hasync / hasync-base / hatalk
|
diagnose debug application hasync 7 |
Configures the debug logs for HA synchronization to display messages about the automatic configuration synchronization process, commands that failed, and the full configuration synchronization process. Run on both members of the HA cluster to confirm configuration synchronization and communication between the appliances. The valid range of log level is 0–7, where 0 disables debug logs for the module and 7 generates the most verbose logging. Before you run this command, run the following commands to turn on debug log output and enable timestamps: diagnose debug enable diagnose debug console timestamp enable |
|
diagnose debug application hasync-base 7 |
Configures the debug logs for HA synchronization for L7 persistence. L7 persistence is available only in Active-Passive mode. |
|
diagnose debug application hatalk 7 |
Configures the debug logs for HA heartbeat links to display messages about the heartbeat signal, HA failover, and the uptime of the members of the HA cluster.. |
|
diagnose debug application hamain 7 |
Configures the debug logs to display the interaction messages between hamain and hatalk (heatbeat), as well as other kernel or function modules that need HA support |
|
diagnose debug application hahlck 7 |
Configures the debug logs for HA health check messages. HA health check is available only in Standard Active-Active mode. |
4. Collect HA related logs:
-
System Event log: Log&Report > Log Access > Event
-
/var/log/gui_upload/ha_event_log #Download from System > Maintenance > Backup & Restore > GUI File Download/Upload (will be archived in the debug log in future builds)
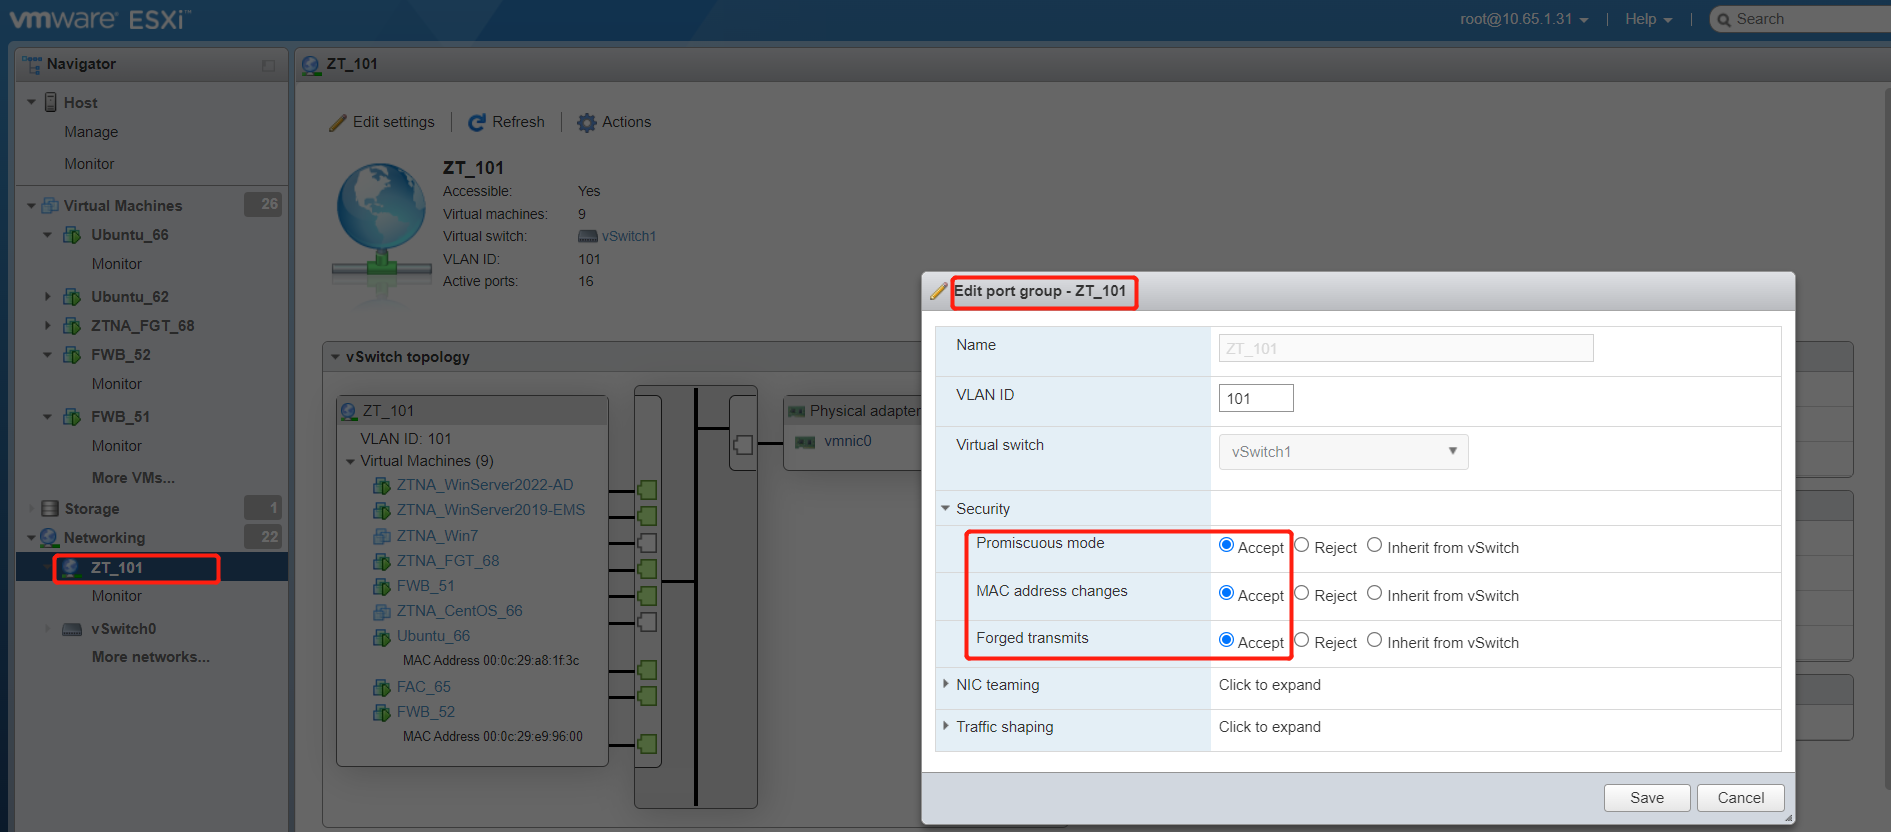
Troubleshooting HA issues when FortiWeb nodes are deployed on Hypervisors - Extra configuration on ESXi for HA deployment
In most cases, traffic ports except the heartbeat and reserved-mgmt ones on FortiWeb will use a virtual MAC address, so in VM ESXi environment such as VMWare ESXi, if you want to visit the IP address or VIP, you’ll need to enable the promiscuous mode on the traffic port. Actually you need to enable all three options for ESXi > Networking > Port-Groups > Edit settings > Security > Promiscuous mode, MAC address changes and Forged transmits.
The specific configuration is based on different HA modes:
-
Active-Passive mode: IP addresses on all traffic ports and VIPs on the primary node will use a virtual mac address formatted like “00:09:0F:A0:CC:02” to reply to a visit, so promiscuous needs to be enabled on all traffic ports.
The secondary nodes will still use the real-mac until it switches to be the primary node.
-
Active-Active-Standard mode: the same as Active-Passive mode.
-
Active-Active-High-Volume mode: IP addresses on the physical ports will still use the original mac address, while VIPs will use virtual mac address, so if just the Interface IP is used as the Virtual Server in Server Policy, promiscuous can be disabled; but if VIPs are created and bound to Server Policy, promiscuous needs to be enabled on the traffic ports.
E.g. HA AS mode in ESXi platform:


By default, port2 (Network Adapter 2) only processes the original MAC address assigned by ESXi: 00:0c:29:e9:0f:9a:

But as HA-AAHV mode is enabled, IPs including the VIP on port2 uses a virtual MAC: 00:09:0f:a0:cc:02.

HA Status issue 1 - All nodes are Primary
Regarding HA status issues, a typical issue is that both HA nodes are in the primary role.
Follow these steps to troubleshoot:
1. Verify the “4 Sames” HA configuration prerequisite:
The same Platform, same Firmware Version, same Group ID and same Override option.
2. Verify that heartbeat interfaces are configured correctly and properly.
Please refer to above section HA Key Settings > Heartbeat part for more details.
4. Test the cables and/or switches in the heartbeat link to verify that the link is functional.
5. Verify that the ports on Monitor Interface are linked up.
6. If the heartbeat link passes through switches and/or routers, you may need to adjust the time required after a reboot to assess network availability before electing the main appliance. To do this, use the command “set boot-time <seconds_int>”.
7. Check if CPU usage of HA members are extremely high.
It’s rare but if the CPU usage of a certain HA appliance is extremely high, the system may fail to send or receive heartbeat packets, thus causing HA status abnormal too.
8. For debugging logs, use commands “diagnose system ha status” and “diagnose debug application hatalk 7” to check the heartbeat communication between the primary and secondary appliances.
The key point is to guarantee that HA member information for the peer node can be received and is correct.
E.g. the hbdev port10 gets disconnected, the peer HA member FVVM04TM21001050 leaves HA group.
FortiWeb # diagnose debug application hatalk 7
FortiWeb # diagnose debug enable
(2021-12-27 22:56:03 hb_port.c:324) Enter Fun : init_hb_ports, port port10, backup
(2021-12-27 22:56:03 hb_port.c:305) HB sockfd for interface (port10) = 9
(2021-12-27 22:56:03 hb.c:139) override old: 1 -> new: 1
(2021-12-27 22:56:03 hb.c:150) MyHB: gid 11, dpri 5, group name Group_AAS, sn FVVM08TM21000613
(2021-12-27 22:56:03 hb_timer.c:252) Member(FVVM04TM21001050) is too staleness, need to clean it from the ha group ()
(2021-12-27 22:56:03 hb_timer.c:266) Send ha member leave trap, sn:FVVM04TM21001050
(2021-12-27 22:56:03 hb_msg.c:62) Send ha member change, rv 0
(2021-12-27 22:56:03 hb_idx.c:160) Delete member id:FVVM04TM21001050
ha_reader:325 nstd recv msg group:28
recv msg from ha, msg_type:FREE sn:FVVM04TM21001050 id:0
nstd recv msg from ha, msg_type:3
HA Status issue 2 - Unexpected switch over
When you found HA switchover happened but not sure about the reason, you can try to check the causes with following steps:
1. Check the HA primary role election rule
The primary HA role is elected according to these rules:
-
If Override is disabled:
Available ports number (Monitor) > Uptime > Priority > SN
-
If Override is enabled:
Available ports number (Monitor) > Priority > Uptime > SN
Serial numbers are sorted by comparing each character from left to right, where 9 and z are the greatest values, and result in highest placement in the sorted list. Since it’s very rare that different nodes have the exact same uptime, SN is rarely compared.
2. Check if HA heartbeat links are normal and heartbeat packets can be sent and received normally.
3. Check if CPU usage of HA members are abnormal.
If the CPU usage of a HA appliance fluctuates and sometimes reaches 100%, the system may fail to send or receive heartbeat packets from time to time, thus causing HA status unstable.
In above cases, sometimes HA heartbeat packets may lose. One can try to increase the failure detection threshold if a failure is detected when none has actually occurred. For example, during peak traffic times, if the main appliance is very busy, it might not respond to heartbeat packets in time, and the standby appliance may assume that the main appliance has failed.
FortiWeb # sho full sys ha
config system ha
set hb-interval 10 #heartbeat interval, range 1-20 (100ms)
set hb-lost-threshold 3 #heartbeat threshold for failed, range 1-60
end
4. Check HA event logs to find the timeline and causes for HA failover:
Sometimes you may be not sure about the events and causes but just observed an unexpected HA failover, then you can check the HA failover events in these ways/logs.
-
Check the Event logs, which include the reasons for HA status changes and can be filtered with “Action: HA-Switch” or other options as below:
Log & Report > Log Access > Event > Action: HA-Switch, HA-Synchronize, HA-member-left, HA-member-join, HA-monitor-port.
E.g. Below logs show different HA switch events caused by priority changes, monitor ports status changes and uptime comparison.

-
Check more detailed HA file logs via diagnose command “diagnose system ha file-log show” or download the ha_event_log via /var/log/gui_upload/:
E.g. Check HA switch events and causes:
FortiWeb # diagnose system ha file-log show | grep switch
2021-12-25 20:37:45 dbg-hamain ha_mode.c:62 Recv ha switch
2021-12-25 20:37:45 dbg-hatalk hb_msg.c:40 Send ha switch, rv 0
2021-12-25 20:37:46 dbg-hamain ha_mode.c:303 In ha mode process, old role SECONDARY -> new role PRIMARY role changed: 1 switch reason: 1
2021-12-25 20:37:46 dbg-hamain ha_mode.c:315 switch SECONDARY -> PRIMARY
2021-12-25 20:37:46 dbg-hamain ha_mode.c:325 HA switch from secondary to primary, the effective factor of the election is Monitor .2021-12-25 20:37:46 dbg-hamain ha_mode.c:101 Send ha mode swith trap, reason:Monitor
2021-12-25 20:38:00 dbg-hamain ha_mode.c:62 Recv ha switch
2021-12-25 20:38:00 dbg-hatalk hb_msg.c:40 Send ha switch, rv 0
2021-12-25 20:38:01 dbg-hamain ha_mode.c:303 In ha mode process, old role PRIMARY -> new role SECONDARY role changed: 1 switch reason: 2
2021-12-25 20:38:01 dbg-hamain ha_mode.c:342 switch PRIMARY -> SECONDARY
2021-12-25 20:38:01 dbg-hamain ha_mode.c:351 HA switch from primary to secondary, the effective factor of the election is Priority .2021-12-25 20:38:01 dbg-hamain ha_mode.c:224 HA device into Secondary mode

FortiWeb backend Shell:
~# tail -100 /var/log/gui_upload/ha_event_log | grep switch
2021-12-25 20:37:45 dbg-hamain ha_mode.c:62 Recv ha switch
2021-12-25 20:37:45 dbg-hatalk hb_msg.c:40 Send ha switch, rv 0
2021-12-25 20:37:46 dbg-hamain ha_mode.c:303 In ha mode process, old role SECONDARY -> new role PRIMARY role changed: 1 switch reason: 1
2021-12-25 20:37:46 dbg-hamain ha_mode.c:315 switch SECONDARY -> PRIMARY
2021-12-25 20:37:46 dbg-hamain ha_mode.c:325 HA switch from secondary to primary, the effective factor of the election is Monitor .2021-12-25 20:37:46 dbg-hamain ha_mode.c:101 Send ha mode swith trap, reason:Monitor
2021-12-25 20:38:00 dbg-hamain ha_mode.c:62 Recv ha switch
2021-12-25 20:38:00 dbg-hatalk hb_msg.c:40 Send ha switch, rv 0
2021-12-25 20:38:01 dbg-hamain ha_mode.c:303 In ha mode process, old role PRIMARY -> new role SECONDARY role changed: 1 switch reason: 2
2021-12-25 20:38:01 dbg-hamain ha_mode.c:342 switch PRIMARY -> SECONDARY
2021-12-25 20:38:01 dbg-hamain ha_mode.c:351 HA switch from primary to secondary, the effective factor of the election is Priority .2021-12-25 20:38:01 dbg-hamain ha_mode.c:224 HA device into Secondary mode
Traffic drops down in HA environment
Follow below steps to troubleshoot if the application traffic drops down after in HA environment or HA failover takes place:
1. Verify that HA status on both/all members are correct after failover:
-
Verify there is only one primary role
-
Verify that all HA members have the correct and stable new status
Referring to the above troubleshooting steps in "Unexpected switch over".
2. Verify that the configuration has been synchronized completely
-
Verify that the md5 for SYS & CLI on the primary & secondary nodes via “execute ha md5sum” or “diagnose sys ha confd_status” on the primary node to see if the configuration are identical
FortiWeb # execute ha md5sum
FVVM04TM21001050<Primary>
SYS: D075A17ADDD372423263F4B31ACB8C7F
CLI: 2D1DE97C0C1F1968FB4BFCE530E52A1B
FVVM08TM21000613<Secondary>
SYS: D075A17ADDD372423263F4B31ACB8C7F
CLI: 2D1DE97C0C1F1968FB4BFCE530E52A1B
-
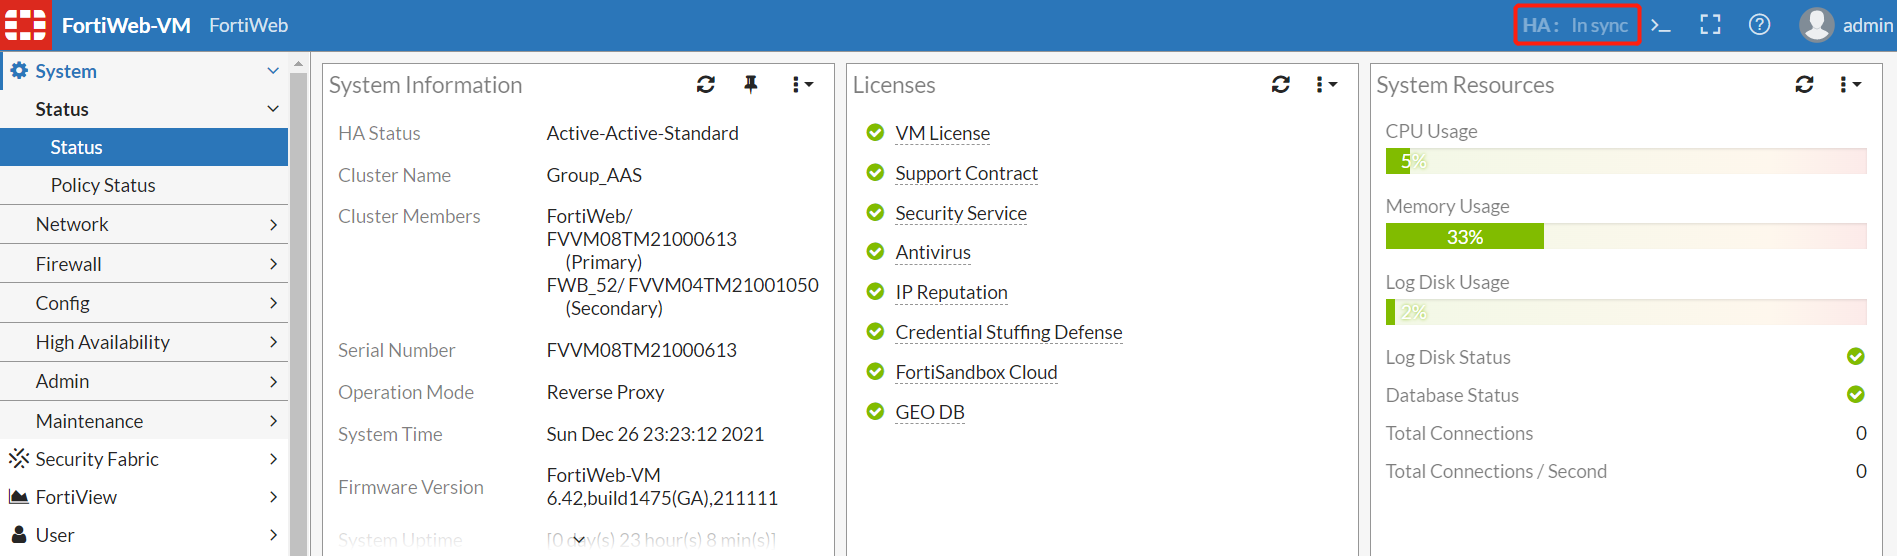
Verify that the Sync status on GUI top menu is “In Sync” (after 6.4 builds)
3. Verify that the requests are received by the new primary (former secondary) appliance:
-
Verify that monitor ports on the former primary and the new primary appliance are configured and connected symmetrically
-
Verify that the route entries on upstream routers are configured correctly so that VIPs on FortiWeb are reachable for the clients initiating the request
-
Check if PING can be successful or ICMP request can be captured on the new primary FortiWeb or the upstream router
-
Check if TCP 3-way handshakes can be successfully between the client and the new primary FortiWeb
-
Check if HTTP/HTTPS request can be captured on the new primary FortiWeb or the upstream router
-
If HTTP/HTTPS requests can be received by the new primary FortiWeb, check if the responses are forwarded back to the upstream router or other intermediate network nodes
-
-
If it’s HA-AAHV mode, check in the same way to confirm if requests are received by the node to which the VIP is distributed.
4. Verify the traffic distribution for Standard Active-Active (AAS) mode:
In AAS mode, the primary appliance distributes the traffic to all the HA members (including itself) according to the load-balancing algorithm. The primary node starts distributing traffic to other nodes from the TCP handshake stage, and will only maintain a distribution table to guarantee the following traffic in the same connection is distributed to the same node, but not maintain sessions between the clients and the primary node itself.
So in this situation, if traffic is distributed to a secondary node, troubleshooting needs to be performed on both the primary node&distributed secondary nodes:
-
Capture packets to check if TCP SYN from client is received by the secondary node;
-
Capture packets to check if TCP SYN ACK from the secondary node is received by the primary node;
-
Capture packets to check if TCP SYN ACK from the secondary node is forwarded out to client by the primary node;
-
Capture packets to check if SSL/TLS session can be established between the client and the secondary node in the same way;
-
Capture packets to check if HTTP traffic is processed by the secondary node in the same way.
The below steps are the detailed troubleshooting methods for some of the above typical network reachable problem after switch over:
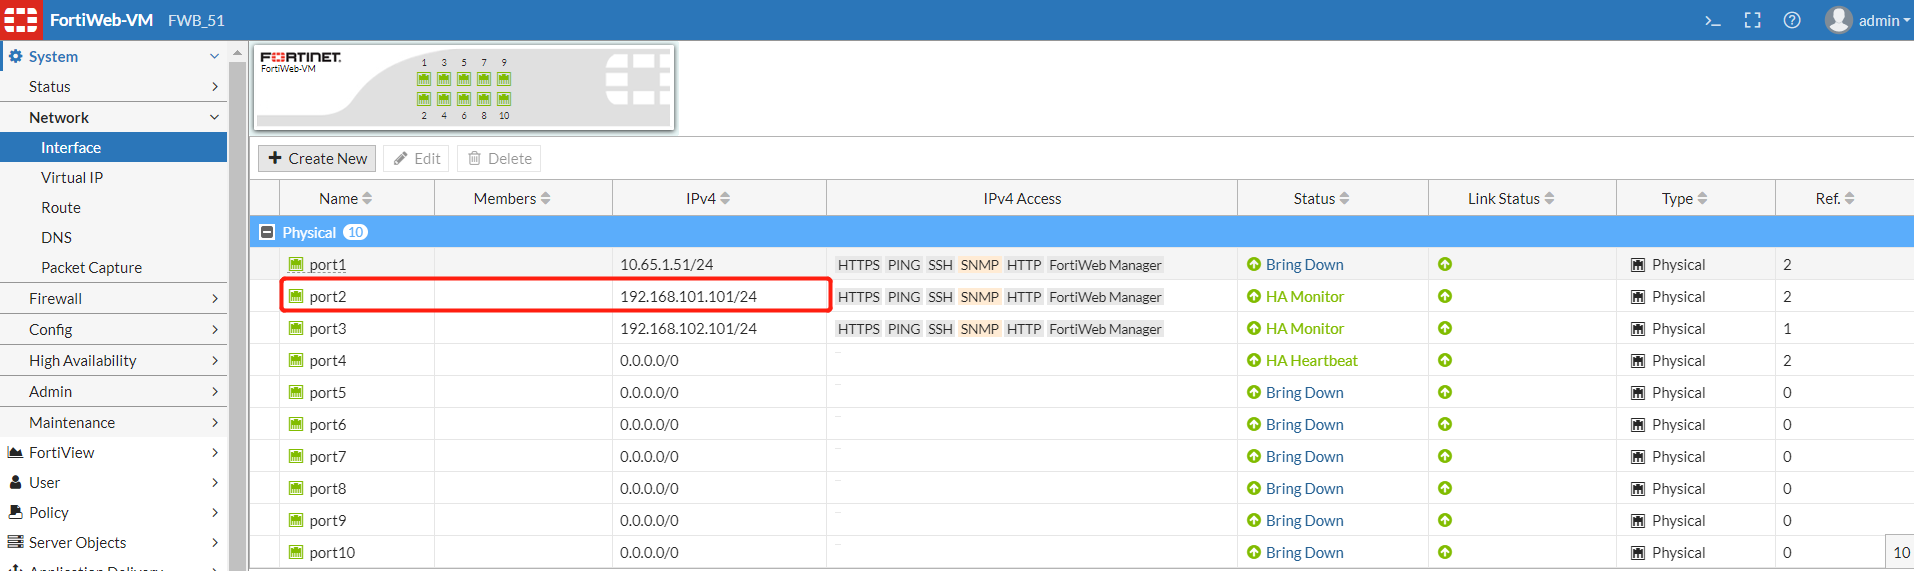
5. Check if the VIP address is bound to the corresponding interface on the primary FortiWeb node
~# ip addr show port2
6: port2: <BROADCAST,MULTICAST,UP,LOWER_UP> mtu 1500 qdisc mq qlen 1000
link/ether 00:09:0f:a0:2c:02 brd ff:ff:ff:ff:ff:ff
inet 192.168.101.101/24 brd 192.168.101.255 scope global port2
valid_lft forever preferred_lft forever
inet 192.168.101.100/24 brd 192.168.101.255 scope global secondary port2
valid_lft forever preferred_lft forever
inet6 fe80::20c:29ff:fee9:9600/64 scope link
valid_lft forever preferred_lft forever
FortiWeb_52 # show system interface port2
config system interface
edit "port2"
set type physical
set ip 192.168.101.101/24
set allowaccess ping ssh snmp HTTP HTTPs FortiWeb-manager
config secondaryip
end
config classless_static_route
end
next
end
FortiWeb_52 # show system vip
config system vip
edit "VIP_01"
set vip 192.168.101.100/24
set interface port2
set index 1
next
end
6. Verify that after switch over, the upstream router has its ARP table (or the switch refreshed its MAC table) refreshed via gratuitous ARP sent out by the new primary FortiWeb node.
Both IP addresses on ports and VIPs will send gratuitous ARP. It’s better to check the ARP table on the upstream router, or the MAC table on the upstream switch.
7. Verify that network cables are working with the correct speed & duplex on the new primary FortiWeb node.
You can check the interfaces on FortiWeb with the below backend command or on the peer router/switch with corresponding diagnose commands.
~# ethtool port1
Settings for port1:
Supported ports: [ TP ]
Supported link modes: 1000baseT/Full
10000baseT/Full
Supported pause frame use: No
Supports auto-negotiation: No
Supported FEC modes: Not reported
Advertised link modes: Not reported
Advertised pause frame use: No
Advertised auto-negotiation: No
Advertised FEC modes: Not reported
Speed: 10000Mb/s
Duplex: Full
Port: Twisted Pair
PHYAD: 0
Transceiver: internal
Auto-negotiation: off
MDI-X: Unknown
Cannot get wake-on-lan settings: Operation not permitted
Link detected: yes
8. If it’s VM FortiWebs running in virtual environment, please check the extra configuration on hypervisors according to above section "HA Key Settings > Extra configuration on hypervisors in VM environment"
9. If the issue still cannot be resolved, you can try to:
-
Disable HA on the FortiWeb node and check if it can be visited with standalone configuration
-
Troubleshoot the issue in standalone mode
HA Synchronization issues
When you are using the HA function for two or more than two FortiWeb devices and the configurations are different between the devices, the elected Primary device will synchronize almost all the configurations (except the hostname, HA priority, etc.) and some system files to other Secondary devices. Normally, the devices will get into the same HA group, and keep in sync, so the HA devices will work as what you want.
The basic synchronization principles:
-
HA group uses the heartbeat link to automatically synchronize most of their configuration and occurs immediately when an appliance joins the group
-
During the synchronization process after an appliance just joins HA, its HA status will be INIT.
If the first sync fails, the primary will attempt to sync again for another 3 times (total 4 times). If the appliance stays in the INIT status for a long time, it mostly indicates a synchronization failure.
After the first complete & successful sync, further configuration sync will be executed in every 30 seconds and just based on configuration diffs.
-
After HA is established, each HA member will generate a MD5 for SYS files and CLI config files. These two MD5 will be identical if the configuration & data are synchronized successfully between the primary and secondary appliances.
The secondary appliance will receive both the synchronized configuration/data and the primary device’s two MD5 values; after it loads the synchronized configuration, it will calculate its own MD5 values and compare with the primary node’s, then judge if the synchronization is successful and complete
-
Configuration synchronization uses TCP on port number 6011 and a reserved IP address (169.254.0.0/16)
-
Synchronization includes: (show in “diagnose sys ha sync-stat” and “diagnose system ha file-stat”)
-
Core CLI-style configuration file (/migadmin/etc/cli_syntax.xml -> ha_not_sync=“2” will not sync)
-
X.509 certificates, certificate request files (CSR), and private keys
-
HTTP error pages
-
FortiGuard IP Reputation Service database
-
FortiGuard Security Service files (attack signatures, predefined data types & suspicious URLs, known web crawlers & content scrapers, global allow list, vulnerability scan signatures)
-
FortiGuard Antivirus signatures
-
Geography-to-IP database
-
-
Configuration settings that are not synchronized:
-
Network interface (IP addresses on interfaces in Active-Active-High-Volume mode, and IP address on the reserved-mgmt-interface in Active-Passive & Active-Active-Standard modes are NOT synchronized)
-
V-zone (Configured in Transparent Proxy & Transparent Inspection modes)
-
Firewall (Configured in Active-Active-High-Volume mode)
-
Static/Policy route (Configured in Active-Active-High-Volume mode)
-
HA static/policy route (Configured in Active-Passive and standard Active-Active modes)
-
RAID level
-
HA active status and priority
-
-
Data that is not synchronized: (Please check the Admin Guide for details)
-
HTTP sessions (In Active-Active-Standard mode, session pickup can be enabled)
-
HTTPS sessions
-
Log messages
-
Generated reports
-
Machine Learning data: will not be synchronized in Active-Active-Standard & Active-Active-High-Volume mode; but will be synchronized in Active-Passive mode in every 10 minutes)
-
However, some errors could happen and the devices could not be in sync status at some times.
FortiWeb provides several methods to troubleshoot the HA configuration synchronization issues:
1. Verify that the heartbeat packet Ethertype is correctly configured and allowed by intermediate switches via which if the heartbeat interfaces of HA members are connected.
-
HA uses Ethertype 0x8893 to synchronize HA configuration, so the switches used to connect heartbeat interfaces require a configuration that allows them.
-
The Ethertype for level2 frames can be configured between 0x8890 and 0x8893.
-
You can use “diagnose network sniffer <hbdev>” to capture packets and see if such packets are sent & received from both HA nodes
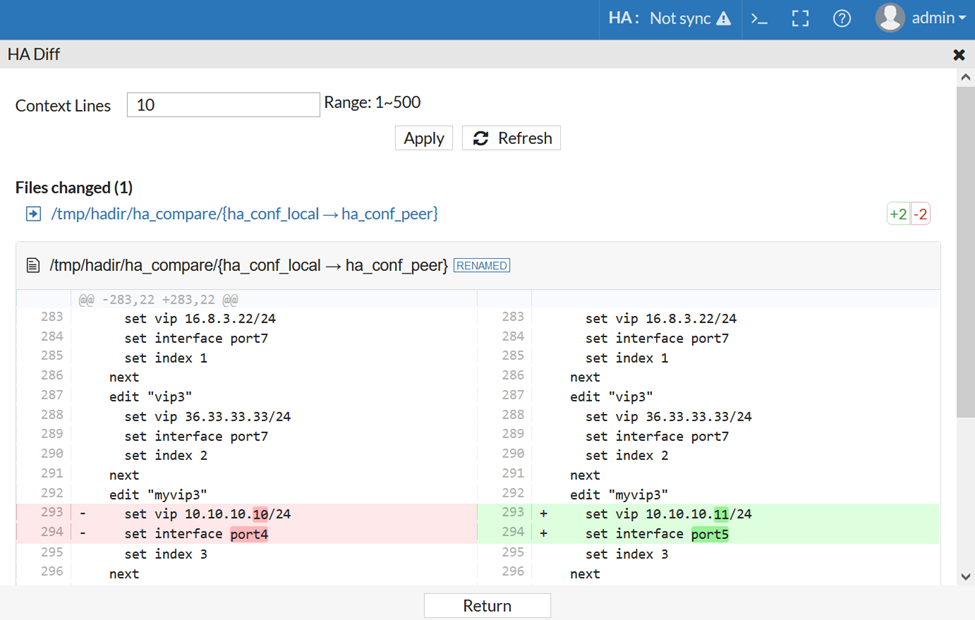
2. Use the HA Diff Toolbar to check the HA status and configuration Diff on GUI.
On 6.4.1 and later releases, FortiWeb adds a new toolbar to show the HA sync status in the toolbar. If the HA devices are not synchronized, the menu will be clickable. After you click the ‘Not sync’ menu, it will prompt one slide page on the right and show the HA differences between the Primary and first different Secondary device. In other words, if you have more than one Secondary devices which are all not synchronized with the Primary device, this new tool will only show the first Secondary difference. After you fix the first Secondary difference, it will show the next difference.
Please note that this HA Diff Tool is only effective on the Primary device.
HA Sync Status on GUI:
|
Status |
Description |
Clickable |
|---|---|---|
|
Standalone |
No HA mode enabled and Standalone mode now |
No |
|
Wait to sync |
Found the Secondary device, not sure about the sync status, please wait some minutes to check the sync status |
No |
|
In sync |
All the HA devices are in sync status |
No |
|
Not sync |
At least one or more Secondary devices are not sync with the Primary node. You can click this menu and show the differences between Primary device and first different Secondary device |
Yes |
|
Secondary |
Current HA device is a secondary node |
No |
|
INIT |
Available on the secondary device when the device just joins HA group and during synchronizing configuration from the primary node |
No |
Note: When the Secondary device joins a HA cluster for the first time, HA status may show as ‘Not sync’. You may not get a difference report when clicking ‘Not sync’ at this time because the secondary device is converting the configuration received from the primary node.
Depending on the size of configuration files, it’ll take several minutes to complete converting the configuration.
Examples 1: Configurations not sync
In the figure below, the Virtual IP configurations are different between the two HA devices. You can modify or remove the differences in the Primary device. Otherwise, you need to backup the entire configurations respectively and contact us.
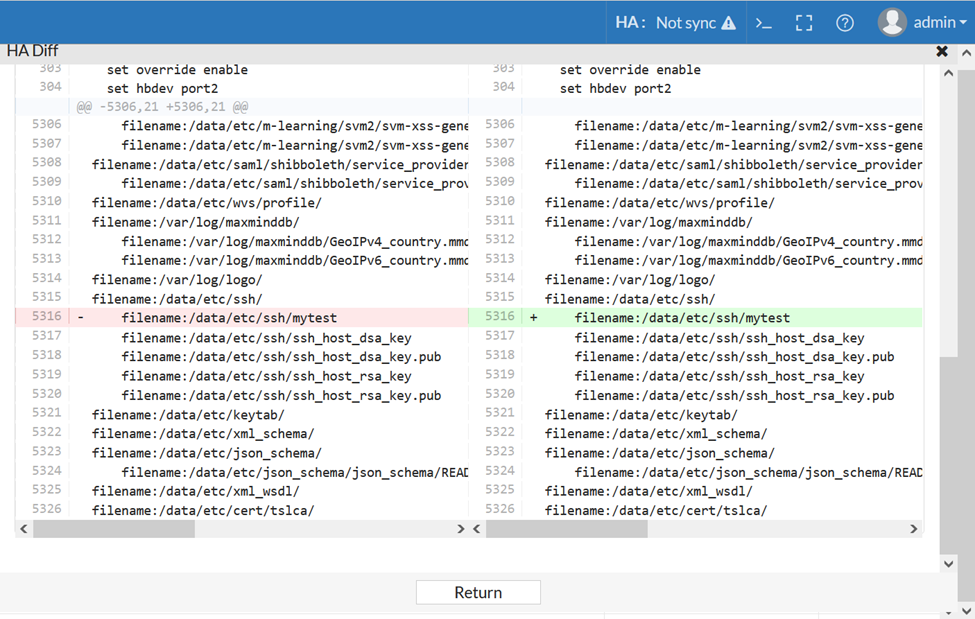
Examples 2: System files not sync
In the figure below, the files ‘/data/etc/ssh/mytest’ are different between the two HA devices
Examples 3: Configurations not sync
In the figure below, although the menu show “Not sync”, when you click it the HA diff page shows “There is no difference between the HA devices.”
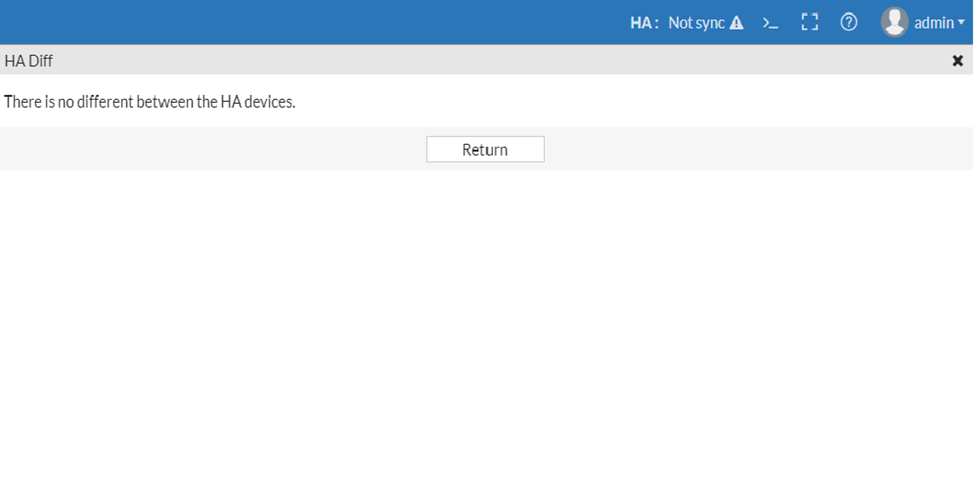
This is because when the Primary device gets the Secondary device not sync status, the Primary device will synchronize the full configurations and some system files to the Secondary, then the Secondary node will receive these files and apply them. This process will also take some time. After the full synchronization, the HA devices are in sync status. Wait a minute, the HA difference menu will show ‘In sync’ status.
If there are lots of differences between the two HA devices, it could take long time to show the differences. Please wait patiently. If you always fail to get the difference for the not sync status or some errors happen when using the HA difference tool, you have other options to check the HA differences.
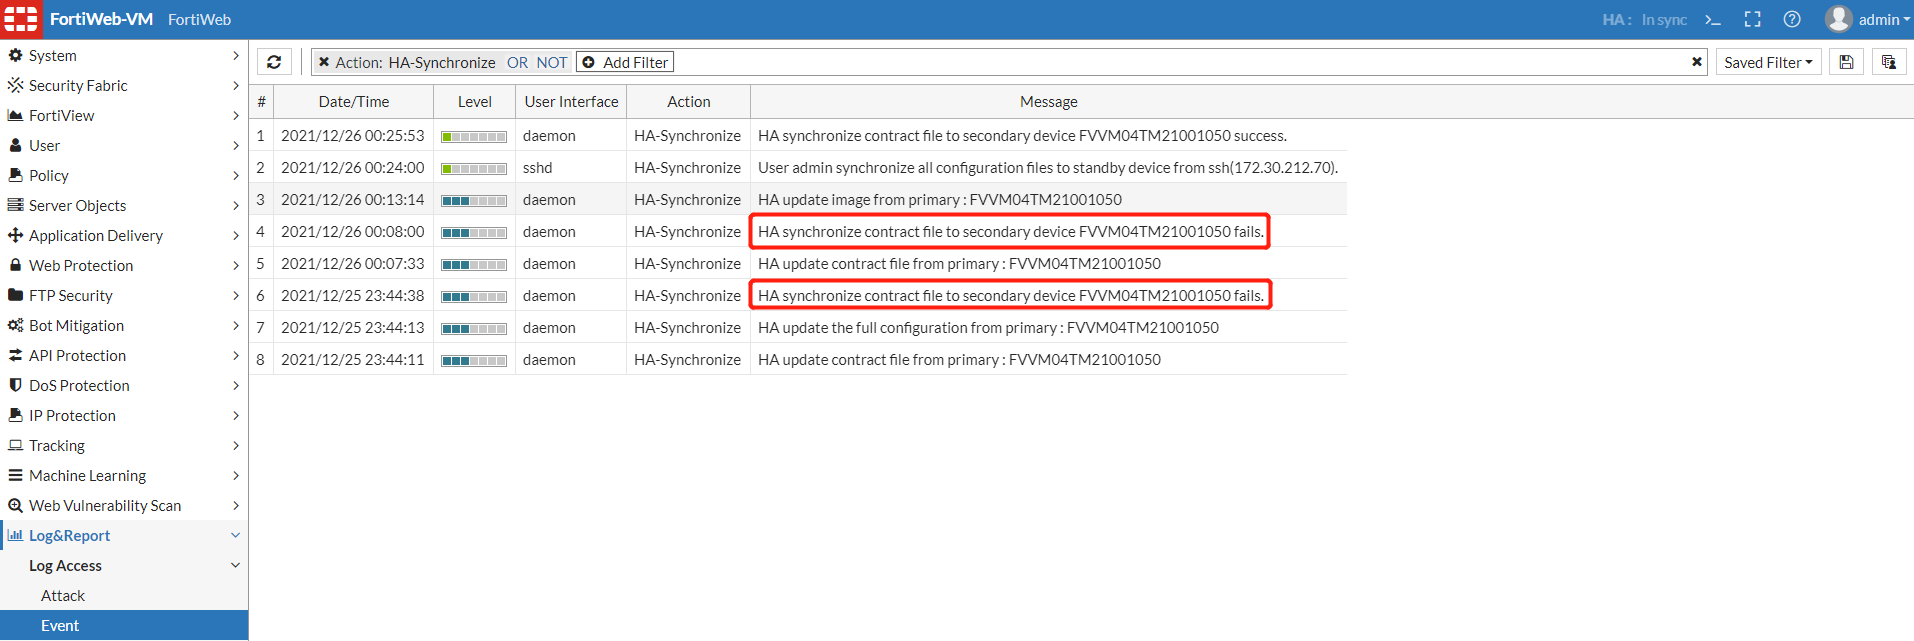
3. Check the Event log to confirm that HA synchronization failure events and the cause.
Log & Report > Log Access > Event > Action: HA-Synchronize.
E.g. Logs will show synchronization fails as below:
4. Use diagnose commands to check the HA sync status and detailed sync data/files on nodes.
If sync failure occurs, the MD5 values on different nodes might be different, and the cfg_state will not be In sync; also, “diagnose system ha sync-stat” will show detailed data or file sync failures.
FortiWeb # diagnose system ha confd_status
HA information
Model=FortiWeb-VM 7.00,build0044(Interim),211223, Mode=active-active-standard Group=11
HA group member information: is_manage_master=1. cfg_state:In sync
LocalSN: FVVM04TM21001050 confd
member cnt: 2
msg_queue:0 file_queue:0 md5_rep_ignore:0 do_md5sum:39
FVVM04TM21001050: Primary
pending:0 update:0 time:0 sync:0 cfg_state:In sync
SYS: D075A17ADDD372423263F4B31ACB8C7F
CLI: 2D1DE97C0C1F1968FB4BFCE530E52A1B
FVVM08TM21000613: Secondary
pending:198485 update:198486 time:198486 sync:0 cfg_state:In sync
SYS: D075A17ADDD372423263F4B31ACB8C7F
CLI: 2D1DE97C0C1F1968FB4BFCE530E52A1B
FortiWeb # diagnose system ha sync-config get-status
The sync config status is enable.
FortiWeb # diagnose system ha file-stat
FortiWeb Security Service:
2022-11-30
Last Update Time: 2021-12-25 Method: Scheduled
Signature Build Number-0.00308
FortiWeb Antivirus Service:
2022-11-30
Last Update Time: 2021-12-25 Method: Scheduled
Regular Virus Database Version-89.08105
Extended Virus Database Version-89.07977
FortiWeb IP Reputation Service:
2022-11-30
Last Update Time: 2021-12-25 Method: Scheduled
Signature Build Number-4.00727
FortiWeb Geodb Service:
Last Update Time: 2021-12-25 Method: Scheduled
GEO Datase Build Number-Fortiweb-Country-Build0107 2021-12-03
FortiWeb Credential Stuffing Defense Service:
2022-11-30
Last Update Time: 2021-12-25 Method: Scheduled
Signature Build Number-1.00351
System files MD5SUM: D075A17ADDD372423263F4B31ACB8C7F
CLI files MD5SUM: 2D1DE97C0C1F1968FB4BFCE530E52A1B
FortiWeb # diagnose system ha sync-stat
Image INIT
Config INIT
System INIT
CLI INIT
Signature SUCCESS
GeoDB SUCCESS
AV SUCCESS
IpReputation SUCCESS
HarvestCredentials SUCCESS
HA sync-stat showed above:
|
Status |
Description |
|---|---|
|
INIT |
Last synchronization completed; system is ready and waiting for next synchronization. |
|
SENDING |
Synchronization is in process; data is sending. |
|
SUCCESS |
Success in data sending; synchronization is complete. |
|
SEND_TIMEOUT |
Data sending timeout; synchronization is incomplete. |
5. Use “diagnose system ha backup-config” to check the synchronized configuration
Use this command to export the configuration file of the HA nodes. It only backs up the configurations synchronized between HA nodes. You can use this command to compare the configuration files between the HA nodes and check which part of the configuration is not synchronized as expected.
FortiWeb # diagnose system ha backup-config
<id> please input peer box index.
<1> Subsidary unit FVVM08TM21000613
<2> Subsidary unit FVVM04TM21001050
FortiWeb # diagnose system ha backup-config 1
Config file /var/log/gui_upload/ha_config_1_20211227002455.tgz has been backed up.
Please download it from System->Maintenance->Backup&Restore by GUI.
FortiWeb # diagnose system ha backup-config 2
FortiWeb #
Then you can check the System > Maintenance > Backup & Restore page, and you will see the GUI file Download/Upload part. Please download the files as the below, it will be very helpful for locating the issue.

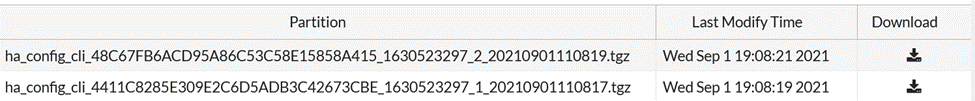
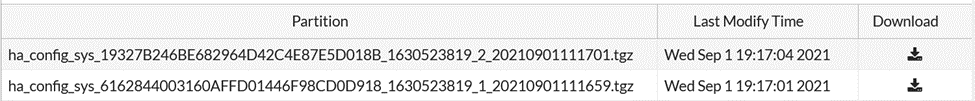
6. Download the backup configuration files and compare them manually.
When configuration not sync occurs, the primary system will archive the current configuration files & the md5 for each domain. You can check and compare them for details.
Depending on the cause of difference (SYS files or CLI configuration), the archive files will be named as “ha_config_cli_xxx” or “ha_config_sys_xxx”.
6. Manually execute ha synchronize.
When you find HA sync failures, you can try to execute ha synchronization manually and see if the problem can be resolved.
FortiWeb # execute ha synchronize
cli CLI configurations
sys System configurations
all CLI & System configurations
avupd antivirus definition,scan engine and proxy update
geodb GEO db file
scanner scanner_integration file
FortiWeb # execute ha synchronize cli
starting synchronize with HA primary…
The secondary appliance will log the synchronization process:
