


Logging
To diagnose problems or track actions that the FortiWeb appliance performs as it receives and processes traffic, configure the FortiWeb appliance to record log messages.
Log messages can record attack, system, and traffic events. They are also the source of information for alert email and many types of reports.
When you configure protection profiles, many components include an Action option that determines the response to a detected violation. Actions combine with severity levels and trigger policies to determine whether and where a log message, message on the Attack Log Console widget, SNMP trap, and/or alert email will be generated.
Before logging will occur, you must first enable and configure it.
About logs & logging
FortiWeb appliances can log many different network activities and traffic including:
- Overall network traffic
- System-related events including system restarts and HA activity
- Matches of policies with Action set to a log-generating option such as Alert
Each type can be useful during troubleshooting or forensic investigation. For more information about log types, see Log types.
You can select a priority level that log messages must meet in order to be recorded. For details, see Log severity levels.
For a detailed description of each FortiWeb log message, as well as log message structure, see the FortiWeb Log Message Reference.
The FortiWeb appliance can save log messages to its memory, or to a remote location such as a Syslog server or FortiAnalyzer appliance. For details, see Configuring logging. The FortiWeb appliance can also use log messages as the basis for reports. For details, see Reports.
The FortiWeb appliance also displays event and attack log messages on the dashboard. For details, see Attack Log widget and Event Log Console widget.
Each log file can have at most 51,200 logs, and each log size is limited to 4k; thus, each log file size is limited to 200M.
See also
Log types
Each log message contains a Type (type) field that indicates its category, and in which log file it is stored.
FortiWeb appliances can record the following categories of log messages:
| Event | Displays administrative events, such as downloading a backup copy of the configuration, and hardware failures. |
| Traffic | Displays traffic flow information, such as HTTP/HTTPS requests and responses. |
| Attack | Displays attack and intrusion attempt events. |
|
|
Avoid recording highly frequent log types such as traffic logs to the local hard disk for an extended period of time. Excessive logging frequency can cause undue wear on the hard disk and may cause premature failure. |
Log severity levels
Each log message contains a Severity (pri) field that indicates the severity of the event that caused the log message, such as pri=warning.
Log severity levels
|
Level (0 is greatest) |
Name | Description |
|---|---|---|
| 0 | Emergency | The system has become unusable. |
| 1 | Alert | Immediate action is required. |
| 2 | Critical | Functionality is affected. |
| 3 | Error | An error condition exists and functionality could be affected. |
| 4 | Warning | Functionality could be affected. |
| 5 | Notification | Information about normal events. |
| 6 | Information | General information about system operations. |
For each location where the FortiWeb appliance can store log files (disk, memory, Syslog or FortiAnalyzer), you can define a severity threshold. The FortiWeb appliance will store all log messages equal to or exceeding the log severity level you select.
For example, if you select Error, the FortiWeb appliance will store log messages whose log severity level is Error, Critical, Alert, and Emergency.
|
|
Avoid recording log messages using low log severity thresholds such as information or notification to the local hard disk for an extended period of time. A low log severity threshold is one possible cause of frequent logging. Excessive logging frequency can cause undue wear on the hard disk and may cause premature failure. |
For details, see Configuring log destinations.
Log rate limits
When FortiWeb is defending your network against a DoS attack, the last thing you need is for performance to decrease due to logging, compounding the effects of the attack. By the nature of the attack, these log messages will likely be repetitive anyway. Similarly, repeated attack log messages when a client has become subject to a period block yet continues to send requests is of little value, and may actually be distracting from other, unrelated attacks.
To optimize logging performance and help you to notice important new information, within a specific time frame, FortiWeb will only make one log entry for these repetitive events. It will not log every occurrence. To adjust the interval at which FortiWeb will record identical log messages during an ongoing attack, see max-dos-alert-interval <seconds_int> in the FortiWeb CLI Reference:
HTTPs://docs.fortinet.com/product/fortiweb/
Configuring logging
You can configure FortiWeb to store log messages either locally (to the hard disk) and/or remotely (to a Syslog server, ArcSight server, Azure Event Hub server, QRadar server, or FortiAnalyzer appliance). Your choice of storage location may be affected by several factors, including the following:
- Logging only locally may not satisfy your requirements for off-site log storage.
- Attack logs and traffic logs cannot be logged to local memory.
- Very frequent logging may cause undue wear when stored on the local hard drive. A low severity threshold is one possible cause of frequent logging. For more information on severity levels, see Log severity levels.
For information on viewing locally stored log messages, see Viewing log messages.
To configure logging
Set the severity level threshold that log messages must meet or exceed in order to be sent to each log storage device. If you will store logs remotely, also configure connectivity information such as the IP address. For details, see Configuring log destinations, Configuring Syslog settings, Configuring FortiAnalyzer policies, and Configuring SIEM policies
Group Syslog, FortiAnalyzer, and SIEM settings and select those groups in Trigger Action settings throughout the configuration of web protection features. For details, see Configuring triggers.
Enable logging in general. For details, see Enabling log types, packet payload retention, & resource shortage alerts.
If you want to log attacks, select an Alert option as the Action setting when configuring attack protection.
Monitor your log messages via the web UI or through alert email for events that require action from network administrators. For details, see Viewing log messages and Alert email.
Configure reports that are derived from log data to review trends in your network. For details, see Reports.
Enabling log types, packet payload retention, & resource shortage alerts
You can enable or disable logging for each log type, as well as configure system alert thresholds, and which policy violations should cause the appliance to retain the TCP/IP packet payload (HTTP headers and a portion of the HTTP body, if any) that can be viewed with its corresponding log message.
For more information on log types, see Log types.
To enable logging
Go to Log&Report > Log Config > Other Log Settings.
To access this part of the web UI, your administrator’s account access profile must have Read and Write permission to items in the Log & Report category. For details, see Permissions.
Configure these settings:
| Enable Attack Log | Enable to log violations of attack policies, such as server information disclosure and attack signature matches, if that feature is configured such that Action is set to Alert, Alert & Deny, or Alert & Erase. |
| Enable Event Log | Enable to log local events, such as administrator logins or rebooting the FortiWeb appliance. |
| Ignore SSL Errors | Allows you to stop FortiWeb from logging SSL errors. This is useful when you use high-level security settings, which generate a high volume of these types of errors. |
| Retain Packet Payload For |
Mark the check boxes of the attack types or validation failures to retain the buffer from FortiWeb’s HTTP parser. Packet retention is enabled by default for most types. Packet payloads supplement the log message by providing part of the actual data that matched the regular expression, which may help you to fine-tune your regular expressions to prevent false positives, or to examine changes to attack behavior for subsequent forensic analysis. To view packet payloads, see Viewing packet payloads. If packet payloads could contain sensitive information, you may need to obscure those elements. For details, see Obscuring sensitive data in the logs. Note: FortiWeb retains only the first 4 KB of data from the offending HTTP request payload that triggered the log message. If you require forensic analysis of, for example, buffer overflow attacks that would exceed this limit, you must implement it separately. |
| CPU Utilization | Select a threshold level (60%–99%) beyond which CPU usage triggers an event log entry. |
| Memory Utilization | Select a threshold level (60%–99%) beyond which memory usage triggers an event log entry. |
| Log Disk Utilization | Select a threshold level (60%–99%) beyond which log disk usage triggers an event log entry. |
| Trigger Policy | Select an trigger, if any, to use when memory usage or CPU usage reaches or exceeds its specified threshold. |
Click Apply.
Traffic Log and packet payloads can only be enabled via CLI command config log traffic-log.
config log traffic-log
set packet-log {enable | disable}
set status {enable | disable}
end
Traffic Log
To avoid unnecessary resource consumption, the system will not generate traffic log for all server policies unless specified. After enabling status in config log traffic-log, you also need to enable the traffic log setting in Server Policy through GUI or CLI config server-policy policy.
-
If the
statusis set todisableinconfig log traffic-log, the system won't generate traffic log even if you have enabled it in Server Policy. -
If traffic log is:
-
Enabled in
config log traffic-log, -
Enabled in server policy A,
-
Disabled in server policy B,
then the system will only generate traffic log for server policy A.
-
Packet payloads
When packet-log is enabled, only HTTP request traffic packets are retained (not HTTP responses), and only the first 4 KB of the payload from the buffer of FortiWeb’s HTTP parser.
Packet payloads supplement the log message by providing the actual request body, which may help you to fine-tune your regular expressions to prevent false negatives, or to examine changes to attack behavior for subsequent forensic analysis.
To view packet payloads, see Viewing packet payloads.
Tips:
-
Because resources for this feature increase as your traffic increases, if you do not need traffic data, disable this feature to improve performance and improve hardware life.
-
Retaining traffic packet payloads is resource intensive. To improve performance, only enable this option while necessary.
See also
- Configuring log destinations
- Viewing log messages
- Viewing packet payloads
- Downloading log messages
- Obscuring sensitive data in the logs
Configuring log destinations
You can choose and configure the storage methods for log information, and/or email alerts when logs have occurred. Alert email can be enabled here, but must be configured separately first. For details, see Alert email.
You can also configure FortiWeb to send log information to an FTP or TFTP server in report form.
For logging accuracy, you should verify that the FortiWeb appliance’s system time is accurate. For details, see Setting the system time & date.
|
|
Avoid recording highly frequent log types such as traffic logs to the local hard disk for an extended period of time. Excessive logging frequency can cause undue wear on the hard disk and may cause premature failure. |
To configure log settings
Go to Log&Report > Log Config > Global Log Settings.
To access this part of the web UI, your administrator’s account access profile must have Read and Write permission to items in the Log & Report category. For details, see Permissions.
Configure these settings:
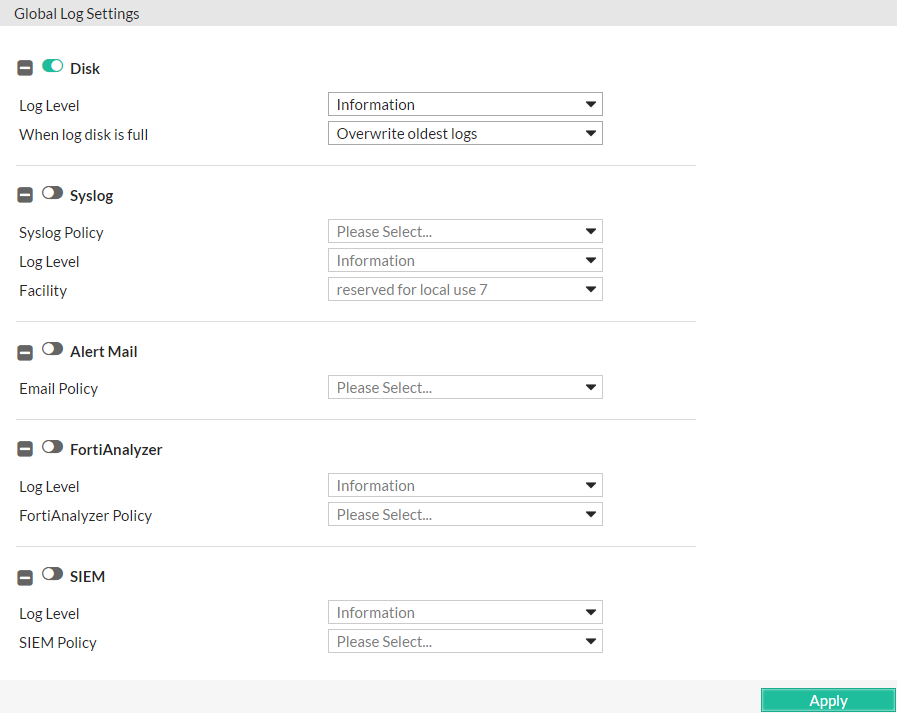
| Disk |
Enable to record log messages to the local hard disk on the FortiWeb appliance. If the FortiWeb appliance is logging to its hard disk, you can use the web UI to view log messages stored locally on the FortiWeb appliance. For details, see Viewing log messages. |
|
| Log Level |
Select the severity level that a log message must equal or exceed in order to be recorded to this storage location. For information about severity levels, see Log severity levels. Caution: Avoid recording log messages using low severity thresholds such as information or notification to the local hard disk for an extended period of time. A low log severity threshold is one possible cause of frequent logging. Excessive logging frequency can cause undue wear on the hard disk and may cause premature failure. |
|
| When log disk is full |
Select what the FortiWeb appliance will do when the local disk is full and a new log message occurs, either:
|
|
| Syslog |
Enable to store log messages remotely on a Syslog server. Caution: Enabling Syslog could result in excessive log messages being recorded in Syslog. Syslog entries are controlled by Syslog policies and trigger actions associated with various types of violations. If this option is enabled, but a trigger action is not selected for a specific type of violation, every occurrence of that violation will be transmitted to the Syslog server in the Syslog Policy field. Note: Logs stored remotely cannot be viewed from the FortiWeb web UI. |
|
| Syslog Policy | Select the settings to use when storing log messages remotely. The Syslog settings include the address of the remote Syslog server and other connection settings. For details, see Configuring Syslog settings. | |
| Log Level | Select the severity level that a log message must equal or exceed in order to be recorded to this storage location. For details about severity levels, see Log severity levels. | |
| Facility |
Select the facility identifier that the FortiWeb appliance will use to identify itself when sending log messages to the first Syslog server. To easily identify log messages from the FortiWeb appliance when they are stored on the Syslog server, enter a unique facility identifier, and verify that no other network devices use the same facility identifier. |
|
|
Custom Fields |
Click Add to add custom fields in syslog records. For example, add the hostname in syslogs so that you can easily track the logs for specific hosts. In the HA deployment, the configuration is synchronized among the HA group members but meanwhile each member should have its own hostname recorded in the syslog. In this case, you can use the variable in the custom fields value such as |
|
| Alert Mail |
Enable to generate alert email when log messages are created. Distribution of alert email is controlled by email policies and trigger actions associated with various types of violations. If this option is enabled, but a trigger action is not selected for a specific type of violation, every occurrence of that violation will result in an alert email to the individuals associated with the policy selected in the Email Policy field. Note: Alert email are not sent for traffic logs. Note: Before enabling this option, verify that log frequency is not too great. If logs are very frequent, enabling this option could decrease performance and cause the FortiWeb appliance to send you many alert email messages. |
|
| Email Policy | Select the email settings to use for alert emails. For details, see Configuring email settings. | |
| FortiAnalyzer |
Enable to store log messages remotely on a FortiAnalyzer appliance. Compatibility varies. See the FortiAnalyzer Release Notes (HTTP://docs.fortinet.com/fortianalyzer/release-information). For example, FortiAnalyzer 5.0.6 is tested compatible with FortiWeb 5.1.1 and 5.0.5. Log entries to FortiAnalyzer are controlled by FortiAnalyzer policies and trigger actions associated with various types of violations. If this option is enabled, but a trigger action has not been selected for a specific type of violation, every occurrence of that violation will be recorded to the FortiAnalyzer specified in FortiAnalyzer Policy. Note: Before enabling this option, verify that log frequency is not too great. If logs are very frequent, enabling this option could decrease performance and cause the FortiWeb appliance to send many log messages to FortiAnalyzer. Note: Logs stored remotely cannot be viewed from the FortiWeb web UI. |
|
| FortiAnalyzer Policy | Select the settings to use when storing log messages remotely. FortiAnalyzer settings include the address and other connection settings for the remote FortiAnalyzer. For details, see Configuring FortiAnalyzer policies. | |
| Log Level | Select the severity level that a log message must equal or exceed in order to be recorded to this storage location. For details about severity levels, see Log severity levels. | |
| SIEM |
Enable to store log messages to a SIEM (Security Information and Event Management) server. According to the specified SIEM policy, FortiWeb will carry out one of the following actions:
FortiWeb sends log entries in CEF (Common Event Format) format. There is a 256 byte limit for URLs. If this option is enabled, but no trigger action is selected for a specific type of violation, FortiWeb records every occurrence of that violation to the resource specified by SIEM Policy. Note: Before you enable this option, verify that log frequency is not too great. If logs are very frequent, enabling this option can decrease performance and cause the FortiWeb appliance to send many log messages to the resource. Note: You cannot view logs stored remotely from the FortiWeb web UI. |
|
| Log Level | Select the severity level that a log message must equal or exceed in order to be recorded to this storage location. For information about severity levels, see Log severity levels. | |
| SIEM Policy | Select the settings to use when storing log messages remotely. SIEM settings configure a connection to the storage resource. For details, see Configuring SIEM policies. | |
Click Apply.
Enable the log types that you want your log destinations to receive. For details, see Enabling log types, packet payload retention, & resource shortage alerts.
See also
- Configuring log destinations
- Viewing log messages
- Downloading log messages
- Enabling log types, packet payload retention, & resource shortage alerts
- Alert email
- Configuring Syslog settings
- Configuring FortiAnalyzer policies
FortiWeb and Splunk
Syslog now supports Splunk log server, you can configure FortiWeb to send logs to Splunk server for log analyzing and presenting in forms of histogram, pie chart, and timing diagram, etc.
About Splunk
Splunk Inc. (NASDAQ: SPLK) is the market leader in analyzing machine data to deliver Operational Intelligence for security, IT and the business. Splunk® software provides the enterprise machine data fabric that drives digital transformation. Splunk Enterprise makes it simple to collect, analyze and act upon the untapped value of the big data generated by your technology infrastructure, security systems and business applications—giving you the insights to drive operational performance and business results.
Fortinet FortiWeb App for Splunk
The FortinetFortiWeb App for Splunk provides real-time, historical dashboard and analytical reports on threats, traffic, events for all products across the FortiWeb physical and virtual appliances. The integrated solution pinpoints threats and attacks with faster response times without long exposure in unknown troubleshooting state.With the massive set of logs and big data aggregation through Splunk, the FortinetFortiWeb App for Splunk is certified with pre-defined threat monitoring and performance indicators that guide network security practices a lot easier in the datacenter. As the de facto trending dashboard for many enterprises or service providers, IT administrators can also modify the regular expression query to custom fit for advanced security reporting and compliance mandates.
Fortinet FortiWeb App for Splunk: HTTPs://splunkbase.splunk.com/app/4627/
|
|
FortinetFortiWeb App depends on the Add-on to work properly. Make sure FortinetFortiWeb Add-on for Splunk has been installed before you proceed. |
Fortinet FortiWeb Add-on for Splunk
FortinetFortiWeb Add-On for Splunk is the technical add-on (TA) developed by Fortinet, Inc. The add-on enables Splunk Enterprise to ingest or map attack, traffic and event logs collected from FortiWeb physical and virtual appliances across domains. The key features include:
- Streamlining authentication and access from FortiWeb such as administrator login, user login to Splunk Enterprise Security Access Center
- Mapping FortiWeb threats report into Splunk Enterprise Security Endpoint Malware Center
- Ingesting attack logs, traffic logs, and event logs etc.
Fortinet FortiWeb Add-on for Splunk: HTTPs://splunkbase.splunk.com/app/4626/
Deployment prerequisites
- Splunk version 7.2.5 or later
- FortiWebAdd-On for Splunk
- FortiWeb App for Splunk version 6.2.0 and later
- A Splunk.com username and password
Splunk configuration
- Click the gear (Manage Apps) from Splunk Enterprise.
- Click Browse more apps, and search for FortiWeb.
- Install Fortinet FortiWeb Add-on for Splunk.
- Then install Fortinet FortiWeb App for Splunk.
- Restart Splunk Enterprise.
- From Settings, click Data Inputs under Data.
- Click Add new in the UDP line to create a new UDP input.
- Create a UDP data source, for example, on Port 514.
- Click Next.
- For Source type, click Select tab. Click Select Source Type, enter "FortiWeb" in the filter box, and select "FortiWeb_log".
Fortinet FortiWeb Add-On for Splunk will by default automatically extract FortiWeb log data from inputs with sourcetype 'FortiWeb_log'. - For App context, select Fortinet FortiWeb App for Splunk.
- Click Review to check the items.
- Click Submit.
FortiWeb configuration by GUI and CLI
Configure FortiWeb GUI to send logs to Splunk server.
- Log into FortiWeb with your username and password.
- Go to Log&Report > Log Policy > Syslog Policy.
- Refer to Configuring Syslog settings for the settings. For IP Address(IPv4), enter the Splunk server IP address.
- Click OK.
- Go to Log&Report > Log Config > Global Log Settings.
- For Syslog, select the Splunk related policy created above.
- Or go to Log&Report > Log Policy > Trigger Policy.
- Select the Splunk related policy created above for Syslog Policy.
Configure FortiWeb by CLI Console.
- Log into FortiWeb CLI Console.
- Run the commands below to set the Syslog policy and configure Splunk server IP.
config log syslog-policy
edit syslog-policy_1
config syslog-server-list
edit 1
set server 1.1.1.1
set port 514
end
end
- Apply the Syslog policy in global log setting.
config log syslogd
edit policy policy_1
set status enable
end
- Or apply the Syslog policy in trigger policy, and apply the trigger policy in XML validation rule, for example.
config log trigger policy
edit trigger_policy_1
set syslog-policy syslog-policy_1
end
config waf xml-validation rule
edit xml-validation-rule_1
set trigger_policy_1
end
Logs verification on Splunk server
To verify whether logs have been received by Splunk server
- On Splunk web UI, go to Apps > Search & Reporting.
- If attack logs have been sent to Splunk, enter 'sourcetype="FortiWeb_attack"' in the search box. Change the time range if necessary. The attack logs will be listed below.
- If audit logs have been sent to Splunk, enter 'sourcetype="FortiWeb_event"' in the search box. Change the time range if necessary. The audit logs will be listed below.
- Go to the dashboard of Fortinet FortiWeb App for Splunk, from the Security Overview, Attack, and Event tabs, you can see data parsed and presented.
Troubleshooting
What to do if data is not shown up in the Dashboards?
- Go to Settings > Data Inputs. Verify that you have a UDP data input enabled on port ,for example, 514.
- Go to Settings > Indexes. Verify that your Index (typically main) is receiving data and that the Latest Event is recent. If not, verify the FortiWeb Syslog settings are correct and that it can reach the Splunk server.
Obscuring sensitive data in the logs
HTTP requests from the clients sometimes contain sensitive information, such as password, ID number, and phone number. These sensitive information could appear in the packet payloads accompanying attack log and traffic log messages, especially when packet log is enabled. The sensitive data might be disclosured when access to FortiWeb's Log Access pages. You can configure the FortiWeb appliance to hide specified parameters and values that contain sensitive data using regular expressions.
|
|
Sensitive data definitions are not retroactive. They will hide strings in subsequent log messages, but will not affect existing ones. |
To exclude custom sensitive data from log packet payloads
Go to Log&Report > Log Config > Sensitive Data Logging.
To access this part of the web UI, your administrator’s account access profile must have Read and Write permission to items in the Log & Report category. For details, see Permissions.
Click Create New.
In Name, type a unique name that can be referenced in other parts of the configuration. The maximum length is 63 characters.
Select either General Mask (a regular expression that will match any substring in the packet payload) or Field Mask (a regular expression that will match only the value of a specific form input).
-
In the field next to General Mask, type a regular expression that matches all the strings or numbers that you want to obscure in the packet payloads.
For example, if a parameter in the request is named as 'password' and the value contains user's password, such as
username=Bob&password=e!$38Tgh*&30u, to hide the 'password' parameter, you could enter:password=.*
Then the General Mask rule result will be
username=Bob&**********************.If you enter:
word=.*
Then the General Mask rule result will be
username=Bob&pass******************.Valid expressions must not start with an asterisk (
*). The maximum length is 256 characters. -
For Field Mask, in the left-hand field (Field Name), type a regular expression that matches all and only the input names whose values you want to obscure. (The input name itself will not be obscured. If you wish to do this, use General Mask instead.) Then, in the right hand field (Field Value), type a regular expression that matches all input values that you want to obscure. Valid expressions must not start with an asterisk (
*). The maximum length is 256 characters.For example, if a parameter in the request is named as 'password' and the value contains user's password, such as
username=Bob&password=e!$38Tgh*&30u, to hide the 'password' parameter, you could enter Field Name with:passwordand enter Field Value with:
.*Then the Field Mask rule result will be
username=Bob&password=*************. Only parameter value would be masked.Field Mask only supports the HTTP parameters that is in the format:
parameter1=value1¶meter2=value2¶meterkey3=value3, which means the HTTP request method must be "GET" or "POST" with Content-Type
application/x-www-form-urlencoded. For the other parameter format please use General Mask.
|
|
Field masks using asterisks are greedy: a match for the parameter’s value will obscure it, but will also obscure the rest of the parameters in the line. To avoid this, enter an expression whose match terminates with, but does not consume, the parameter separator. For example, if parameters are separated with an ampersand ( & ), and you want to obscure the value of the Field Name username but not any of the parameters that follow it, you could enter the Field Value:.*?(?=\&)This would result in: |
Click OK.
On the top right side of the page, mark one or both of the following check boxes:
- Enable Predefined Rules—Use the predefined credit card number and password data types.
- Enable Custom Rules—Use your own regular expressions to define sensitive data.
When viewing new log messages, data types matching the predefined rules or custom rules are replaced with a string of asterisks.
To test a regular expression, click the >> (test) button. This opens the Regular Expression Validator window where you can fine-tune the expression. For details, see Regular expression syntax.
Configuring Syslog settings
To store log messages remotely on a Syslog server, you first create the Syslog connection settings.
Syslog settings can be referenced by a trigger, which in turn can be selected as the trigger action in a protection profile, and used to send log messages to one or more Syslog servers whenever a policy violation occurs.
You can use each Syslog policy to configure connections to up to 3 Syslog servers.
|
|
Logs stored remotely cannot be viewed from the FortiWeb web UI. If you need to view logs from the web UI, also enable local storage. For details, see Enabling log types, packet payload retention, & resource shortage alerts. |
To configure Syslog policies
Before you can log to Syslog, you must enable it for the log type that you want to use as a trigger. For details, see Enabling log types, packet payload retention, & resource shortage alerts.
- Go to Log&Report > Log Policy > Syslog Policy.
- To access this part of the web UI, your administrator’s account access profile must have Read and Write permission to items in the Log & Report category. For details, see Permissions.
- Click Create New.
- If the policy is new, in Policy Name, type the name of the policy as it will be referenced in the configuration.
- Click Create New.
- In IP Address, enter the address of the remote Syslog server.
- In Port, enter the listening port number of the Syslog server. The default is 514.
- Select the format of the system log. Options are Default, CSV and CEF. Note that the CEF is for Syslog server, not for SIEM. If your receiver is a SIEM server such as Azure Sentinel, please refer to Configuring SIEM policies
- Mark the Enable TLS check box if you want to create a TLS connection between the FortiWeb and the Syslog server to protect the log messages transport.
- Select the custom fields you have defined in Log&Report > Log Config > Global Log Settings. They will be attached to the syslog records.
- Click OK.
- Repeat the Syslog server connection configuration for up to two more servers, if required.
To verify logging connectivity, from the FortiWeb appliance, trigger a log message that matches the types and severity levels that you have chosen to store on the remote host. Then, on the remote host, confirm that it has received that log message.
If the remote host does not receive the log messages, verify the FortiWeb appliance’s network interfaces (see Configuring the network interfaces) and static routes (see Adding a gateway), and the policies on any intermediary firewalls or routers. If ICMP is enabled on the remote host, try using the execute traceroute command to determine the point where connectivity fails. For details, see the FortiWeb CLI Reference:
HTTPs://docs.fortinet.com/product/fortiweb/
See also
- Configuring log destinations
- Viewing log messages
- Enabling log types, packet payload retention, & resource shortage alerts
- Configuring triggers
- Configuring log destinations
- Obscuring sensitive data in the logs
Configuring FortiAnalyzer policies
Before you can store log messages remotely on a FortiAnalyzer appliance, you must first create FortiAnalyzer connection settings.
Once you create FortiAnalyzer connection settings, it can be referenced by a trigger, which in turn can be selected as a trigger action in a protection profile, and used to record policy violations.
|
|
Logs stored remotely cannot be viewed from the web UI of the FortiWeb appliance. If you require the ability to view logs from the web UI, also enable local storage. For details, see Enabling log types, packet payload retention, & resource shortage alerts. |
To configure FortiAnalyzer policies
Before you can log to FortiAnalyzer, you must enable logging for the log type that you want to use as a trigger. For details, see Enabling log types, packet payload retention, & resource shortage alerts.
Go to Log&Report > Log Policy > FortiAnalyzer Policy.
To access this part of the web UI, your administrator’s account access profile must have Read and Write permission to items in the Log & Report category. For details, see Permissions.
Click Create New.
For Policy Name, enter a unique name that other parts of the configuration can reference. The maximum length is 63 characters.
Click OK.
To add a FortiAnalyzer Server to the policy, click Create New.
Configure the IP Address (IPV4).
Click OK.
Confirm with the FortiAnalyzer administrator that the FortiWeb appliance was added to the FortiAnalyzer appliance’s device list, allocated sufficient disk space quota, and assigned permission to transmit logs to the FortiAnalyzer appliance. For details, see the FortiAnalyzer Administration Guide:
HTTP://docs.fortinet.com/fortianalyzer/admin-guides
To verify logging connectivity, from the FortiWeb appliance, trigger a log message that matches the types and severity levels that you have chosen to store on the remote host. Then, on the remote host, confirm that it has received that log message.
If the remote host does not receive the log messages, verify the FortiWeb appliance’s network interfaces (see Configuring the network interfaces) and static routes (see Adding a gateway), and the policies on any intermediary firewalls or routers. If ICMP ECHO_RESPONSE (pong) is enabled on the remote host, try using the execute traceroute command to determine the point where connectivity fails. For details, see the FortiWeb CLI Reference:
HTTPs://docs.fortinet.com/product/fortiweb/
Configuring SIEM policies
Before you store log messages remotely on a SIEM resource, you create SIEM connection settings and add them to a trigger configuration. Then you select the trigger in a protection profile.
|
|
You cannot use the web UI to view logs stored remotely. To view logs from the web UI, also enable local storage. For details, see Enabling log types, packet payload retention, & resource shortage alerts. |
To configure SIEM policies
Before you can log to the resource, you enable logging for the log type that you want to use as a trigger. For details, see Enabling log types, packet payload retention, & resource shortage alerts.
Go to Log&Report > Log Policy > SIEM Policy.
To access this part of the web UI, your administrator’s account access profile must have Read and Write permission to items in the Log & Report category. For details, see Permissions.
Click Create New.
Enter a Policy Name for the policy. You will use the name to refer to the policy in other parts of the configuration.
Click OK.
Click Create New, and then do one of the following:
- To configure a connection to an ArcSight server, for Policy Type, select ArcSight CEF and enter an IP Address(IPv4) and Port for the server.
- To configure a connection to an QRadar server, for Policy Type, select QRadar CEF and enter an IP Address(IPv4) and Port for the server.
- To configure a connection to an Azure Event Hub, for Policy Type, select Azure CEF.
The Azure CEF policy type requires you to complete Azure event hub settings through theconfig system eventhubCLI command or Azure PowerShell. For details, see the FortiWeb CLI Reference (HTTPs://docs.fortinet.com/product/fortiweb/) and FortiWeb-VM Azure Install Guide (HTTP://docs.fortinet.com/fortiweb/hardware).
Click OK.
If required, add additional resources to the policy.
To verify logging connectivity, from the FortiWeb appliance, trigger a log message that matches the types and severity levels that you have chosen to store on the remote resource. Then, on the remote resource, confirm that it has received that log message.
If a SIEM server does not receive the log messages, verify FortiWeb’s network interfaces (see Configuring the network interfaces) and static routes (see Adding a gateway), and the policies for any intermediary firewalls or routers. If ICMP ECHO_RESPONSE (pong) is enabled on the remote host, try using the execute traceroute command to determine the point where connectivity fails. For details, see the FortiWeb CLI Reference:
HTTPs://docs.fortinet.com/product/fortiweb/
See also
- Configuring log destinations
- Viewing log messages
- Enabling log types, packet payload retention, & resource shortage alerts
- Configuring triggers
- Obscuring sensitive data in the logs
Configuring FTP/TFTP policies
Before you send reports that contain log or other information to an FTP or TFTP server, you create FTP/TFTP connection settings and add them to a report configuration.
To configure FTP/TFTP policies
Before you can create reports that contain logging information, you enable logging for the log type that you want to capture in a report. For details, see Enabling log types, packet payload retention, & resource shortage alerts.
Go to Log&Report > Log Policy > FTP/TFTP Policy.
To access this part of the web UI, your administrator’s account access profile must have Read and Write permission to items in the Log & Report category. For details, see Permissions.
Click Create New.
Configure these settings:
| FTP/TFTP Policy Name |
Enter a unique name that other parts of the configuration can reference. The maximum length is 63 characters. |
| Policy Type | Select FTP or TFTP. |
| Server | Enter the IP address of the FTP or TFTP server. |
| Authentication | Specifies whether the server requires a user name and password for authentication, rather than allowing anonymous connections. Available only if Policy Type is FTP. |
| Username | Enter the user name that FortiWeb uses to authenticate with the server. Available only if Authentication is selected. |
| Password | Enter the password for the specified username. Available only if Authentication is selected. |
| File Folder | Specifies the location on the server where FortiWeb stores reports. Available only if Policy Type is FTP. |
Click OK.
To verify logging connectivity, from the FortiWeb appliance, configure a report that uses this FTP/TFTP policy, and then run it (or wait for it to run at its scheduled time). Then, on the FTP or TFTP server, confirm that FortiWeb transmitted the report to the specified folder.
For details about configuring FortiWeb to send a report to an FTP or TFTP server, see Selecting the report’s file type & delivery options.
See also
- Configuring log destinations
- Viewing log messages
- Enabling log types, packet payload retention, & resource shortage alerts
- Configuring triggers
- Obscuring sensitive data in the logs
Configuring triggers
Triggers are sets of notification servers (Syslog, FortiAnalyzer, and alert email) that you can select in protection rules. The FortiWeb appliance will contact those servers when traffic violates the policy and therefore triggers logging and/or alert email.
|
|
You can also receive security event notification via SNMP. For details, see SNMP traps & queries. |
For example, if you create a trigger that contains email and Syslog settings, that trigger can be selected as the trigger action for specific violations of a protection profile’s sub-rules. Alert email and Syslog records will be created according to the trigger when a violation of that individual rule occurs.
To configure triggers
Before you create a trigger, first create any settings it will reference, such as email, Syslog and/or FortiAnalyzer settings. For details, see Configuring email settings, Configuring Syslog settings, and Configuring FortiAnalyzer policies.
Go to Log&Report > Log Policy > Trigger Policy.
To access this part of the web UI, your administrator’s account access profile must have Read and Write permission to items in the Log & Report category. For details, see Permissions.
Click Create New.
In Name, type a unique name that can be referenced by other parts of the configuration. The maximum length is 63 characters.
Pick an existing policy from one or more of the four Email, Syslog, FortiAnalyzer, or SIEM policies from the drop-down lists. FortiWeb will use these notification devices for all protection rule violations that use this trigger.
Click OK.
To apply the trigger, select it in the Trigger Action setting in a web protection feature, such as a hidden field rule, or an HTTP constraint on illegal host names.
Viewing log messages
You can use the web UI to view and download locally stored log messages. You cannot use the web UI to view log messages that are stored remotely on Syslog or FortiAnalyzer devices, an ArcSight SIEM Server, or Azure Security Center.
Depending on the type of log, some log messages cannot be viewed from the web UI.
Log messages are in human-readable format, where each column’s name, such as Source (src in a raw (unformatted) view), indicates its contents.
To assist you in forensics and troubleshooting false positives, if the request matched an attack signature, the part of the packet that matched is highlighted.
An attack’s origin is not always the same as the IP that appears in your logs. Network address translation (NAT) at various points between a web browser and your web servers can mask the original IP address of the attacker. Depending on your configuration of Use X-Header to Identify Original Client’s IP, attack logs’ Source column may contain the IP address of the client according to X-Forwarded-For: or a similar header in the HTTP layer, not the SRC field in the IP header. In that case, the corresponding traffic log’s Source column will not match, since it reflects the IP layer.
Typically in this scenario, the connection has been relayed by a load balancer or proxy, and therefore the IP would be that of the load balancer, which is not the real origin of the attack. Similarly, if Shared IP is enabled, FortiWeb will attempt to differentiate innocent clients that share the same public address with an attacker according to the IP layer SRC field due to NAT.
Not all attack detections will be logged. In some cases, only one entry will be logged when there are many attack instances. For details, see Log rate limits.
Similarly, server information disclosure detections will not be logged if you have configured Action to be Erase, no Alert. For details, see Blocking known attacks .
Viewing raw (unformatted) messages
When you view log messages using the web UI, the log message is displayed in columns, with graphics and other formatting. In some cases, it is useful to view the log message exactly as it appears in the log file, as a single line of text consisting of field-value pairs. Use one of the following methods to view a log message in its raw form:
- Right-click a column heading, select Detailed Information, and then click Apply. The log message is displayed with no formatting in the Detailed Information column.
- Download a complete log file or a file that contains all log messages for a specific time period. For details, see Downloading log messages.
Determining whether an attack that generated a message was blocked
Not all detected attacks may be blocked, redirected, or sanitized.
You can use the Action column to determine whether or not an attack attempt was permitted to reach a web server. (This column is displayed by default. Right-click a column heading to select the columns to display.) Additionally, if the FortiWeb appliance is operating in Offline Protection mode or Transparent Inspection mode, due to asynchronous inspection where the attack may have reached the server before it was detected by FortiWeb, you should also examine the server itself.
To view log messages
Go to one of the log types:
- Log&Report > Log Access > Attack
- Log&Report > Log Access > Event
- Log&Report > Log Access > Traffic
To access this part of the web UI, your administrator’s account access profile must have Read and Write permission to items in the Log & Report category. For details, see Permissions.
Columns and appearance varies slightly by the log type. For details on structure or interpretations of and troubleshooting suggestions for individual log messages, see the FortiWeb CLI Reference:
HTTPs://docs.fortinet.com/product/fortiweb/
Initially, the page displays the most recent 100,000 log messages for that log type.
|
|
In FortiWeb HA Active-Passive clusters, log messages are recorded on their originating appliance. If you notice a gap in the logs, a failover may have occurred. Also, in FortiWeb HA Active-Active clusters, HTTP requests are distributed to all the active appliances, so log messages are recorded on their originating appliance. FortiAnalyzer can recognize logs from a FortiWeb High Availability (Active-Active and Active-Passive) cluster and display aggregated logs from each device in the cluster under one name. You no longer have to connect to individual cluster members to view logs from the cluster. |
Here, attack log is taken as an example.
Log&Report > Log Access > Attack
| (Refresh button) | Click to update the page with any logs that have been recorded since you previously loaded the page. |
| Add Filter |
Click to create a filter based on log message fields. Only messages that are in the most recent 100,000 messages and match the criteria in the filter are displayed. When you search by date and time, all messages with the selected date are displayed. If you have too many filters and values for one log query, it might exceed the request URI limitation 8,190 and a message appears: Request-URI Too Long There isn't a specific number of how many pairs of filter and value are allowed. It depends on the filters you added and how many values you added to a filter. So, if you see the error message, try removing some filters or values. If you have too many filters and values to be saved, a message appears: The filter to be saved is too long Try removing some filters or filter values then saving the filter again. |
|
(Save button) |
Click to save and name the current filter for the convenience of future use. |
|
Saved filter drop-down list |
Select from the list to apply a previously saved filter. |
| (drag and drop column heading) | Change the order of columns. |
| (right-click column heading) | Right-click a column heading to access settings that add or hide columns that correspond to log fields or remove any filters you have applied. |
| Log Management | Click to view, download, or clear contents of a selected log file(s). |
| Generate Log Detail PDF | Click to generate a detailed report of the selected attack log message in PDF format. Available only for the attack log. |
Comments
Click any attack log, you can add/edit comments for this log from the bottom of the detailed page on the right. From the Comments column, you can see details such as the comments creator, creation time, editor and editing time, etc.
Only one comment is kept for each log. Comments are stored locally, and logs exported and sent do not include comments. You cannot delete the comments.
Flags
You can set any of the three flags "Action Required", "Action Taken", and "Dismissed" for an attack log by right clicking the log.
Only one flag can be kept for each log. Flags are stored locally, and logs exported and sent do not include flags. You cannot clear the flags.
Viewing a single log message as a table
When viewing attack log messages or traffic log messages, you can display the log message as a table in the frame beside the log view.
To view message details
Go to either Log&Report > Log Access > Attack or Log&Report > Log Access > Traffic.
To access this part of the web UI, your administrator’s account access profile must have Read and Write permission to items in the Log & Report category. For details, see Permissions.
Click any log message.
The details appear beside the main log table. The arrow icon in the top-left of the details pane allows you to expand or collapse the pane.
Viewing packet payloads
If you enabled retention of packet payloads from FortiWeb’s HTTP parser for attack and traffic logs, you can view a part of the payload as dissected by the HTTP parser, in table form, via the web UI. For details, see Enabling log types, packet payload retention, & resource shortage alerts.
Packet payload tables display the decoded packet payload associated with the log message that it caused. This supplements the log message by providing the actual data that triggered the regular expression, which may help you to fine-tune your regular expressions to prevent false positives, or aid in forensic analysis.
To view a packet payload
Go to either Log&Report > Log Access > Attack or Log&Report > Log Access > Traffic.
To access this part of the web UI, your administrator’s account access profile must have Read and Write permission to items in the Log & Report category. For details, see Permissions.
In the row corresponding to the log message whose packet payload you want to view, click the log message.
There may not be a Packet Log icon for every log message, such as for normal HTTP responses and attack types where you have not enabled packet payload retention.
In a frame to the right the log messages, the log message appears in table format, as well as the decoded HTTP headers and packet payload. Parameters and file uploads are in either the URL or (for HTTP POST requests) Data fields. Cookies can be either in the Cookie or Data fields.
See also
- Enabling log types, packet payload retention, & resource shortage alerts
- Coalescing similar attack log messages
- Downloading log messages
Downloading log messages
You can download logs that are stored locally (that is, on the FortiWeb appliance’s hard drive) to your management computer.
In the web UI, there are two different methods:
- Download one or more whole log files. (If the log has not yet been rotated, there may be only one file.)
- Download only the log messages that occurred within a specific time period, regardless of which file contains them. Maximum amount of logs allowed to be downloaded in the specific time period is limited to 500,000 logs.
To download log messages matching a time period
Go to Log&Report > Log Access > Download.
To access this part of the web UI, your administrator’s account access profile must have Read and Write permission to items in the Log & Report category. For details, see Permissions.
Configure these settings:
| Log Type | Select one of the following log types to download |
| System Time | Displays the date and time according to FortiWeb’s clock at the time that this page was loaded, or when you last clicked the Refresh button. |
| Start Time | Choose the starting point for the log download by selecting the year, month and day as well as the hour, minute and second that defines the first of the log messages to download. |
| End Time | Choose the end point for the log download by selecting the year, month and day as well as the hour, minute and second that defines the last of the log messages to download. |
Click Download.
If there are no log messages of that log type in that time period, a message appears:
no logs selected
Click Return and revise the time period or log type selection.
If there are more than 500,000 logs in that time period, a message appears:
Unable to download due to size. Please respecify a shorter time period
If a file download dialog appears, choose the directory where you want to save the file.
Your browser downloads the log file in a .tgz compressed archive. Time required varies by the size of the log and the speed of the network connection.
To download a whole log file
Go to one of the log types, such as Log&Report > Log Access > Event.
To access this part of the web UI, your administrator’s account access profile must have Read and Write permission to items in the Log & Report category. For details, see Permissions.
Click Log Management.
A page appears, listing each of the log files for that type that are stored on a local hard drive.
Mark the check box next to the file that you want to download.
Click Download.
Select either Normal format (raw, plain text logs) or CSV format (comma-separated value).
Raw, unencrypted logs can be viewed with a plain text editor. CSV-formatted, unencrypted logs can be viewed with a spreadsheet application, such as Microsoft Excel or OpenOffice Calc.
If you would like to password-encrypt the log files using 128-bit AES before downloading them, enable Encryption and type a password in Password.
Encrypted logs can be decrypted and viewed by archive viewers that support this encryption, such as 7zip 9.20 or WinRAR 5.0.
Click OK.
If a file download dialog appears, choose the directory where you want to save the file.
Your browser downloads the log file as a .log or .csv file, depending on which format you selected. Time required varies by the size of the log and the speed of the network connection.
Deleting log files
If you have downloaded log files to an external backup, or if you no longer require them, you can delete one or more locally stored log files to free disk space.
To delete a log file
Go to one of the log types, such as Log&Report > Log Access > Event.
To access this part of the web UI, your administrator’s account access profile must have Read and Write permission to items in the Log & Report category. For details, see Permissions.
Click Log Management.
A page appears, listing each of the log files for that type that are stored on the local hard drive.
Either:
To delete all log files, mark the check box in the column heading. All rows’ check boxes will become marked.
To delete some log files, mark the check box next to each file that you want to delete.
Click Clear Log.
Coalescing similar attack log messages
FortiWeb can generate many types of attack log messages, including Custom Access Violation, Header Length Exceeded, IP Reputation Violation, and SQL Injection.
To make attack log messages easier to review, when the total number of attack types exceeds 32 in a single day, FortiWeb aggregates two types of messages—signature attacks and HTTP protocol constraints violations—in the Aggregated Attacks page.
For details about the signatures and constraints that generate the aggregated messages, see Blocking known attacks and HTTP/HTTPS protocol constraints.
|
|
Some attacks only generate one log message per interval while an attack is underway. They are effectively already coalesced. For details, see Log rate limits and Viewing log messages. |
To coalesce similar attack log messages
Go to Log&Report > Log Access > Attack and select the Aggregated Attacks tab.
To access this part of the web UI, your administrator’s account access profile must have Read and Write permission to items in the Log & Report category. For details, see Permissions.
Each row of aggregated log messages is initially grouped into similar attack types, not primarily by day or time.
If you want to aggregate attacks by time instead, click Aggregate log by Date.
Each page in the display contains up to 7 dates of aggregated logs. To view dates before that time, click the arrow to go to the next page.
To expand a row in order to view individual items comprising it, click the plus sign ( + ) in the # column.
To view a list of all log messages comprising that item, click the item’s row. Details appear in a pane to the right.