


Getting started
This section describes FortiPolicy requirements for VMware and how to get started installing FortiPolicy for continuous monitoring and microservice protection.
This section covers the following topics:
Before you begin
Before installing FortiPolicy:
-
Read the FortiPolicy Release Notes for the current release.
-
Review the requirements for your VMware environment before installing FortiPolicy.
Refer to Installation and setup requirements.
|
|
A change of IP address for the FortiPolicy console is not supported in this release. |
FortiPolicy deployment scenario
The FortiPolicy virtual chassis, all associated data planes, and all integrated microservices and security controls can be deployed in the Fortinet Security Fabric for an east/west deployment.

Installation and setup requirements
This section identifies the system requirements for installing FortiPolicy.
General requirements
Confirm that your ESX environment meets FortiPolicy prerequisites and requirements before beginning an installation procedure. The following list displays all needed access privileges and requirements for deploying FortiPolicy into a VMware ESXi infrastructure. You can use the following as a checklist.
-
Internet access. Outbound communication is required to allow the management plane to access the FortiPolicy cloud for software upgrades, licensing, and other features.
-
Latest version of Google Chrome
-
Access to Fortinet Support
-
VMware vSphere 6.5 and higher for deploying FortiPolicy
-
vCenter 6.x and above
-
vCenter Server 6.0 or 6.5
-
One IP address or fully qualified domain name (FQDN) for your vCenter server
-
One ESXi host with 6.x and above
-
Network Time Protocol (NTP) enabled on ESXi hosts
-
vCenter credentials and user access are needed to deploy the FortiPolicy VM.
-
-
Intel CPU, Sandy Bridge or later
-
86-100 GB memory
-
550-GB hard disk—thin provisioning
-
One network interface with a static IP address
-
One static IP address, a gateway, and a netmask to set up FortiPolicy
-
A management network with DHCP. The management network must be reachable with the management VLAN.
-
Laptop for client access (physical Ethernet preferred)
-
One or more managed FortiSwitch units
-
Do NOT configure flow tracking on the connected FortiSwitch units.
-
-
Root FortiGate device and any child FortiGate devices
-
For your critical business applications, you might want to monitor the security events for each application protected by FortiPolicy. To do so, enable the layer-7 security profiles in security policies for the applications:
-
Enable the deep-inspection security profile in FortiOS to show exploits in FortiPolicy.
-
Enable the application control security profile in FortiOS to show application ID events in FortiPolicy.
-
Enable the web filter security profile in FortiOS to show risky domains in FortiPolicy.
-
Enable the file filter security profile in FortiOS to show malware in FortiPolicy.
To configure security profiles, see Security Profiles. To configure security policies, see NGFW policy.
After security profiles are configured in FortiOS and selected in security policies for the applications, go to Workspace > Applications in FortiPolicy (after it is installed and configured) and click on the Risk value to open the Application Summary page, where you can see all security events for the application in FortiPolicy.
-
-
The FortiGate management port must have Fabric Integration selected, and the FortiGate device must be reachable from FortiPolicy.
-
The FortiGate device cannot have a custom virtual domain (VDOM). Custom VDOMs prevent fabric integration.
-
A NAC LAN segment must be configured on a physical FortiGate device. You can use the default
nac_segment.fortilinkinterface or create a new one. -
The FortiGate device must have a FortiLink VLAN interface that can be used as a NAC LAN segment before configuring proxy Address Resolution Protocol (ARP). All workloads that you want FortiPolicy to inspect and generate policies for must be connected to the FortiLink VLAN interface on the FortiSwitch ports. The workloads must have an IP address from the FortiLink VLAN interfaceʼs DHCP range.
To configure the FortiLink VLAN interface in FortiOS:
-
Go to WiFi & Switch Controller > FortiSwitch VLANs.
-
Select the FortiLink VLAN interface. The default FortiLink VLAN interface is
nac_segment.fortilink. -
Click Edit.
-
Make certain that the addressing mode is set to Manual.
-
Enable DHCP Server and click Enabled for the DHCP status.
-
Enter the address range and netmask for the DHCP server.

-
Click OK.
-
Go to WiFi & Switch Controller > FortiSwitch Ports.
-
Hover over the Native VLAN column for one of the ports that should be used for the FortiLink VLAN; click on the pencil to edit the native VLAN.
-
Select the FortiLink VLAN and then click Apply.
-
Change the native VLAN to the FortiLink VLAN for each port connected to devices that need protection by FortiPolicy automatic policies.

-
-
Use the CLI to configure the proxy ARP on the primary NAC segment interface on the FortiGate device. For example:
config system proxy-arp
edit 1
set interface “nac_segment”
set ip 10.255.13.2
set end-ip 10.255.13.5
next
end
-
Connectivity requirements
The following table lists the ESX resource requirements.
|
FortiPolicy component |
vCPU requirements |
VM requirements |
|---|---|---|
|
FortiPolicy management plane |
10 vCPUs |
1 VM |
Ports used by FortiPolicy
The following table lists the ports that FortiPolicy uses to communicate with other services. Depending on your deployment you may need to open these ports up in your firewall.
|
Service or program |
Protocol |
Incoming ports |
Outgoing ports |
Details |
|---|---|---|---|---|
|
SSHD |
TCP |
22 |
|
In order to SSH to the FortiPolicy CLI, TCP:22 must be allowed. |
|
DNS |
TCP, UDP |
|
53 |
FortiPolicy need to access to the DNS servers provided during setup. |
|
NTP |
UDP |
|
123 |
By default, FortiPolicy uses public Ubuntu NTP Pools. It is strongly suggested to provide your own NTP server during install. |
|
Web access |
TCP |
80, 443 |
|
Port 80(HTTP) is a redirect to port 443(HTTPS). |
|
Security Fabric conection |
TCP |
|
442, 8013 |
FortiPolicy needs access to the Root FortiGate. |
|
Netflow connection |
UDP |
4739 |
N/A |
Netflows/IPFix from Fortigate and supported network switches. |
|
Telemetry uploads |
TCP |
N/A |
fortipolicy.fortinet.com:443 |
|
Installing FortiPolicy
-
Go to the host where FortiPolicy is to be installed.

-
Right-click on the host and select Deploy OVF Template.

-
Locate and select the FortiPolicy OVA file and then click NEXT.

-
Name the FortiPolicy deployment and version in your specified data center location and then click NEXT.

-
Select a compute resource for the FortiPolicy files and then click NEXT.

-
Review the details and then click Next.

-
Select the data store and virtual disk format and then click Next.

-
Select the destination network and then click NEXT.

-
Fill out the following fields and then click NEXT.
-
Hostname—Enter the hostname.
-
IPv4 Address—Fortinet recommends a static IP address. Select from the set of IP addresses reserved for FortiPolicy.
-
Netmask—Enter the netmask.
-
Default Router—Enter the default router IP address.
-
DNS Servers—Enter the IP address of each DNS server.
-
DNS Domain—If you are using DHCP, leave this field blank.
-
NTP Servers—Enter the IP address of each NTP server. In the example, this field is blank because all hosts in this sample setup already have NTP set on them.
-
SSH Public Key—This field is not applicable to VMware deployments of FortiPolicy.
No other configurations are required on this page.

-
-
Review the configuration and then click FINISH.

-
When the OVF template is deployed, the Recent Tasks pane displays Completed, and the new VM is listed in the Hosts and Clusters pane.

-
Right-click on the name of the new VM and select Power > Power On.

-
Check that the task has completed.

-
In the Hosts and Clusters tab, select your new VM and click Launch Web Console.

-
Check that all processes have a status of UP.

Initial login
To launch the FortiPolicy console:
-
Enter the IP address in the browser address bar.
The IP address was defined in Step 9.

Fortinet recommends using Google Chrome.
-
In the User Name field, enter
admin. -
In the Password field, enter
fortinet. -
Click LOGIN.
-
Enter a new password and then enter the password a second time to confirm it.

-
Click CHANGE PASSWORD.
-
In the User Name field, enter
admin. -
In the Password field, enter your new password.
-
Click LOGIN.

|
|
After logging in, go to Configuration > Users and click the plus sign in the upper right corner to create a new user with the GlobalAdministrator role. After creating the new user, you can delete the If you forget the new credentials, you will have to uninstall FortiPolicy and then re-install it. |
Navigating the FortiPolicy menus
To navigate the FortiPolicy menu, click the icons in the left pane or the tabs at the top of the window.
Click the menu button in the top right corner to log out of the current FortiPolicy console session.

The FortiPolicy menu in the left pane contains the following options:

-
Workspace—Set up applications and resource groups, as well as review events and logs.
-
Policy—Lists available access control list (ACL) policies and allows you to add ACL rules and policies, clone policies, delete policies, and export policies.
-
Insights—Allows you to quickly scan workloads, detections, and operations and offers maps of assets and attacks.
-
Configuration—Allows you to configure the Security Fabric, add data planes, change your system setup, import certificates, add users, set up notifications, update the software, update your license, and generate reports.
Configuring FortiPolicy
To configure FortiPolicy, complete the following procedures:
Importing the FortiPolicy license file
To import the FortiPolicy license file:
-
Go to FortiCloud and create a new account or log in with an existing account.

-
Go to Asset Management and click Register Now to start the registration process.

-
In the Registration Code field, enter the FortiPolicy UUID.
 The FortiPolicy UUID is located in the Configuration > License page in FortiPolicy.
-
After you complete the registration process, go to Products > Product List in FortiCloud, click on the FortiPolicy serial number, and click License File Download to download your license file.
-
In FortiPolicy, go to Configuration > License and click BROWSE LICENSE FILE.

-
Select your FortiPolicy license file.

-
Click IMPORT LICENSE.

-
Click IMPORT.
- Check that the status of the license is Active.
The Registered Support Contracts area is updated with all contracts that have been assigned to your license.

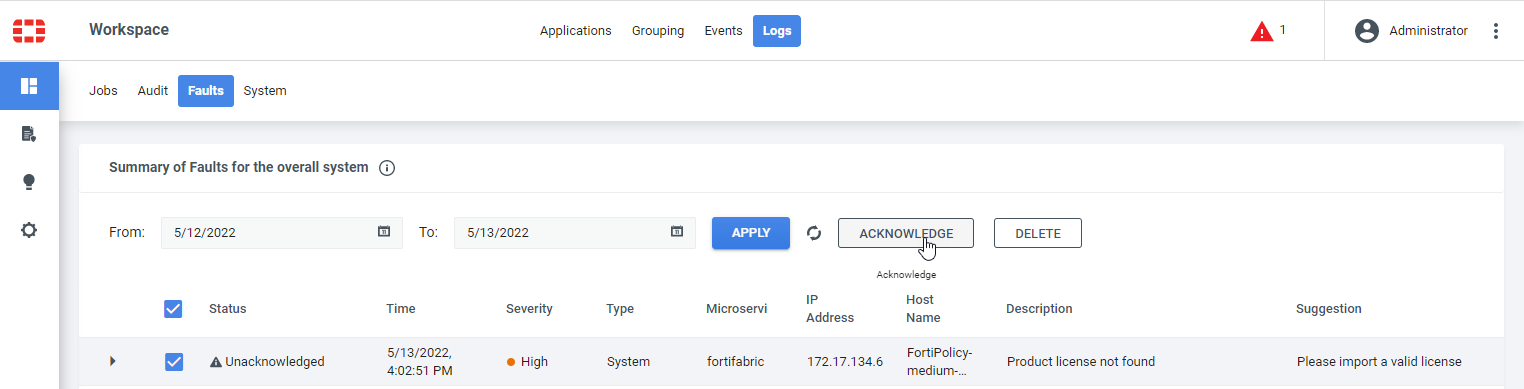
If you see a red triangle on the right side of the header bar, click on it to see the system log message under Workspace > Logs > Faults. You can acknowledge the fault and then ignore it.
Creating a fabric connector
A fabric connector connects FortiPolicy to the root FortiGate device and everything connected to the root FortiGate device.
To create a fabric connector:
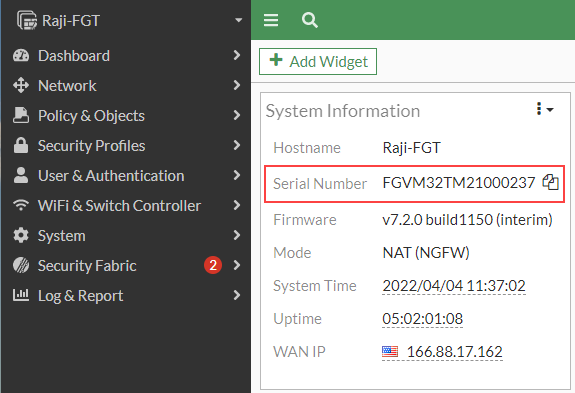
- In the root FortiGate device, go to Dashboard > Status and copy the FortiGate serial number from the System Information widget.
-
In FortiPolicy, configure the Security Fabric.
-
Go to Configuration > Security Fabric.
- In the Root FortiGate Serial Number field, enter the serial number for the root FortiGate device
- In the IP Address field, enter the IP address of the root FortiGate device.
- By default, the Port field is set to
8013. - In the Assign FortiPolicy ACL Policy dropdown list, select Default ACL Policy.

- Click SAVE.
-
-
Configure the settings in each FortiGate device (root FortiGate and child FortiGate devices) in the Security Fabric.
-
Go to Security Fabric > Fabric Connectors, right-click Security Fabric Setup, and select Edit.

-
Enable Allow downstream device REST API Access.
-
From the Administrator profile dropdown list, select super_admin.

-
Click OK.
-
-
In the root FortiGate device, configure the management port.
-
Go to Network > Interfaces, select the Mgmt port, and click Edit.

-
Select the Security Fabric Connection checkbox and then click OK.

-
-
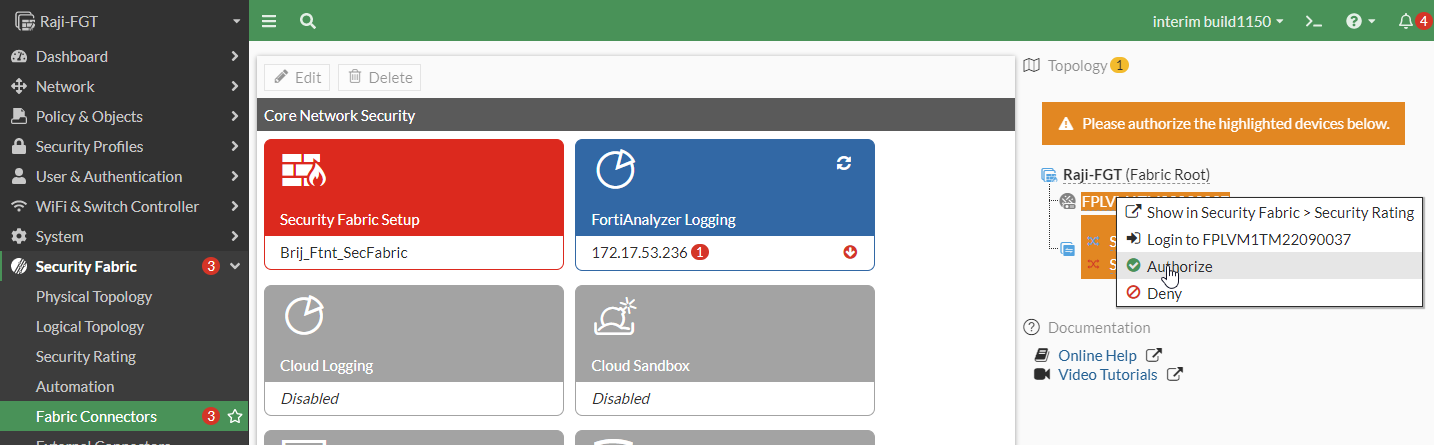
Go to Security Fabric > Fabric Connectors, click the highlighted FortiPolicy serial number, and select Authorize.
- In the Verify Pending Device Certificate pane, click Accept.

-
In the FortiOS CLI, click the CLI Console button at the top of the window and then enter the following commands on each FortiGate device that is part of the Security Fabric (root FortiGate and child FortiGate devices):
config system csf
config fabric-connector
edit <FortiPolicy_serial_number>
set configuration-write-access enable
set accprofile super_admin
next
end
end
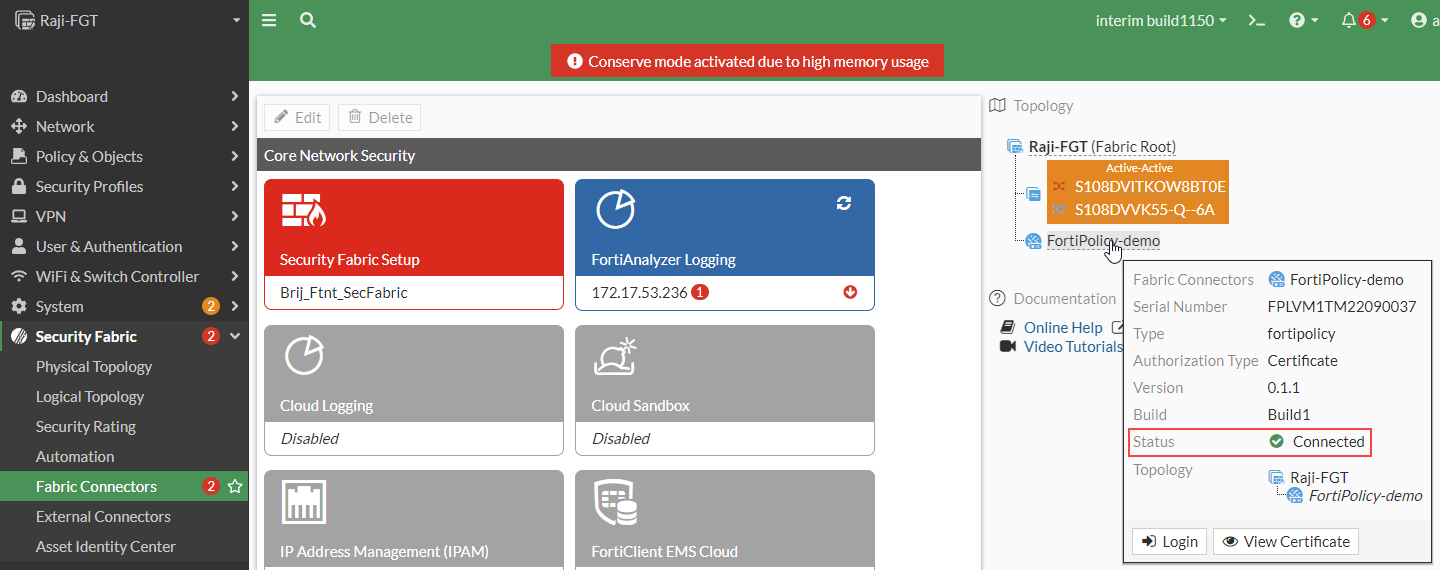
To find the FortiPolicy serial number, go to Security Fabric > Fabric Connectors and hover above the FortiPolicy device that you just authorized, as shown in the following figure.

-
FortiPolicy now displays the status of the connector as Connected (Authorized).

- In FortiOS, the status of the fabric connector is Connected.
Configuring data planes
You need to create a FortiPolicy data plane for each FortiGate device connected to application workloads that need to be secured. The workloads might be connected directly to the FortiGate device or might be connected to FortiSwitch units that are directly connected to the FortiGate device.
For example, in the following topology, you would create a data plane for FGT-3 to secure Application-1, Application-2, and Application-3. You would create a second data plane for FGT-5 to secure Application-4, Application-5, and Application-6.

The data planes determine which workloads Policy Generation will analyze. When you select the FortiGate device for a data plane, Policy Generation will examine the traffic logs from that FortiGate device and the NetFlows from the FortiSwitch units that are directly wired to the FortiGate device. Policy Generation will analyze the traffic for the workloads connected directly to the FortiGate device and FortiSwitch units.
To create a data plane:
-
Go to Configuration > Data Planes.
-
Click the plus sign on the upper right corner of the Data Planes page.

-
In the Name field, enter a unique name for the new data plane.
This unique name will be added as a prefix to all fabric objects that FortiPolicy creates for this data plane.
-
From the Fabric dropdown list, select the fabric connector that you created.
-
From the Device dropdown list, select the root FortiGate device.
-
From the VDOM dropdown list, select the VDOM.
-
From the LAN Segment Primary Interface dropdown list, select the LAN segment that you want to use as the primary interface. The default LAN segment is
nac_segment. -
In the Segment VLAN Range field, enter a range of VLAN IDs. If you are going to microsegment the workloads, each workload requires a separate VLAN.

-
Click SAVE.
-
In the Add New Data Plane? dialog, click OK.

The new data plane is listed in the Data Planes page.

- Repeat steps 2-10 for each FortiGate device connected to application workloads that need to be secured.
Using a third-party switch
Workloads can be microsegmented on third-party switches.
Use the 4793 port and UDP protocol to configure NetFlow.
|
|
To configure the third-party switch, consult the switch's configuration guide for the necessary commands. |
Setting up Policy Generation
Automated Policy Generation provides the automated discovery of connections, tiers, applications, and network services.
To set up Policy Generation:
-
In FortiPolicy, go to Workspace > Applications.
-
In the Action Steps pane, click SETUP POLICY GENERATION.

-
For the Security Policy Set dropdown list, keep the default setting of Discover.
-
From the Access Control Policy dropdown list, select Default ACL Policy.
-
Select the checkbox for the Fortinet Security Fabric and enter any public IP addresses that you want to be analyzed as part of the network you are securing.

-
Click Next.
-
If you do not want all workloads and subnets defined in the Scope and Public IPs tabs to be examined, create filters for which workloads and subnets to include and exclude.

-
Click Next.
-
Review the list of standard network services that interconnect your workloads. Edit or add any services in your network that use nonstandard ports and protocols. Delete any services not used in your network.

Extremely important: An accurate list of network services allows FortiPolicy to identify all common network services and to distinguish between business application tiers and service tiers.

-
Policy Generation will automatically examine the names of all workloads. If your workload naming convention follows the supported delimiter-based or positional format and contains any of the following data, Policy Generation can automatically label your applications, their tiers, and the sources and destinations in the policy rules. If your workload naming convention does not fit the supported formats or you want to manually name the proposed applications and tiers, select None encoded.

-
Click Next.
-
If you selected Tags on the Names tab, FortiPolicy derives tags from the workload naming convention used for existing applications, deployment environments, and tier functions. If you want to add more tags for applications, deployment environments, and tier functions, enter the value and full name for each tag.

-
Click Next to go through the three tag groups and then click Done.
-
Click DONE.
During Policy Generation, FortiPolicy gathers data on your network, learns its interconnections, and begins to propose security policies. The default connection discovery time is 2 hours. After additional analysis time, the proposed applications are listed in the Applications page.

Refer to Automated policy generation to complete the action steps.
Troubleshooting discovery
During discovery, you can view the real-time progression of infrastructure discovery events from the FortiPolicy Workspace > Logs > Jobs page and then troubleshoot any issues.

Click the “i” information icon at the beginning of a Job row in the Jobs table to display any error details.
FortiPolicy discovers the data necessary for Policy Generation by connecting FortiPolicy data planes to the FortiGate and FortiSwitch devices in the Security Fabric. FortiPolicy discovers the Security Fabric endpoints and subscribes to the endpoints to receive traffic logs from the FortiGate devices and flow exports from the FortiSwitch units. FortiGate and FortiSwitch devices have a limit on the number of data collectors that can subscribe to receive this data (In FortiOS 7.0.x, the limit is four syslog data collectors for traffic logs and one data collector for flow export.). If FortiPolicy tries to subscribe to a device that is already at its subscription limit, data discovery will fail.
If connection discovery fails, FortiPolicy displays a red fault icon in the header bar, and the discovery status is shown as FAILED under the Ended tab on the Workspace > Logs > Jobs page. If connection discovery fails, FortiPolicy cannot get the necessary data to generate valid proposals. A common cause of discovery failure is that a device has reached its limit of subscribed clients.
To solve this problem, the FortiPolicy administrator must go to any oversubscribed FortiGate or FortiSwitch devices and remove an existing subscribed client. Then, the administrator can return to FortiPolicy, go to Configuration > Data Planes, click the vertical ellipsis menu at the left side of the page, and select Sync for each data plane to register it with its Fortinet devices. After synchronizing the data planes, the Ended tab on the Jobs page should show a status of PASSED for discovery.
You can also check the following settings if you are having trouble with connection discovery:
-
Go to Configuration > Security Fabric and verify that the icon under Security Fabric Connection Status is green, which indicates that the connection is active.

-
Before you created the data planes, you needed to enable NetFlow on each FortiGate device where a data plane is created with the following commands:
config system csf
config fabric-connector
edit <FortiPolicy_serial_number>
set configuration-write-access enable
set accprofile super_admin
next
end
end
-
Go to Workspace > Logs > Jobs and check for errors in discovering the Security Fabric.
-
If there are compatibility errors, make certain that you are using FortiOS 7.0.6.
-
In the root FortiGate device, go to Network > Interfaces, select the WAN port, and click Edit. Make certain that the Security Fabric Connection checkbox is selected.
-
-
Go to Workspace > Logs > Jobs and check for any errors from when you created the data planes.
-
For each FortiGate device in the Security Fabric, go to Security Fabric > Fabric Connectors, right-click Security Fabric Setup, and select Edit. Check that Allow downstream device REST API access is enabled and that the management port is set to 8013.

-
Check that logs are enabled with the
set logtrafficcommand underconfig firewall policyin the FortiOS CLI.
-
-
Check that the proxy ARP was configured on the primary NAC segment interface on the FortiGate devices. For example:
config system proxy-arp
edit 1
set interface “nac_segment”
set ip 10.255.13.2
set end-ip 10.255.13.5
next
end
FortiPolicy CLI
The CLI provides a set of commands used to configure and display status for the FortiPolicy software system and its microservices components.
-
Use SSH to log in to the FortiPolicy CLI with your user name and password.
-
To display the full set of available CLI commands, enter
?.FortiPolicy-medium-demo> delete Delete system configuration enable Enable new view etc exit Logout of the current CLI session help Display an overview of the CLI syntax history Display the current session's command line history ping Send messages to network hosts reboot Reboot the system. resize Resize console to terminal size restart Restart services set Set system configuration shell Drop to restricted shell. show Show system configuration ssh Connect to remote CLI sessions test Test commands etc traceroute Print the route packets trace to network host
-
To enable a FortiPolicy support session:
FortiPolicy-medium-demo> set support enabled
Version              : 3
Shared Secret        : 002IRSZ4SNU2FBMZ8VG3FRWDF5VP9
One-Time Password(s) : 00246753839 00214000114 00294672571 00248811433 00267257933

FortiPolicy-medium-demo> show support keys
Version              : 3
Shared Secret        : 002IRSZ4SNU2FBMZ8VG3FRWDF5VP9
One-Time Password(s) : 00246753839 00214000114 00294672571 00248811433 00267257933
Using the FortiPolicy REST API
You can use the FortiPolicy Representational State Transfer (REST) API endpoints to interact with the FortiPolicy microservices.
The REST API enables FortiPolicy users to securely connect to FortiPolicy software deployed in a virtualized environment, from which remote procedure calls (RPC) using cURL and JSON can be executed.
The FortiPolicy REST API uses HTTP authentication to manage authentication between a client and FortiPolicy software.
The FortiPolicy REST API supports GET, DELETE, PUT and POST requests:
-
Use GET requests to submit RPC commands.
-
Use POST requests to create new resources and PUT requests to update them.
-
Retrieve infrastructure and security policy information in JSON format.
-
Retrieve operational data in JSON format.
FortiPolicy HTTP-based APIs can be used to obtain threat, system management data, software-defined security policy configurations and microservices events.
As part of the FortiPolicy REST API, an AnalyticsStore microservice component is included for querying all ElasticSearch events/error logs per customer environment, generated, logged and indexed by FortiPolicy microservices. The FortiPolicy AnalyticsStore holds all the data that drives the FortiPolicy Analytics and Correlation Dashboards. It is one of the microservices deployed on a single instance FortiPolicy VM. When the FortiPolicy management system scales out to accommodate an infrastructure’s changes and resource demands, three different Analytics Store VMs are deployed to form a “cluster.” This means each VM of the AnalyticsStore microservice is aware of the presence of the other VMs in the cluster and can exchange information and track the health of the other instances of the cluster.
After creating and assigning tags, the tag-based groups are identified in the FortiPolicy console with a tag icon and available for ACL and security policy assignments from the Security Orchestration grouping pages. Up to 50 tags are supported by the FortiPolicy management console. In an upcoming release of the product, tags can be applied across infrastructure types in cloud environments.
Python-based tagging tool
An (optional) tagging tool (Python script) is also available to expedite security group tag creation and assignment. The tagging tool locates and includes the workload ID in the creation command and assignment commands for you, and can handle multiple tags with an AND condition, so it can be a faster option than issuing API calls for customers preferring Python scripting. Request the script from technical support.
FortiPolicy REST API endpoints
FortiPolicy REST API endpoints are organized by software components. All REST API endpoints are listed at:
https://<FortiPolicy_IP_address>/swagger-ui/index.html
The FortiPolicy REST APIs main page lists the REST API categories:

Click on a category to expand it, click on an endpoint to expand it, click Try it out, enter any required parameters, and then click Execute.
The FortiPolicy API uses HTTP authentication to manage authentication between a client and the FortiPolicy software and microservices. An authorized user account must exist before accessing the FortiPolicy API. The client must include the user account name and password to generate an API KEY for accessing the online FortiPolicy API facility.
Generating an API key
An API key required for access to the FortiPolicy REST API set.
To generate an API key, execute the following cURL command with the login password and user name, as well as the IP address of the FortiPolicy management console. Click Authorize, copy the generated API key (token) into the Value field, and then click Authorize.
curl -I -H 'X-Password: <Loginpwd>' -H 'X-Username: <loginUsername>' -XPOST https://<FortiPolicy_IP_address>/shieldxapi
For example:
curl -I -H "x-Password: admin" -H "X-Username: admin" -XPOST https://12.6.3.5/shieldxapi

|
|
In some cases, the single quote in the cURL command may need to be changed to a double quote, depending on a specific operating system’s handling of cURL. |
API categories per software component
|
Software Component |
API Category |
|---|---|
|
applications-data-controller |
Applications management API endpoints |
|
chassis-controller |
Data plane management API endpoints |
|
cloud-controller |
Cloud infrastructure API endpoints |
|
es-index-controller |
Higher level big data API endpoints |
|
es-rest-api |
Elastic Search API endpoints |
|
graph-miner-controller |
Application discovery configuration API endpoints |
|
grouping-controller |
Grouping API endpoints |
|
jobs-controller |
Jobs API endpoints |
|
login-controller |
Login management API endpoints |
|
manage-controller |
System management API endpoints |
| policy-controller | Policy management API endpoints |
| query-controller | Query builder API endpoints |
| reports-controller | Reports management API endpoints |
| risk-view-controller | Risk management API endpoints |
| security-fabric-controller | Security Fabric configuration and management API endpoints |
| tls-controller | TLS management API endpoints |
FortiPolicy API request properties
All FortiPolicy HTTP API requests have the following base URL:
HTTP_scheme://<FortiPolicy_IP_address>/shieldxapi/v2/<API>/params
For example:
"https://10.1.1.1/shieldxapi/v2/deployspec"
Each JSON response always contains a “status” field. An “error_msg” includes a string describing the error.
Authentication is with the session API key. API keys are generated with the following cURL command:
curl -I -H 'X-Password: <Login_pwd>' -H 'X-Username: <login_Username>'-XPOST https://<FortiPolicy_IP_address>/shieldxapi
|
|
In some cases, the single quote in the cURL command may need to be changed to a double quote, depending on a specific operating system’s handling of cURL. |