AI Insights
The AI insights dashboard present data in various panels that is displayed in a series of charts and graphs, that you can filter based on time duration. Navigate to Dashboard > AI Insights.
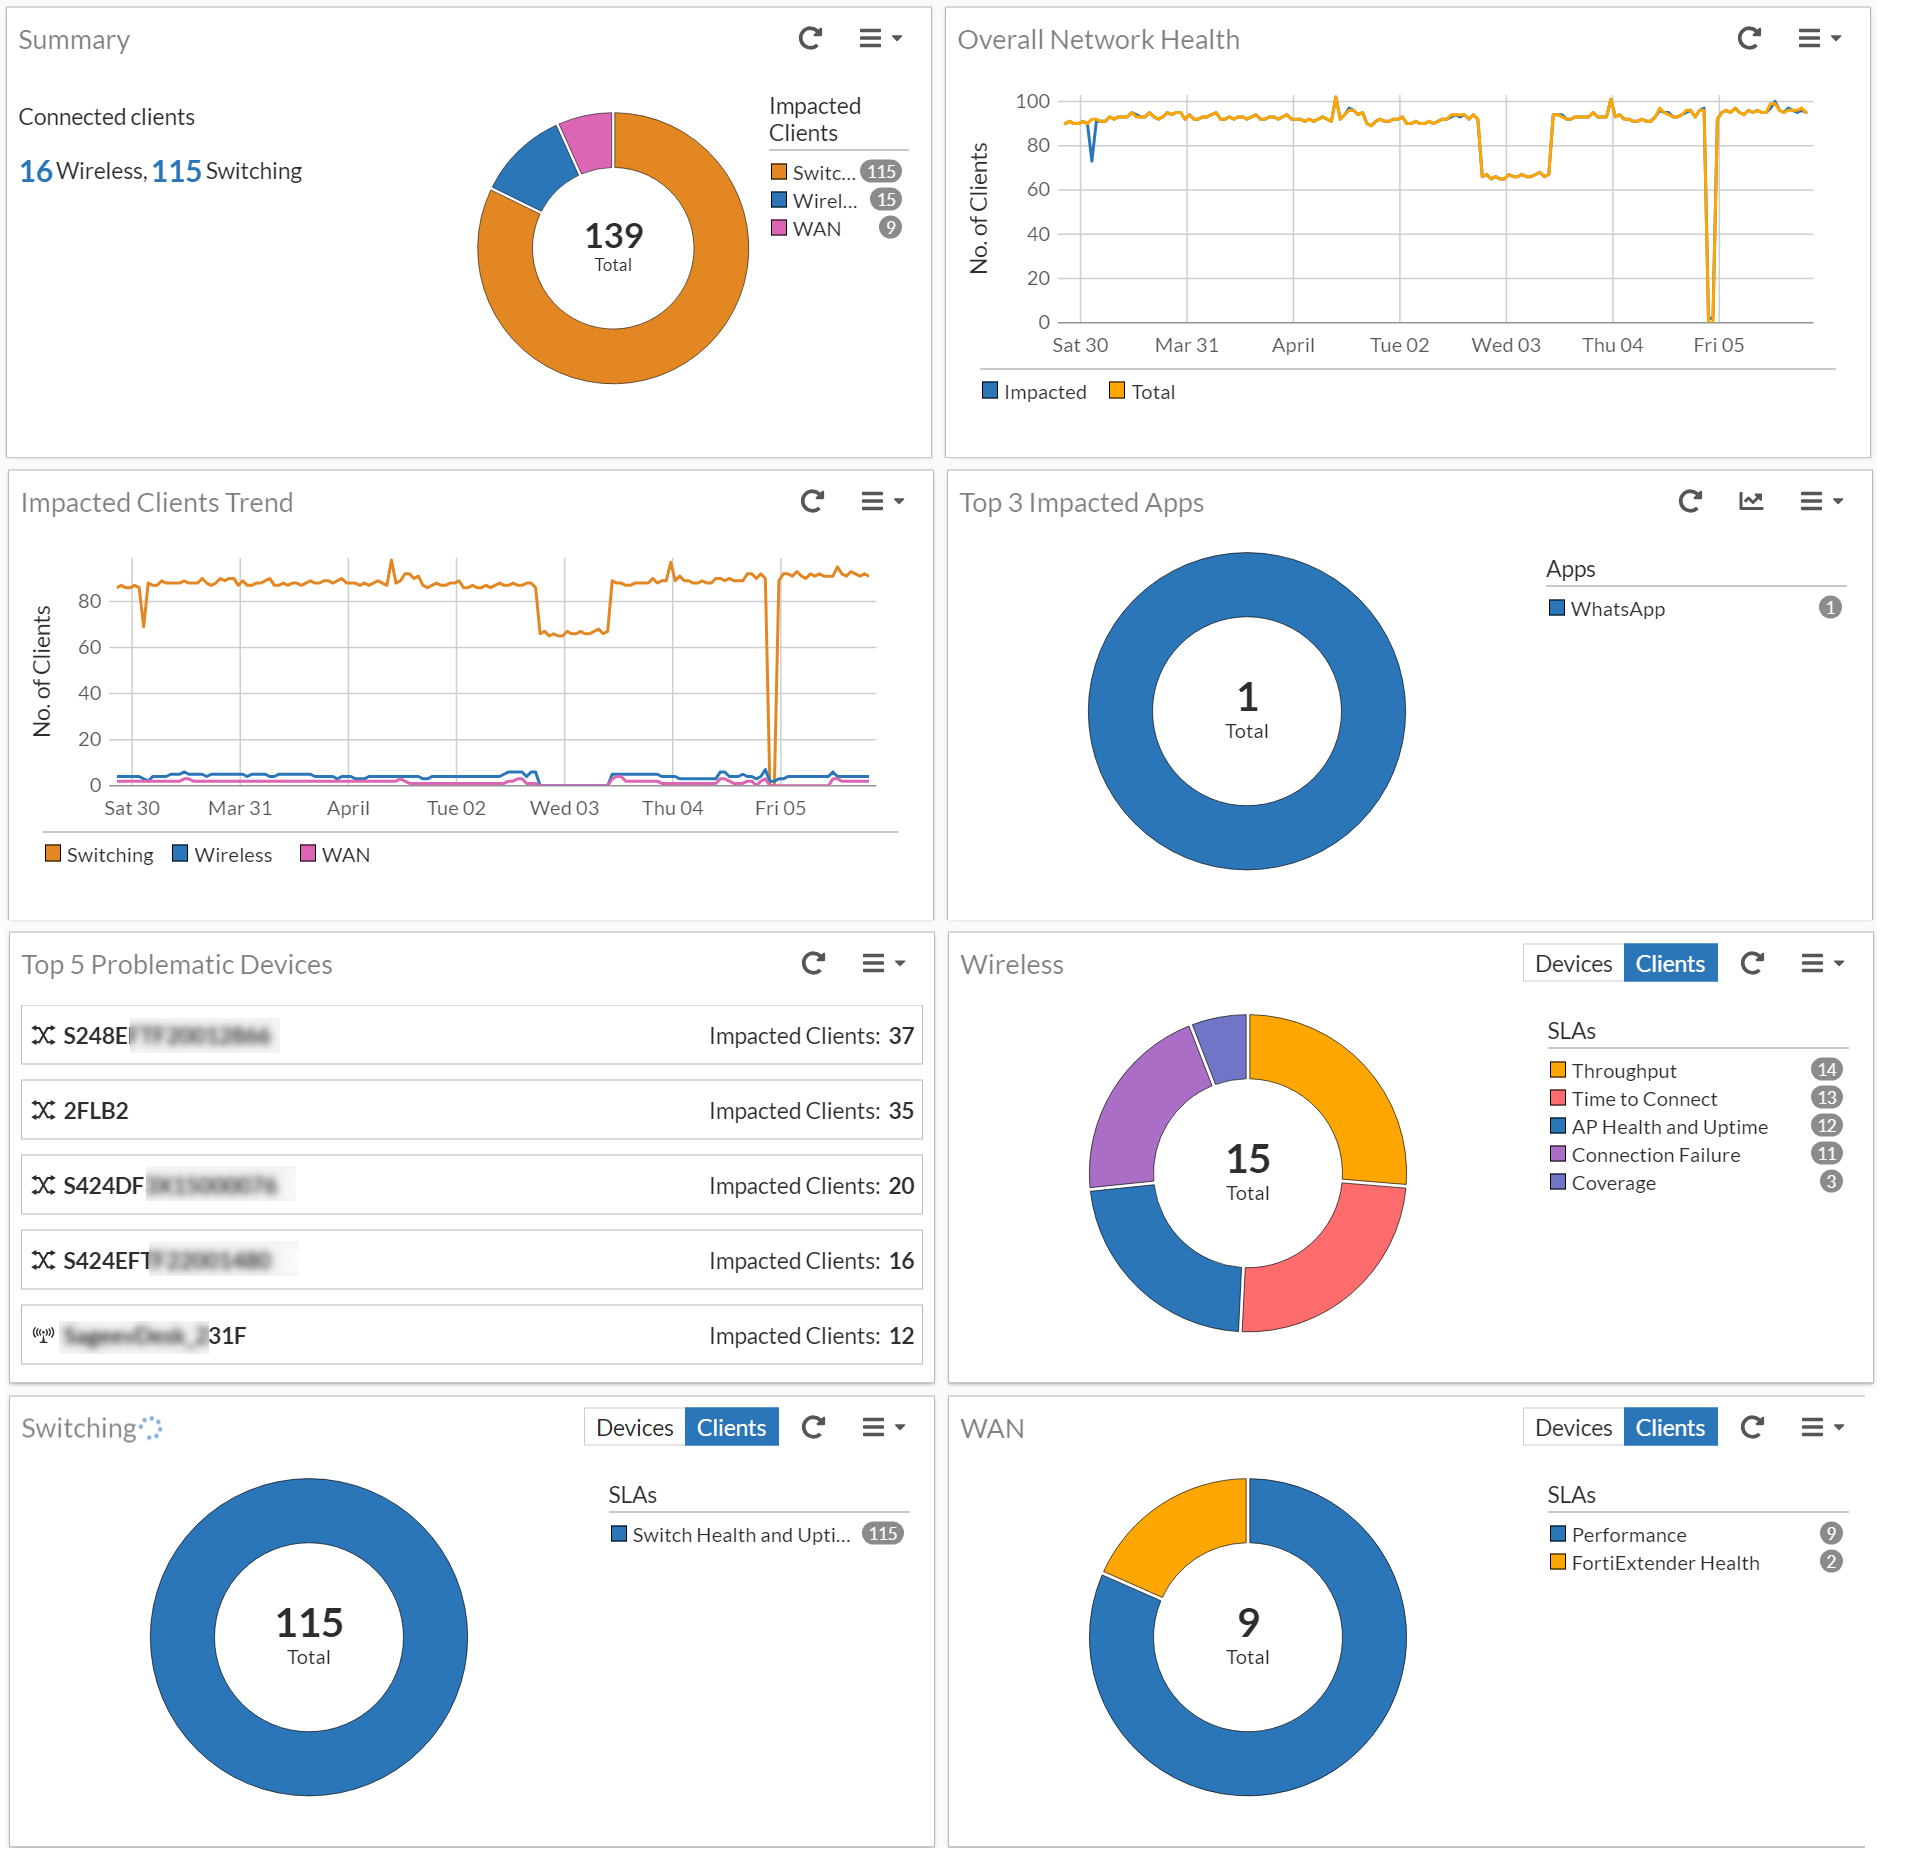
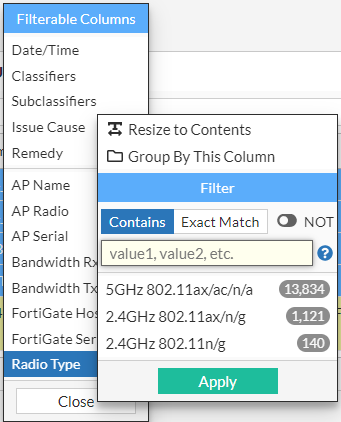
Clicking on the statistics of each of the panels in the dashboard displays detailed data graphically and in a tabular format. The data displayed in tabular format is filterable based on the columns, you can group data by a specific column or filter data for specific values. This is an example.
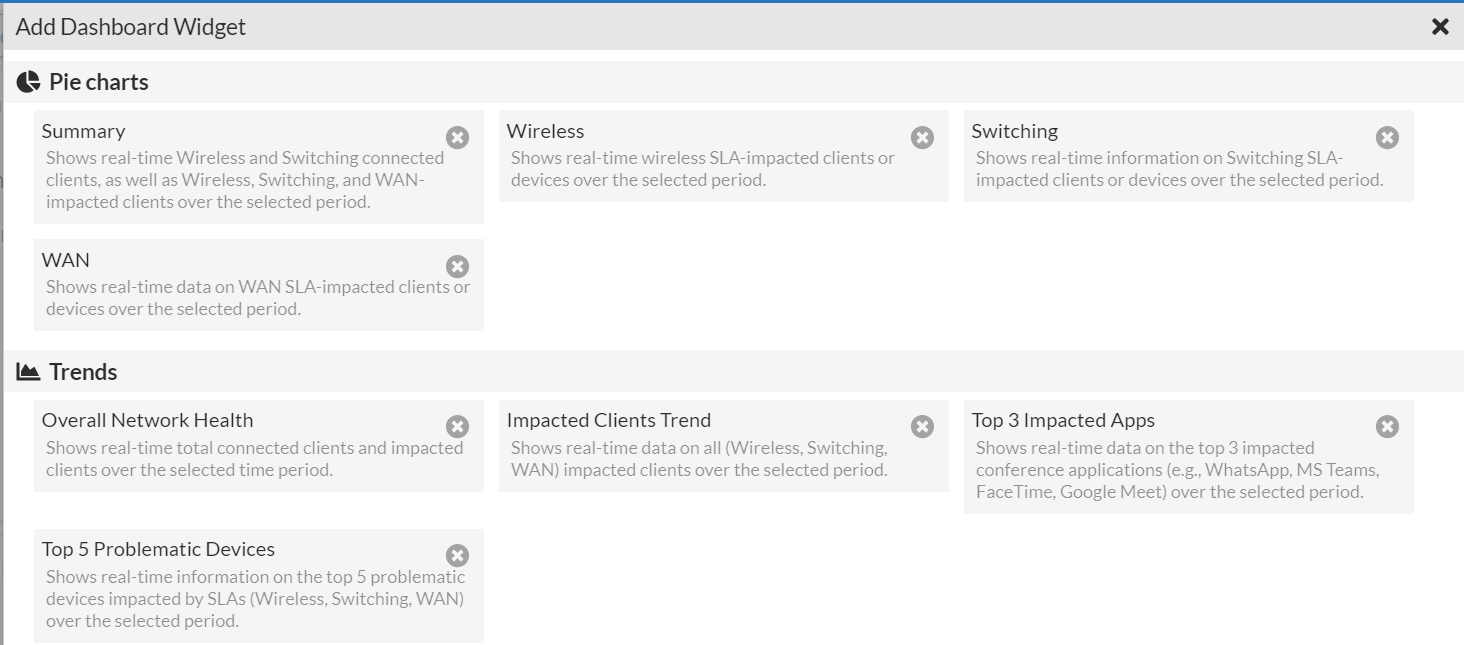
Dashboard data is refreshed at a configurable interval. Use the Add Widget option to manage the widgets displayed on the dashboard; you can choose to add or remove the widgets.