Channel Summary
This page provides granular insights into the performance of each channel with key insights into critical statistics, that are key in determining the health of your wireless network. This facilitates effective resolution of any potential network stability issues due to the operating channel. FortiAIOps retrieves and aggregates all channel related statistics from the FortiAPs operating in your network and multiple radios operating on various channels.
Note: All data and trends displayed on this page are for the last 1 minute.
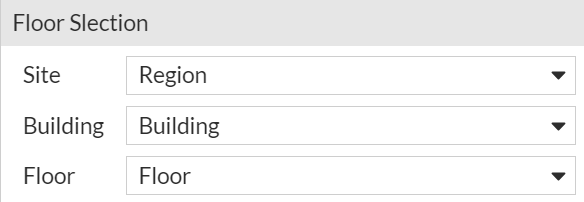
You can filter based on specific deployment locations such as Site, Building, and Floor.
Band
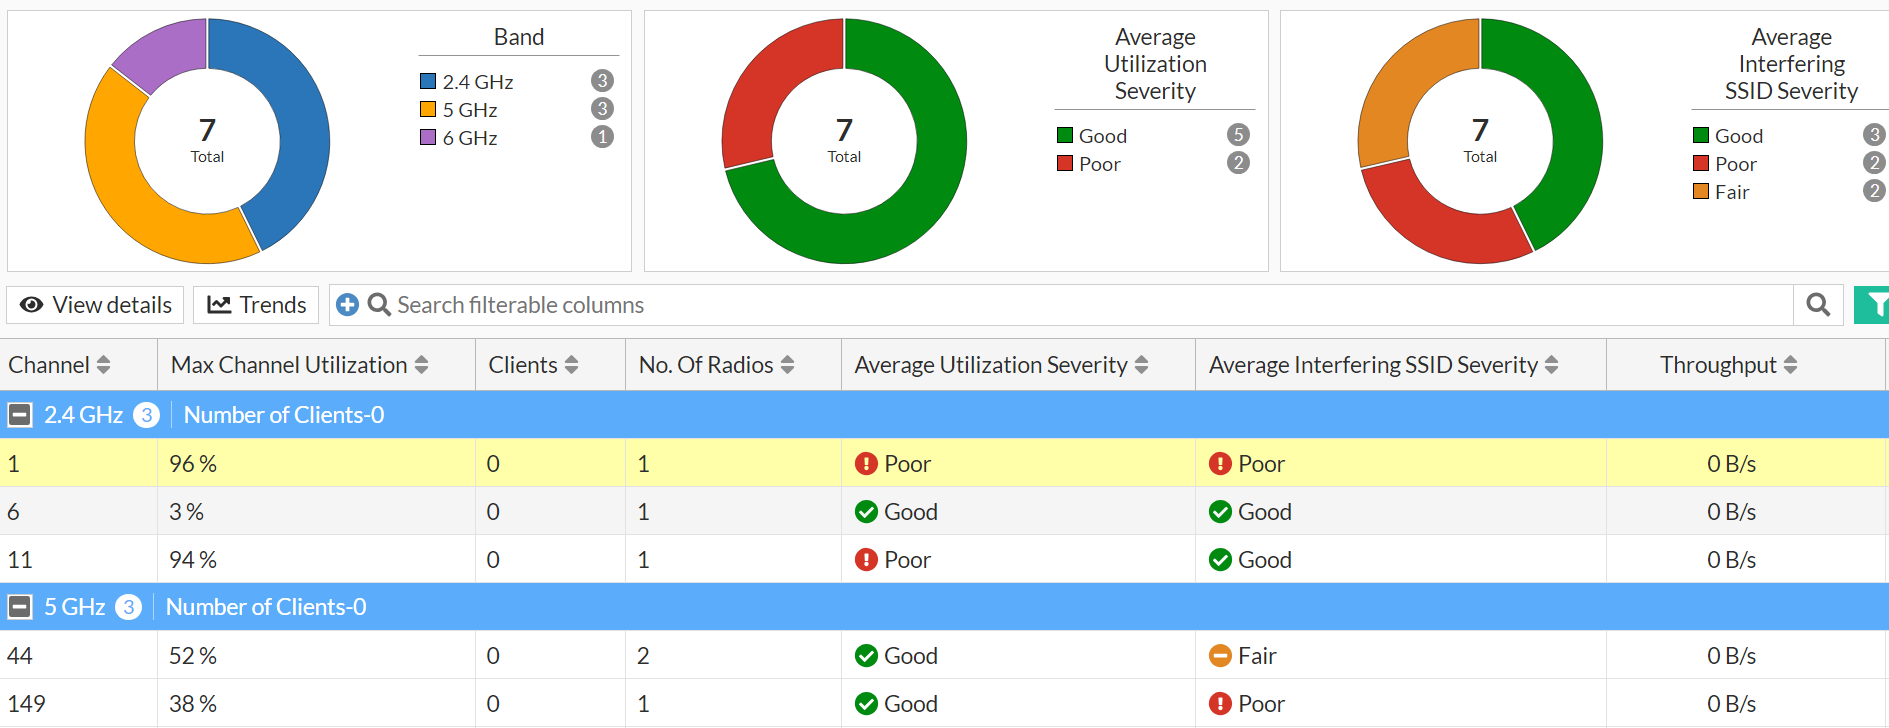
This chart provides channel count based on RF bands of 5 GHz, 2.4 GHz, and 6 GHz. The total number of channels for each band are displayed along with what percentage of the total channels used by the wireless network they comprise of. Click on any band to filter channel details and view them in the table below the charts.
Average Utilization Severity
This chart provides the channel count based on the average utilization severity over the last 60 seconds. FortiAIOps automatically categorizes the channels as Good or Poor, and Fair. The total number of channels for each severity are displayed along with what percentage of the total channels used by the wireless network they comprise of. Click on any severity to filter channel details and view them in the table below the charts.
Average Interfering SSID Severity
This chart provides the channel count based on the average interfering SSID severity over the last 60 seconds. FortiAIOps automatically categorizes the channels as Good or Poor, and Fair. The total number of channels for each severity are displayed along with what percentage of the total channels used by the wireless network they comprise of. Click on any severity to filter channel details and view them in the table below the charts.
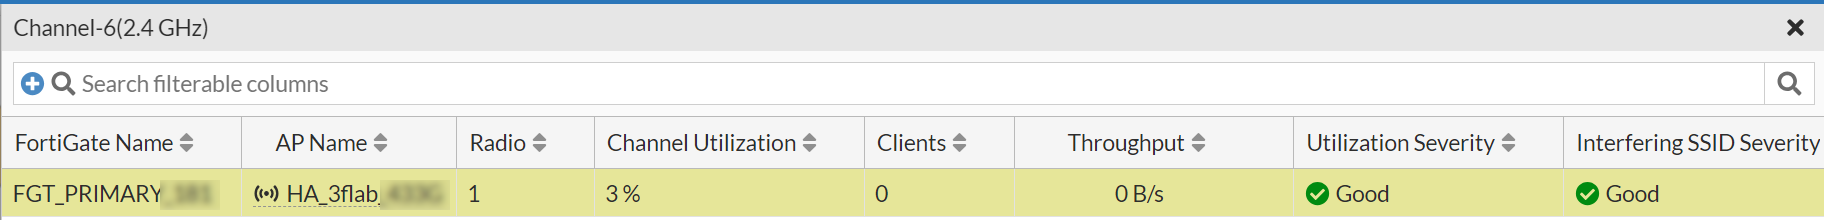
The channel data in the tabular format categorizes channels based on the RF band. To view radio level details for a particular channel number, select it and click View details.
|
Field |
Description |
|---|---|
| FortiGate Name and AP Name | The names of the FortiGate controller and FortiAP associated with the selected channel. |
| Radio | The radio operating on the selected channel. |
| Channel Utilization | Total channel utilization (in percentage) per radio. |
|
Clients |
The number of clients connected per radio. |
|
Throughput |
The total throughput of traffic passing per radio. |
|
Utilization Severity |
The average utilization severity of the selected channel. |
|
Interfering SSID Severity |
The average interfering SSID severity of the selected channel. |
|
SSIDs |
The SSIDs associated with the radio. |
|
Noise Level |
The noise level detected by the by the radio. |
|
Health Assessment |
FortiAIOps evaluates a assigns the health status of each radio. |
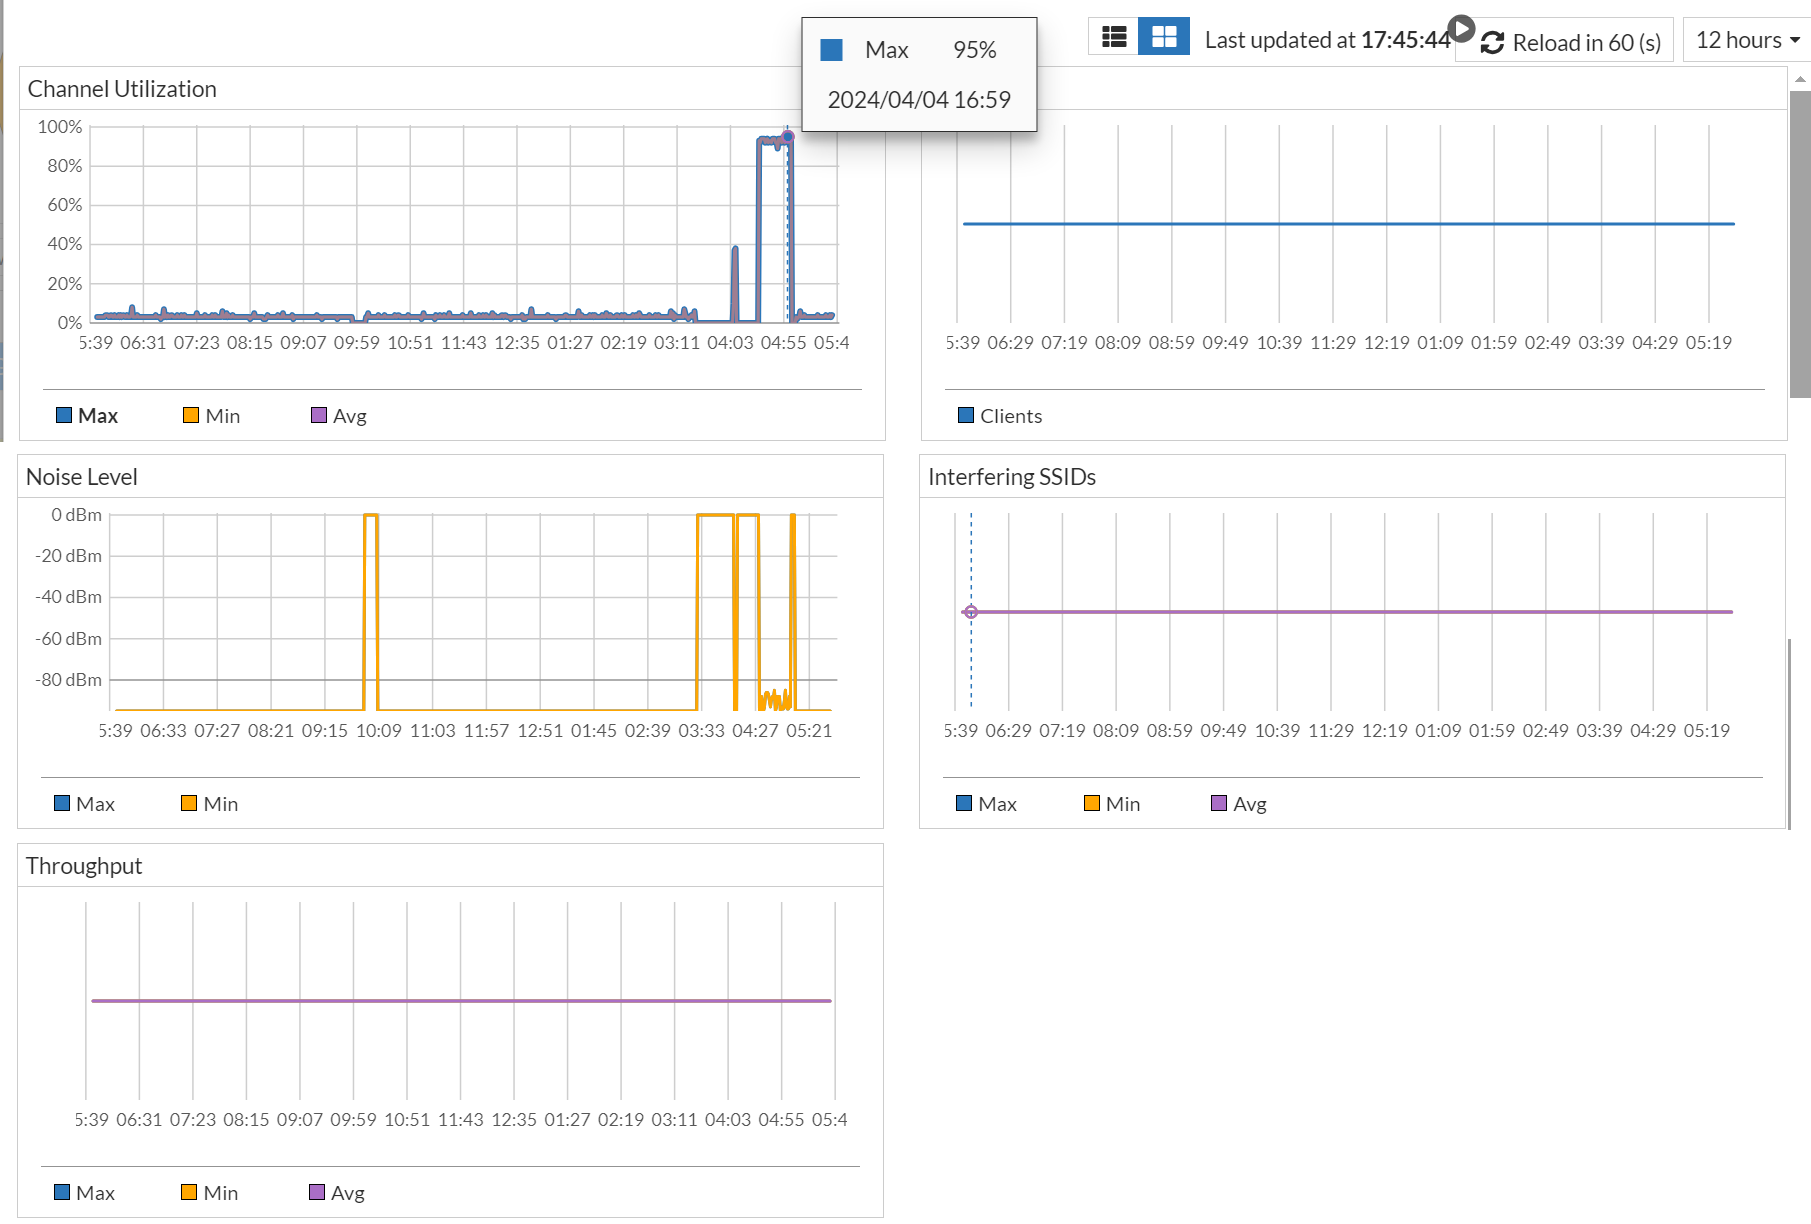
To view trends and patterns to assess the performance of specific channels, select a channel and click Trends. You can view a graphical representation of the channel statistics over a period of time. These trends can be filtered for the last 10 minutes, 1 hour, or 12 hours. Hover over the charts or click on a them to view the related statistics at a specific time. For example, the following image depicts a maximum channel utilization of 95% with the time stamp, clicking on this point provides similar data in a tabular format. You can filter the trends based on the selected duration or customized time slot; select a time window or define a Custom range. The custom range allows the selection of a minimum of 1 day and the maximum is the duration of log retention configured in System > Settings. The minimum, maximum, and average values are displayed when a time interval of more than 6 hours is selected.