
Summary
The Summary window displays information regarding channel distribution and power distribution.
Toggle between the Channel Distribution and Power Distribution options for relevant information.
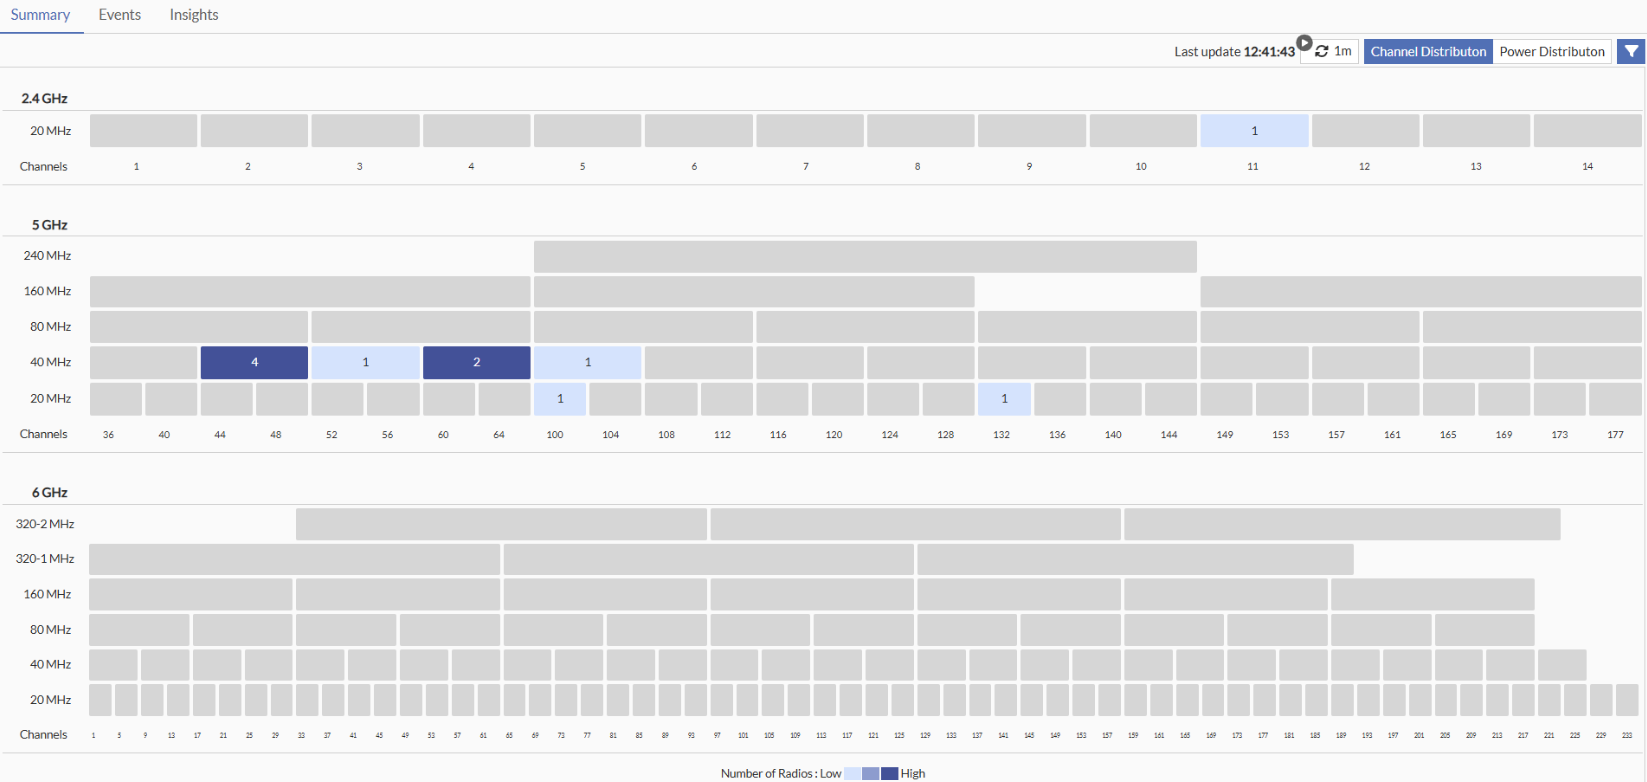
Channel Distribution
The Channel Distribution tab provides information about how the wireless network channels are utilized across different frequency bands. The information is categorized into three categories based on band namely – 2.4 GHz, 5 GHz, and 6GHz. Each band is further divided into different channel width - 20 MHz, 40 MHz, 80 MHz, 160 MHz, and so on. Hover over a channel number to view the number of radios operating on that channel.
The intensity of the channel colour indicates the number of radios present - a darker colour signifies more radios, and a lighter colour signifies fewer radios.
Use the Filter option to select FortiAPs and Radios at specific location such as Site, Building, and Floor.
Note:
-
By default, data from all FortiAPs and radios within the logged-in device group is displayed.
-
To view the data, you must have a valid monitoring license.
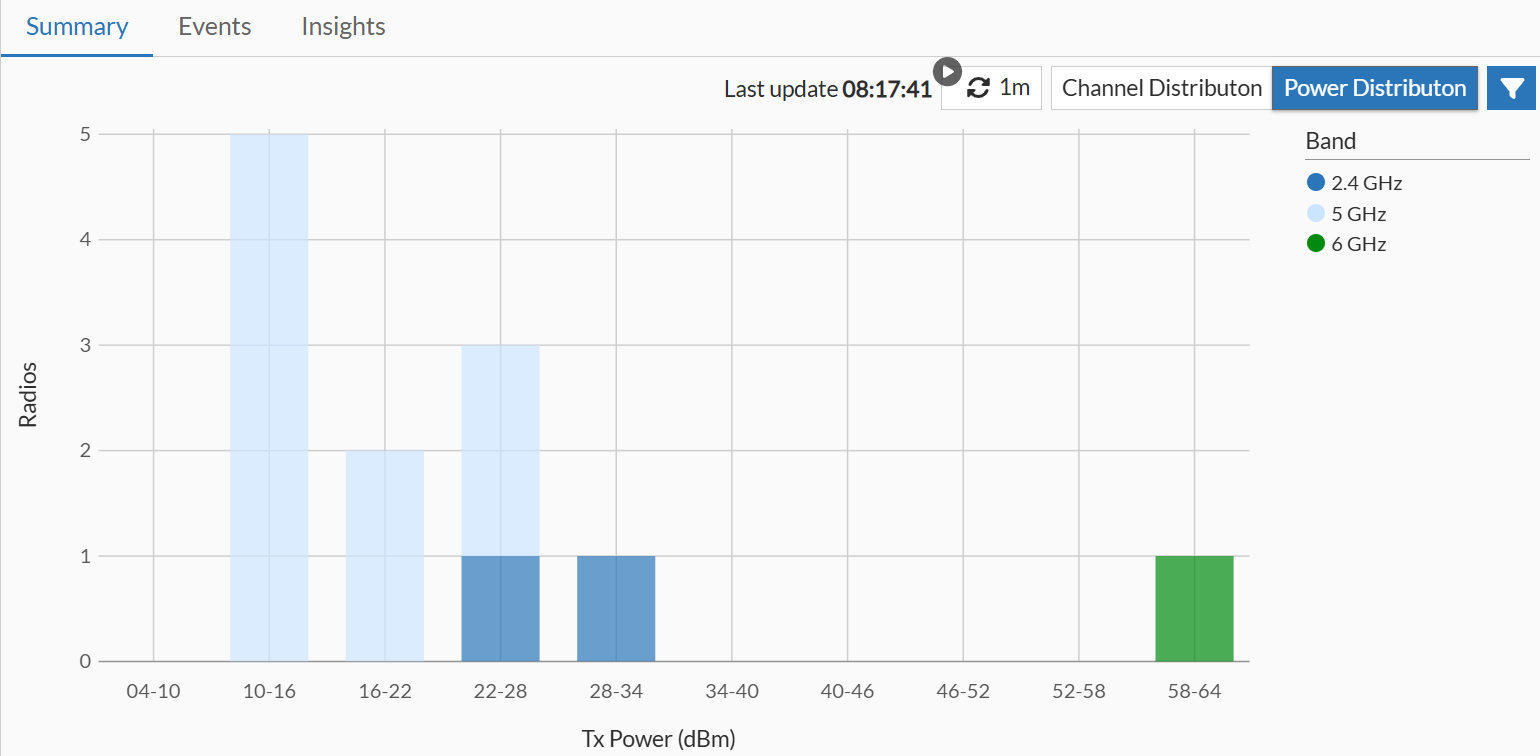
Power Distribution
Power distribution information shows how power is being used by the different radios in your access points. Each bar displays how many radios are transmitting at different power levels.
The vertical side (Y-axis) displays the number of radios operating at a specific power level and the horizontal side (X-axis) shows the amount of power each radio is using to send out signals, measured in dBm.
Power distribution is shown in three categories based on frequency band (2.4 GHz, 5 GHz, 6 GHz), with each band represented by a different colour.
Use the Filter option to select FortiAPs and Radios at specific location such as Site, Building, and Floor.
Note: By default, data from all FortiAPs and radios within the logged-in device group is displayed.