Managing Dashboard Widgets
The Manage Dashboard Widgets window lists all available widgets for your dashboard in one place. Widgets are organized into categories such as Monitoring, AI-Insights, Service Assurance, SD-WAN, and Licensing.
Use the filters on the left pane to quickly locate the widgets you are looking for.
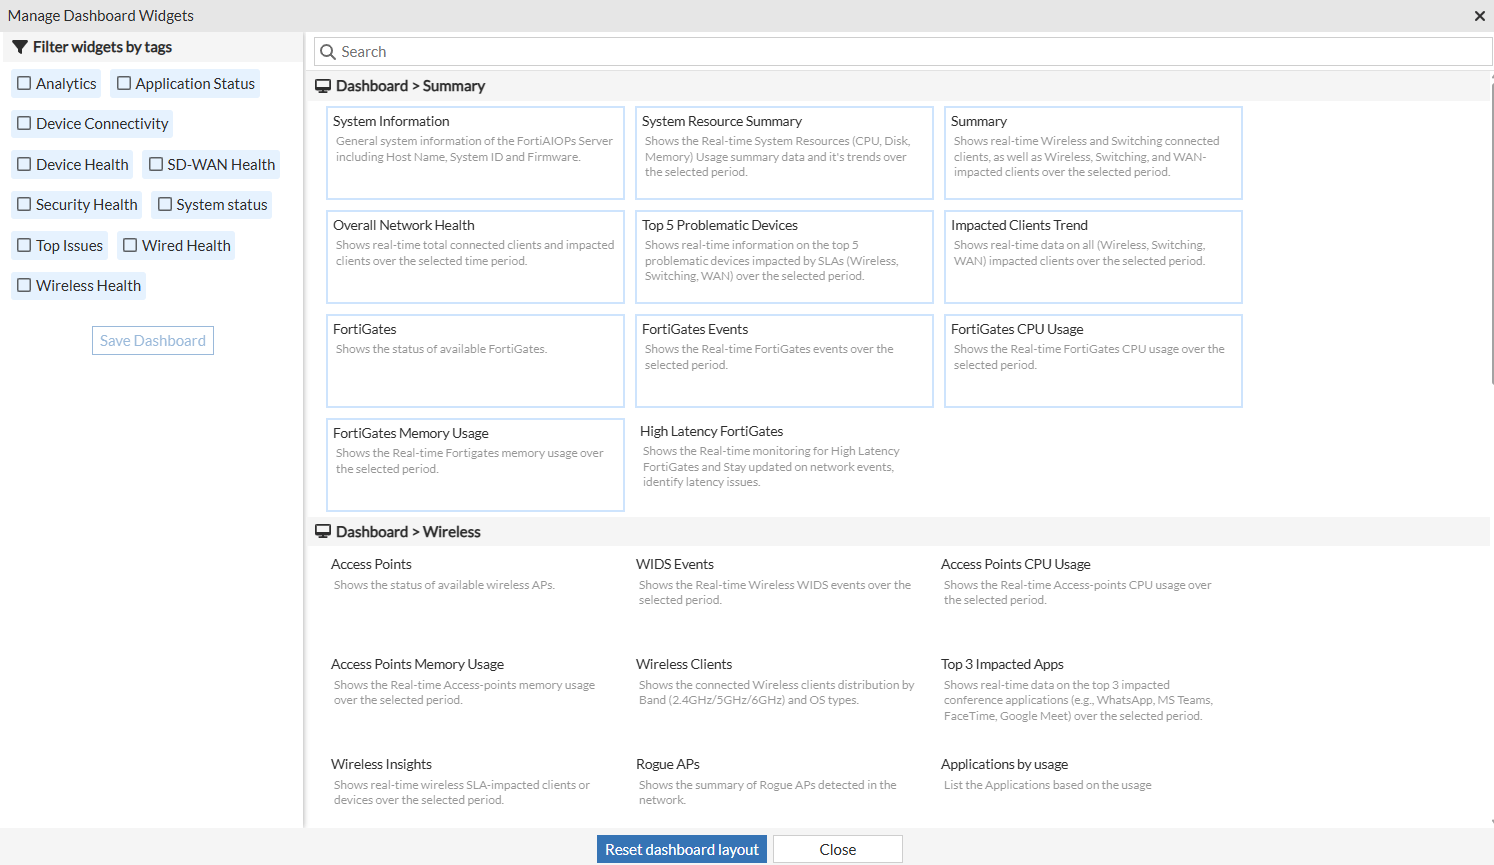
To clear all the widgets added to the dashboard, click Reset dashboard layout.
The widgets are categorized into the following sections:
Service Assurance
The Service Assurance dashboard for FortiAIOps is designed to provide comprehensive insights and monitoring of network performance. It consists of various widgets that offer visual representations and classifications of different metrics.
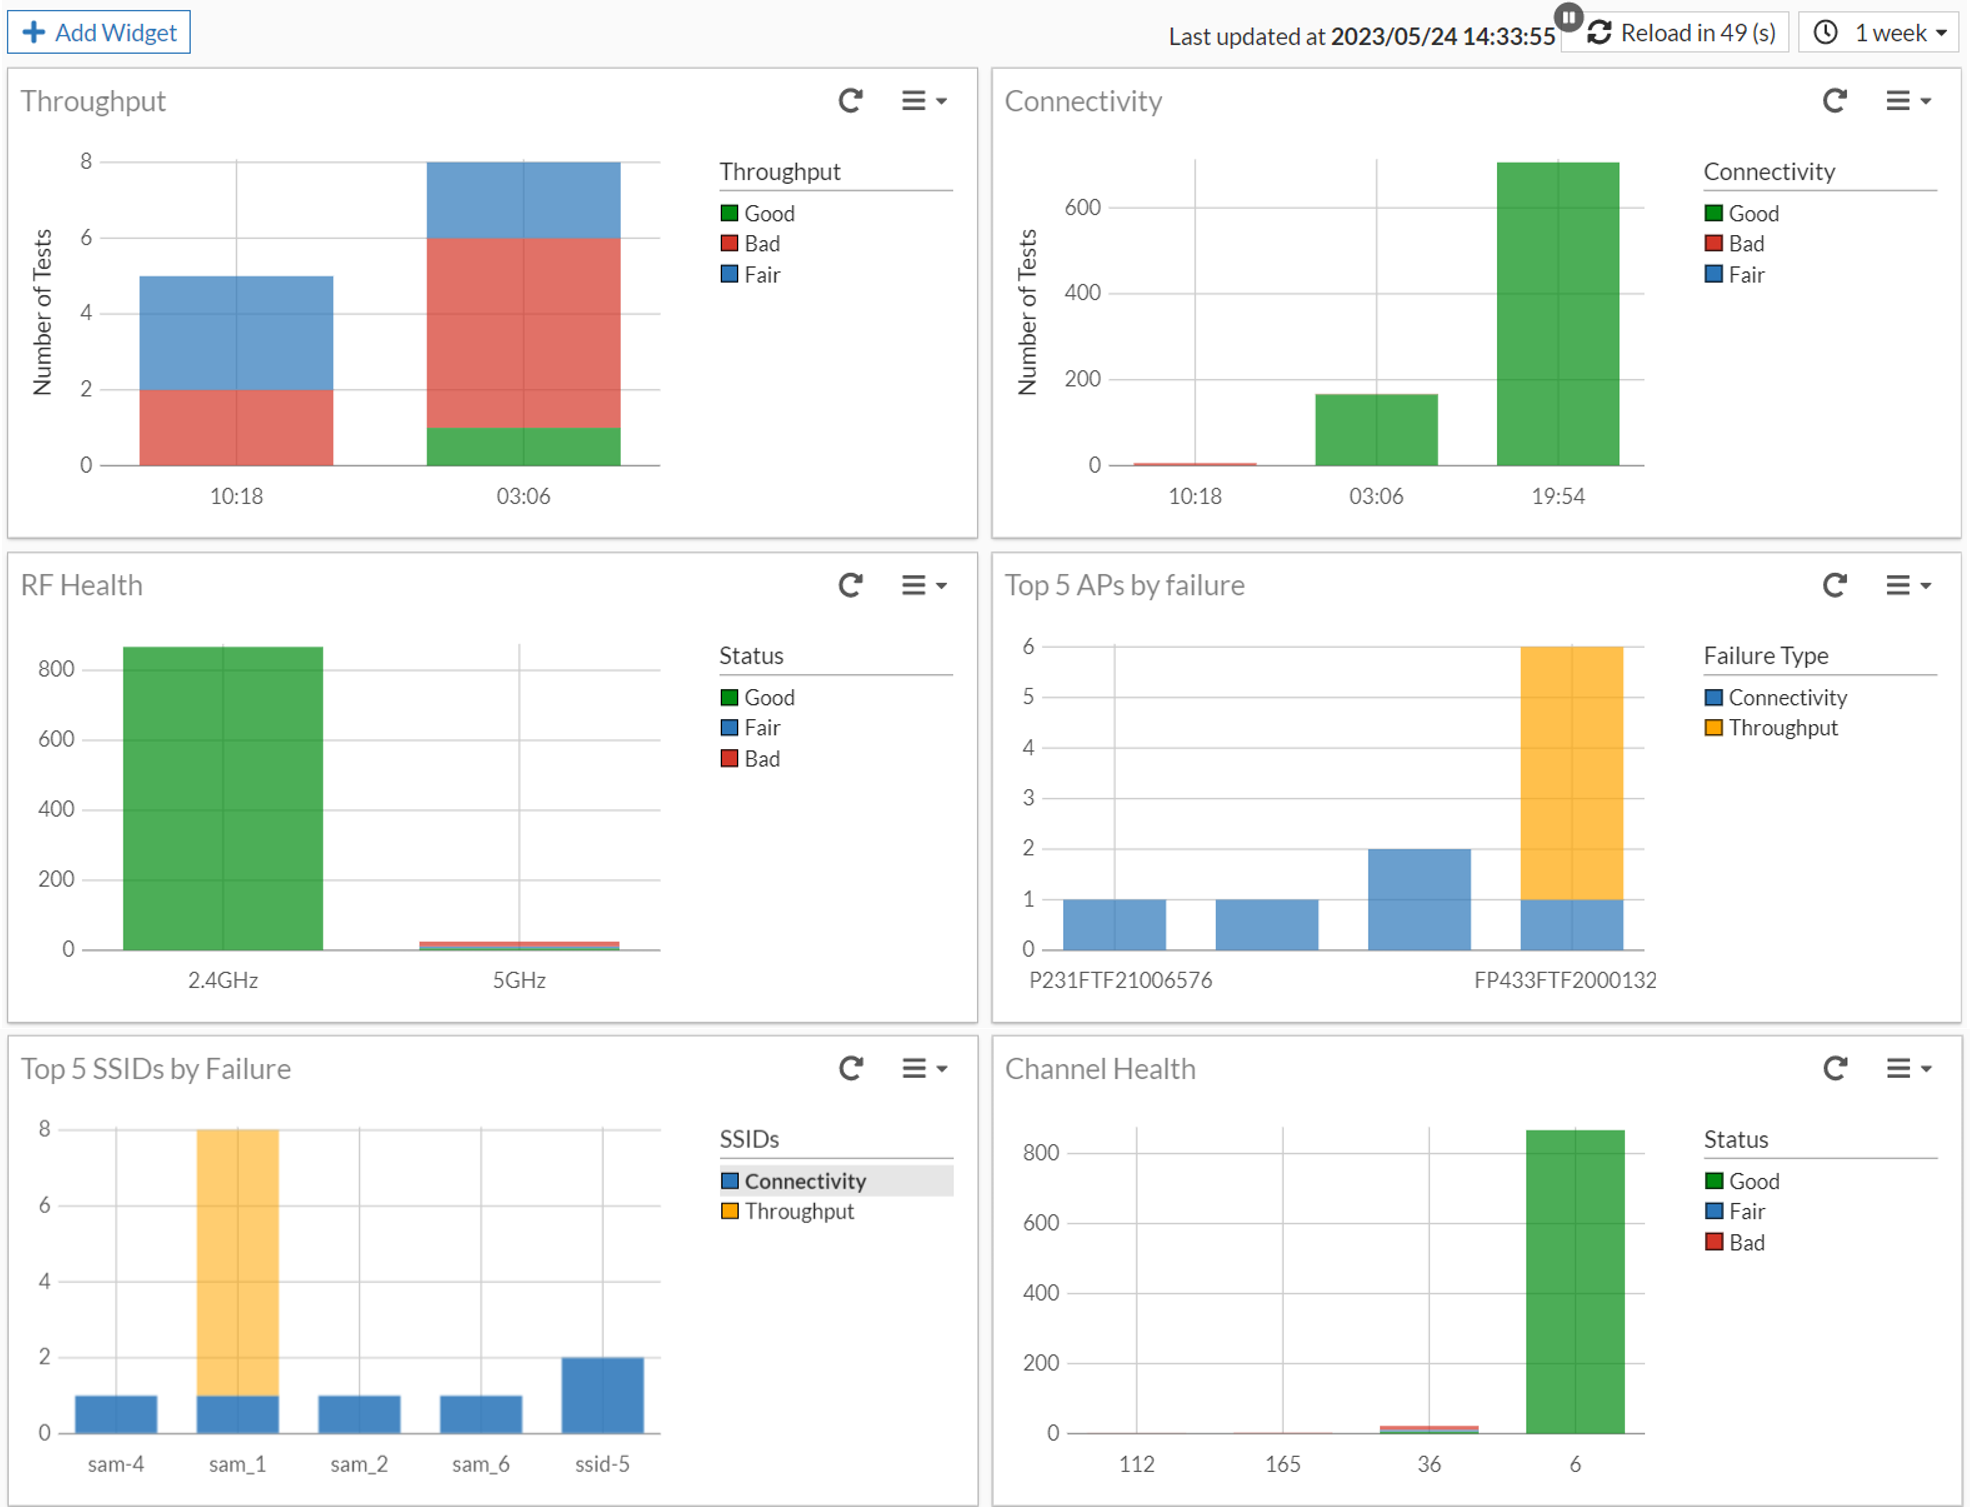
The data on this dashboard is based on scheduled test results and is automatically refreshed every 60 seconds; the following options are available to manage the auto-refresh feature for this page.
-
Click
 to manually refresh data.
 -
Click
 to pause the auto-refresh.
 -
Click
 to resume the auto-refresh.
 -
Select the time range from the drop-down. Choose from 10 minutes, 1 hour, 4 hours, 6 hours, 1 day, 1 week.
The dashboard provides an option to select the duration of the data displayed. You can choose between 1 day, 1 week, 1 hour, and 10 minutes.
Use the Add Widget option to manage the widgets displayed on the dashboard; you can choose to add or remove the widgets.
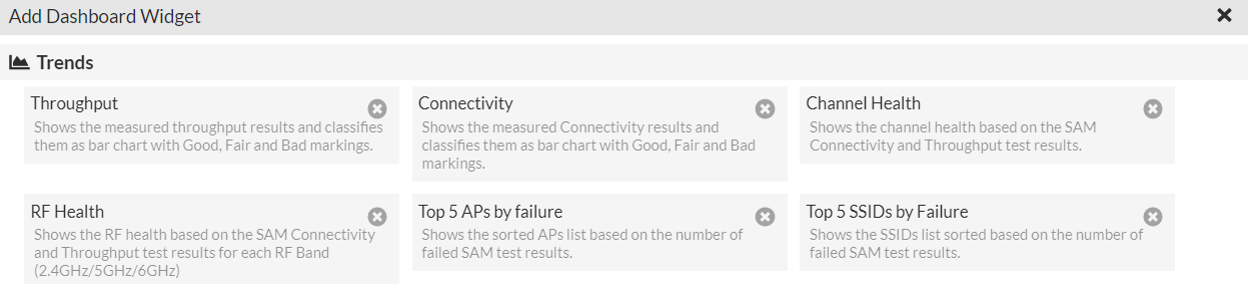
The following widgets provide network data on this dashboard.
-
Throughput - This widget displays the measured throughput results of your network. Throughput refers to the amount of data transferred through the network over a given time period. It presents the data in the form of a bar chart, indicating the performance levels as Good, Fair, or Bad. Click on the charts to view additional information.
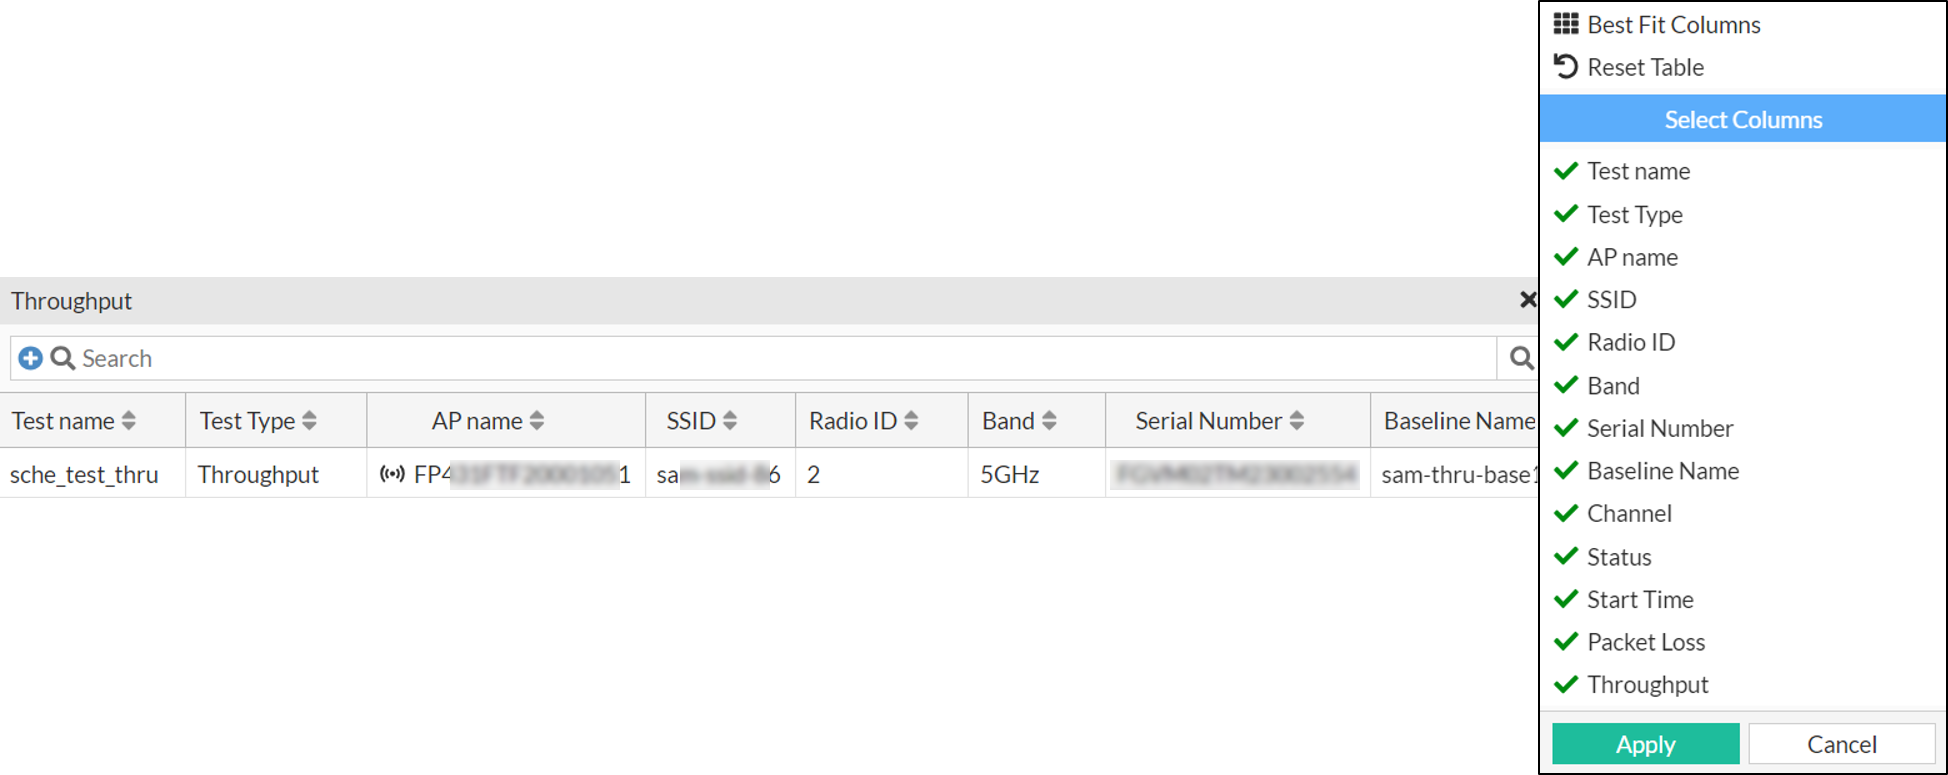
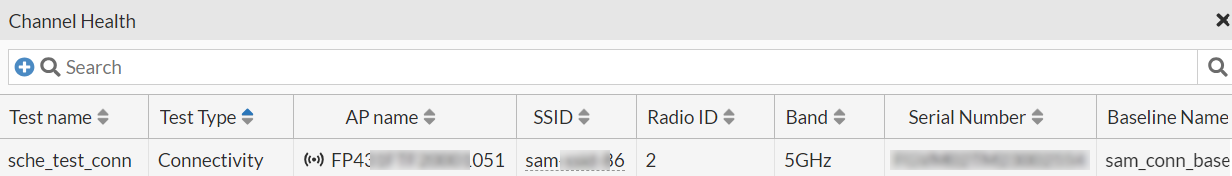
Right-click on the header of the table to select the columns that you wish to view.
Attribute Description Test Name The name of the associated test. Test Type The type of test, throughput or connectivity. AP Name The name of the access point used during the test. SSID The SSID associated with the network. Radio ID The associated radio ID . Band The frequency band utilized, 2.5 GHz or 5 GHz. Serial Number The serial number of the associated FortiGate. Baseline Name
The name of associated baseline.
Channel
The channel number utilized.
Status
The status of the test, Good, Fair, or Bad.
Start Time
The timestamp indicating when the test was initiated.
Packet Loss
The amount of data lost during transmission, expressed as a percentage.
Throughput
The measured network throughput, indicating the amount of data transferred.
-
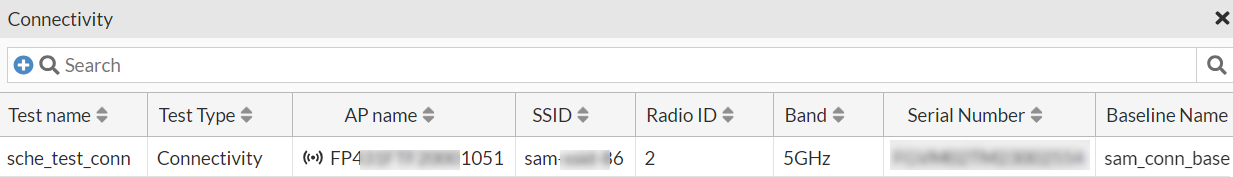
Connectivity - This widget displays the measured Connectivity results using a bar chart and classifies the results as Good, Fair, or Bad. Connectivity refers to the ability of devices to establish and maintain a connection to the network.Click on the charts to view additional information.
-
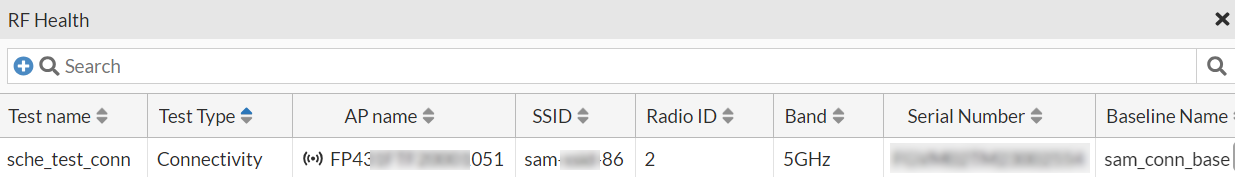
RF Health - This widget displays the radio frequency (RF) health based on the Service Assurance Manager (SAM) Connectivity and Throughput test results for each RF Band(2.4GHz/ 5GHz). Click on the charts to view additional information.
-
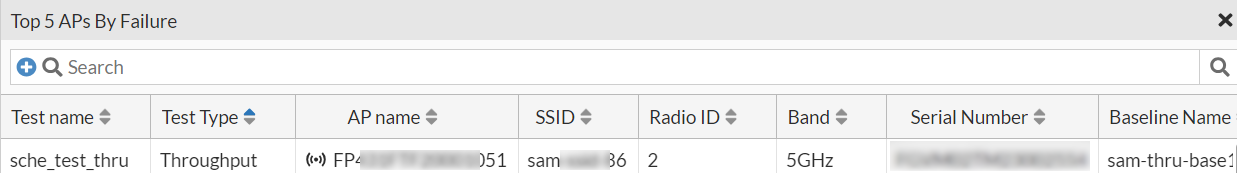
Top 5 APs by Failure - This widget displays a sorted list of Access Points (APs) based on the highest number of bad results. Click on the charts to view additional information.
-
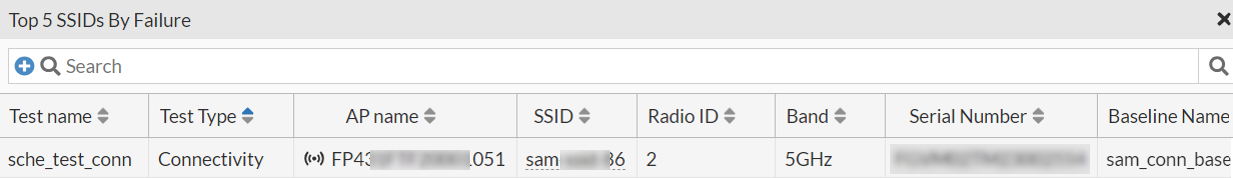
Top 5 SSIDs by Failure - This widget displays a sorted list of SSIDs based on the highest number of bad results. Click on the charts to view additional information.
-
Channel Health - This widget displays the overall health of the network channels based on the SAM Connectivity and Throughput test results. Click on the charts to view additional information.