
Creating datasets
The following procedure describes how to create datasets in FortiAnalyzer.
For additional details, see the FortiAnalyzer Administration Guide in the Fortinet Docs Library.
To create a custom dataset:
- Go to Reports > Report Definitions > Datasets.
- Click Create New.
- Configure the dataset.
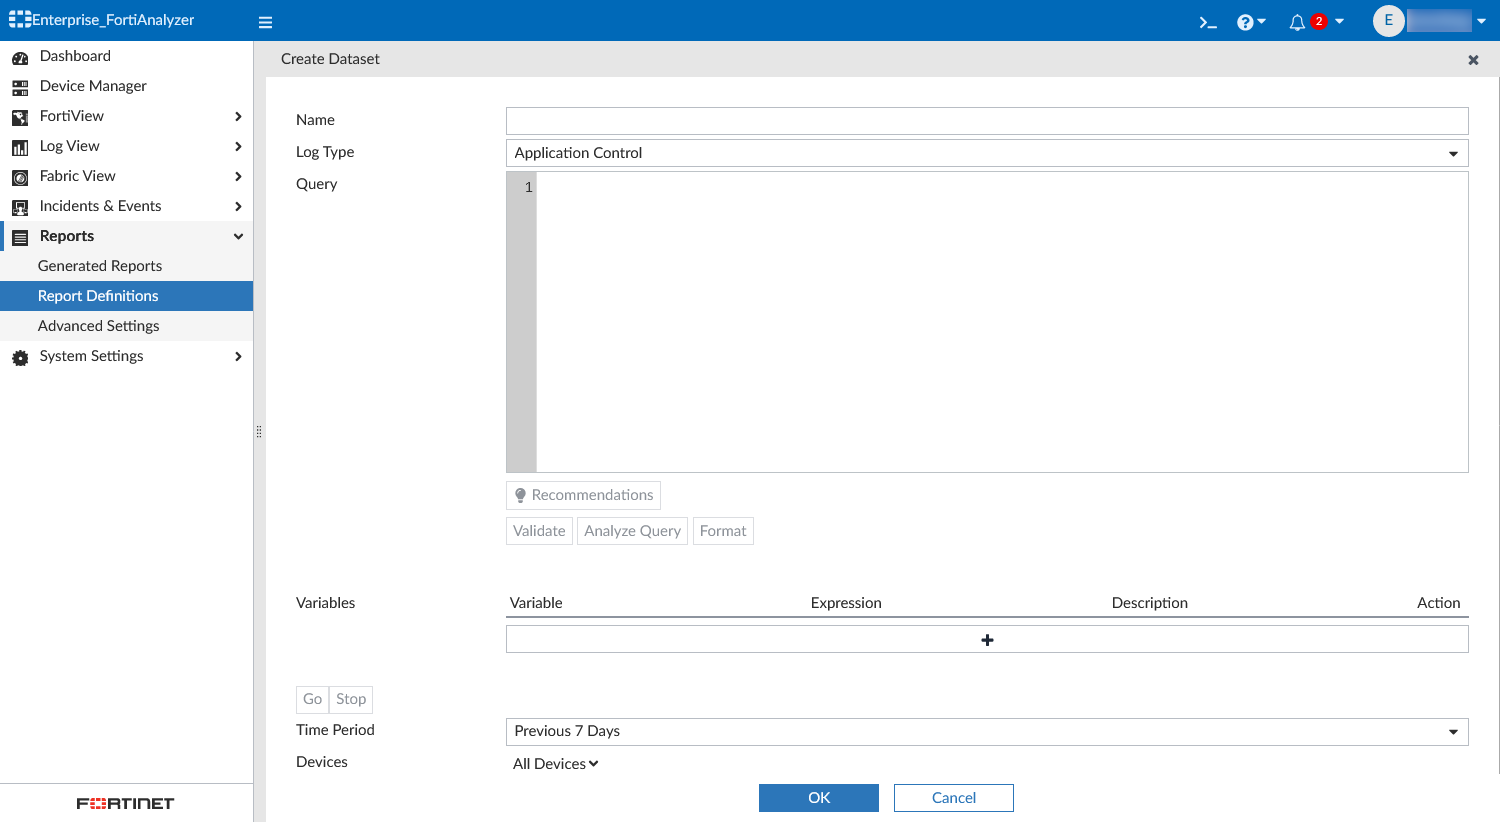
Name Enter a name for the dataset. Log Type Select the log type to be used in the dataset.
$logis used in the SQL query to represent the log type you select, and it is run against all tables of this type.If you are creating the dataset in a Fabric type ADOM, you must choose the log type under the appropriate device type. For example, FortiGate or FortiMail.
Query Enter the SQL query used for the dataset. An easy way to build a custom query is to clone and edit a predefined dataset.
While entering the SQL query in this field, automatic suggestions display a list of possible commands, table names, log fields, and more to use in your query where applicable. You can also mouse over related areas in the Query field to view the log fields available in the table. For example, you can mouse over
from $logto view the log fields in that table.Recommendations
Check for similar predefined dataset queries. The Dataset Query Recommendations pane displays the datasets in order of rating by similarity. You can expand the recommended dataset queries and Copy or Format the query, as needed. For an example, see Dataset recommendations.
Validate
Validate the entered SQL query. If any errors are present in the query, the details of the error are displayed below the query. If there are no errors in the query, the message will display OK.
For an example, see Dataset validation.
Analyze Query
Perform a detailed analysis on the SQL query. Analyze Query displays the original SQL query, the transformed SQL query (if applicable), and the SQL validation results. For an example, see Analyzing a query.
This function also allows users to view the hcache query that is used when a report using this dataset has enabled the auto-cache option for faster report generation. For more information on hcache, see Hcache.
Format
Automatically format the entered SQL query, making it easier to read, update, and detect errors.
Variables Click the + to add variable, expression, and description information.
If added, the expression for the variable will be used when configuring filters for reports that use this dataset. For example, if Variable = User (user) and Expression = coalesce(nullifna(`user`), ipstr(`srcip`)), then the expression will be used when User (user) is selected as the Log Field in a report's filter. See Filtering report output in the FortiAnalyzer Administration Guide.
Go
Test the SQL query before saving the dataset configuration.
Click Stop to end a test in progress.
Time Period
From the dropdown, select a time period to run the SQL query against. When selecting Custom, enter the start date and time, and the end date and time.
Devices
From the dropdown, select devices to run the SQL query against.

The SQL dataset test function (Go) can be used to determine if any errors are present in the SQL format. It should not be used to test returned values as those may be different than the ones used in reports.
- Click OK to save.
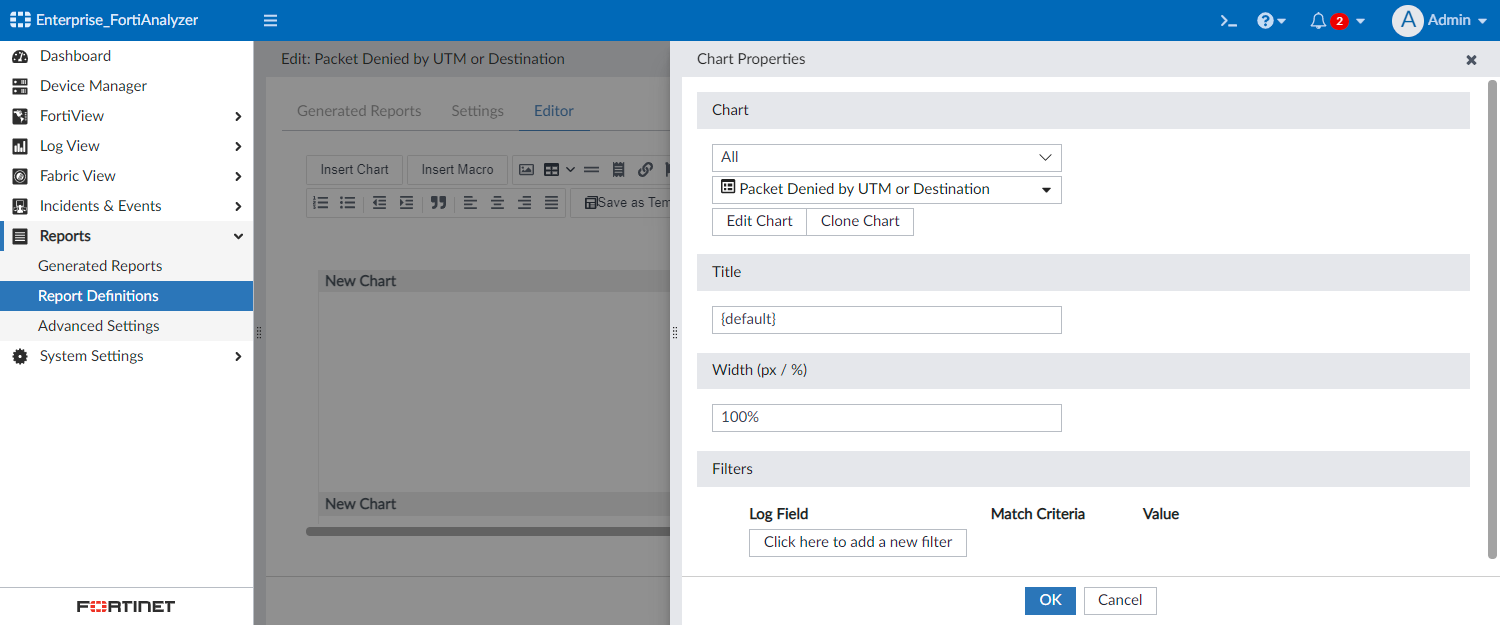
To add a dataset to a chart:
- Go to Reports > Report Definitions > Chart Library, and click Create New or edit an existing chart.
- From the Dataset dropdown, select your custom dataset.
- Configure the remaining chart details, and click OK.
The chart based on your custom dataset is now available for use in reports.
To use a chart in reports:
- Go to Reports > Report Definitions > All Reports.
- From the Report dropdown, click Create New.
You can also edit an existing report to add the chart.
- In the Create Report dialog, configure the options and click OK.
-
Name
Enter a name for the report.
Create from
Select Blank or Template.
If Template is selected, select a template for the report from the Select Template dropdown.
Save to Folder
From the dropdown, select a folder to save the report in.
You can click the Add button to save the report to multiple locations.
- Go to the Editor tab for the report, and click Insert Chart.
- From the Chart dropdown, select the chart that you created.
- Click OK.
- Configure the remaining report settings, and save your changes.
For more information, about creating charts and creating reports, see the FortiAnalyzer Administration Guide.