


Debug logs
Extended debug logs can be accessed by using your web browser to browse to https://<FortiAuthenticator-IP-Address>/debug.

|
Log Categories |
From the tree menu select a log type:
Note: The CLI Packet Capture (tcpdumpfile) log category is only available when the |
|
Debug Kit |
Select Upload a file to upload a debug kit from your computer. Note: The option is only available for some log types. |
|
Max. log files size |
From the dropdown, select the maximum log file size. You can select up to a maximum of 500 MB. This gives you access to an extended history of debug files. Note: The option is only available for some log types. |
|
Log level |
From the dropdown, select the log severity level. |
|
Enter debug mode |
If HA or RADIUS Authentication is selected from the log category, the option to enter the debug mode is available. See RADIUS debugging. |
|
Enter detail debugging mode |
You can enter detailed debugging mode if RADIUS Authentication is selected from the log category. See RADIUS debugging. |
|
Search |
Enter a search term in the search field, then select Search to search the debug logs. |
|
Page navigation |
Use the First Page, Previous Page, Next Page, and Last Page icons to navigated through the logs. |
|
Show |
Select the number of lines to show per page from the dropdown menu. The options are: 100 (default), 250, and 500. |
RADIUS debugging
RADIUS authentication debugging mode can be accessed to debug RADIUS authentication issues.
From the Log Categories menu, select RADIUS Authentication and select Enter debug mode from the toolbar.
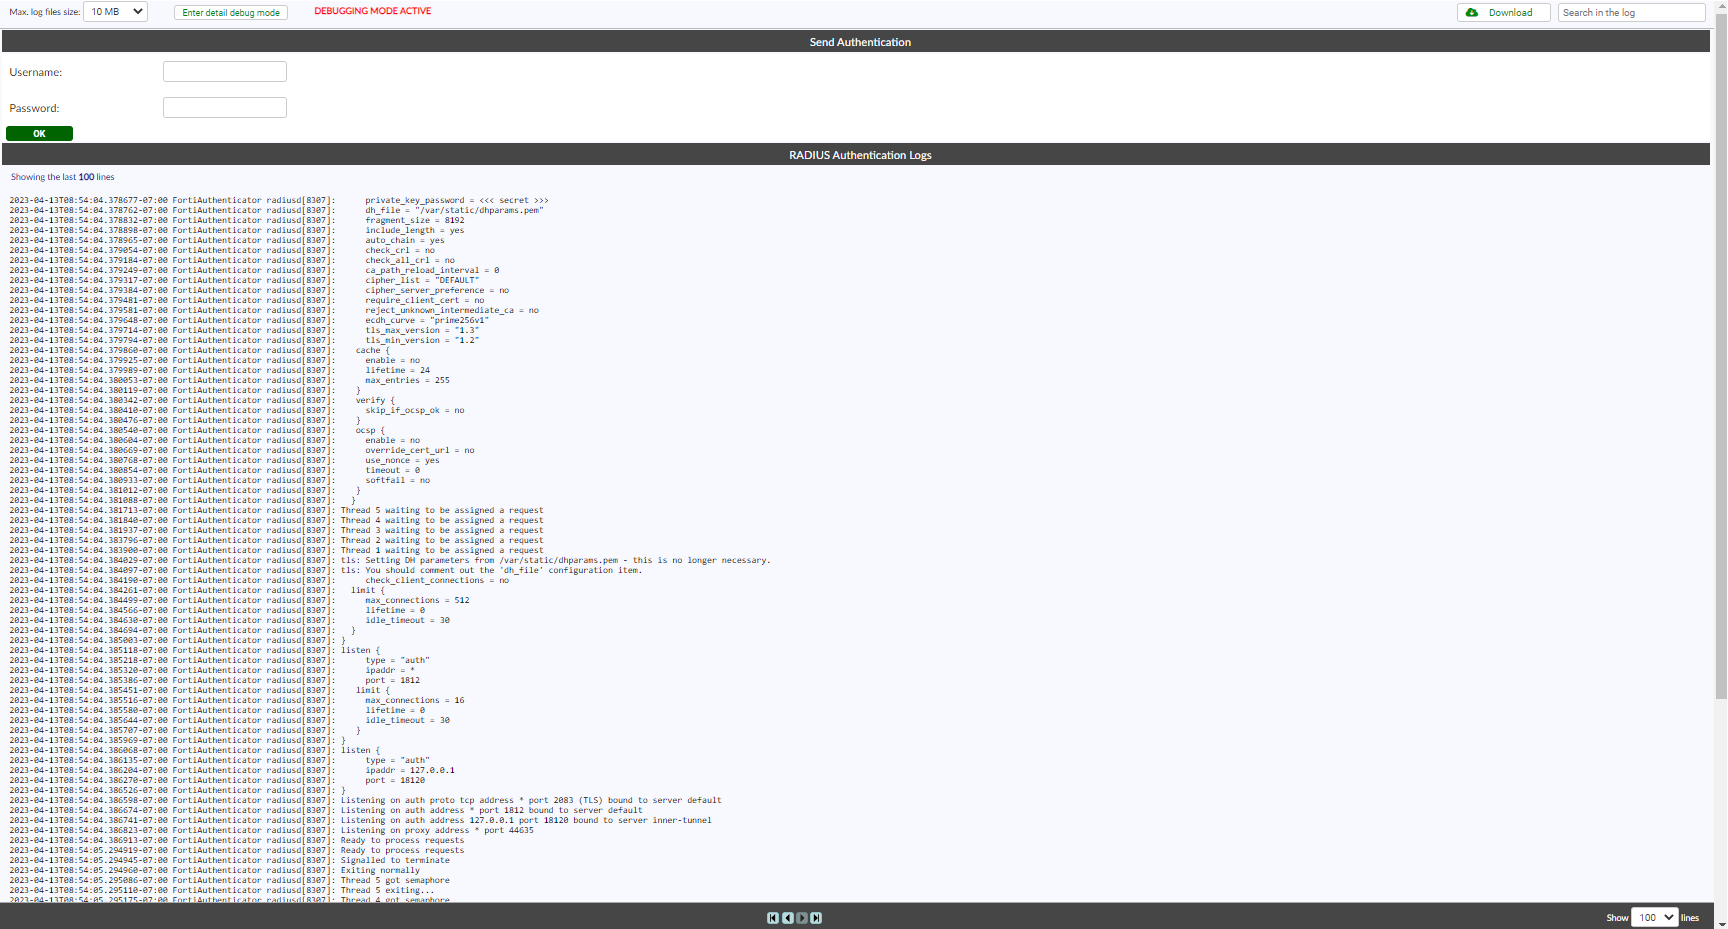
Enter the username and password and select OK to test the RADIUS authentication and view the authentication response and returned attributes.
Select Enter detail debug mode to enter the detailed debug mode.

Enter the username and password and select OK to test the RADIUS authentication and view the authentication response and returned attributes.
Select Exit debug mode to deactivate the debugging mode.
The following table lists the related CLI commands and GUI elements for RADIUS debugging:
|
CLI command |
Description |
GUI |
|---|---|---|
|
|
Put the RADIUS service into normal running mode (only error and system info debug logs). |
Exit debug mode |
|
|
Put the RADIUS service into debug mode. Note: |
Enter debug mode |
|
|
Put the RADIUS service into detailed debug mode. Note: |
Enter detail debug mode |
|
|
After a reboot, the RADIUS service will automatically be in normal running mode (equivalent to |
TCP stack hardening
Configure the number of TCP SYNACK retries for the Linux kernel by accessing:
https://<FortiAuthenticator-IP-Address>/debug/tcp_tuning

From here, enter the number of retries between 1 - 255 (default is 3) and then select Save.
FastAPI debug mode
When FastAPI is selected in Log Categories > Web Server, Enable FastAPI Debug Mode button is available. Clicking Enable FastAPI Debug Mode allows you to record the activity according to the selected options:

|
Max request amount |
The maximum number of requests:
|
|
Debug run time |
The debug run time:
|
For example, if the Max request amount is set to 50 and the Debug run time is 1 Minutes, the FortiAuthenticator profiler tool saves the 50 slowest HTTP requests within the next 1 minute.
High level details of the slowest HTTP requests are displayed in the Log Categories > Web Server > FastAPI page.

Once the Debug run time has elapsed, click Download to download a report generated by the profiler tool with additional information.