
Dashboard
The dashboard provides an insight into the scanned assets based on the vulnerabilities, threat levels, and OWASP Top 10 - 2021 vulnerabilities’ categorization. Based on the vulnerability scanning, details for the top 5 assets are provided in the dashboard. These details are for the assets listed in the Threat Level for each IP.
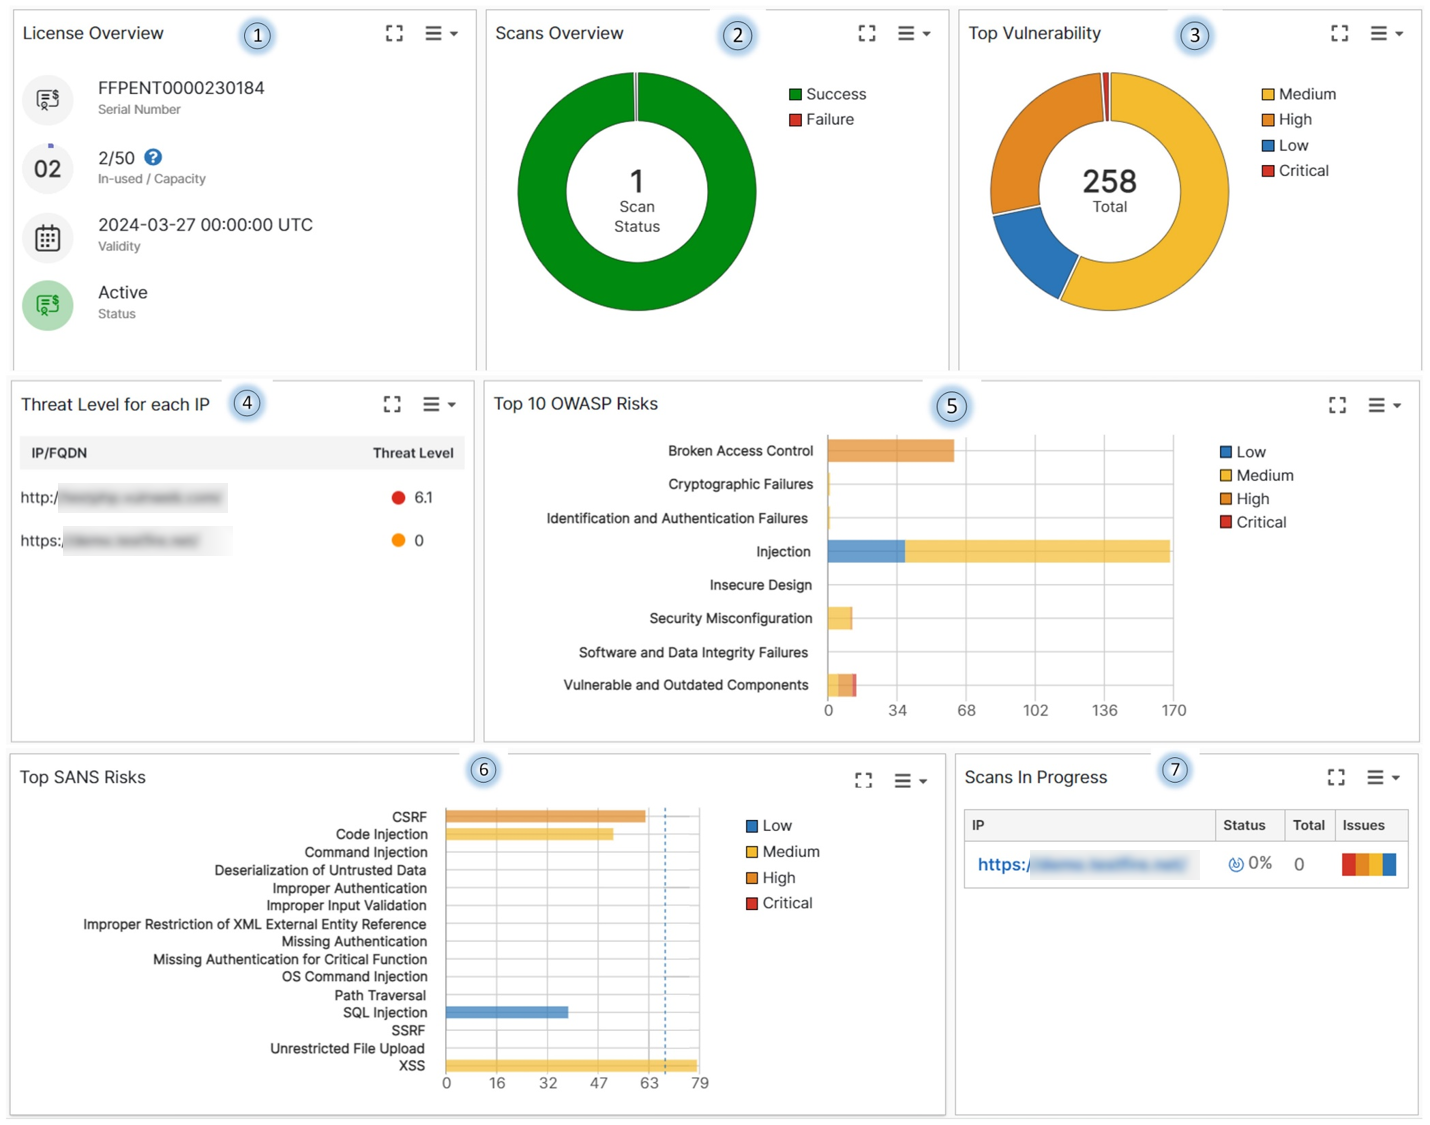
The dashboard is divided into donut/pie charts with each color coded wedge of the chart representing a particular count/percentage. Hover over different parts of the chart to view details.
|
Section |
Description |
|---|---|

|
Provides an overview of your subscription status. The license status, validity, serial number, and the number of scans allowed/conducted are displayed. |

|
The total number of scans conducted and the status of the scans, whether successful or failed. |

|
Categorizes the detected vulnerabilities as medium, high, critical, and low. Click on a section of the chart to view the vulnerability details. See CVSS Score. |

|
The overall threat level score for a scanned asset to prioritize asset remediation. Compare Scans. |

|
The OWASP Top 10 - 2021 category based vulnerability statistics displayed on the chart. See OWASP Category. |

|
The SANS category based vulnerability statistics displayed on the chart. See Top SANS Risks. |
|
|
Displays the vulnerability scans in progress with the status and the vulnerabilities detected. |
