
Dashboard
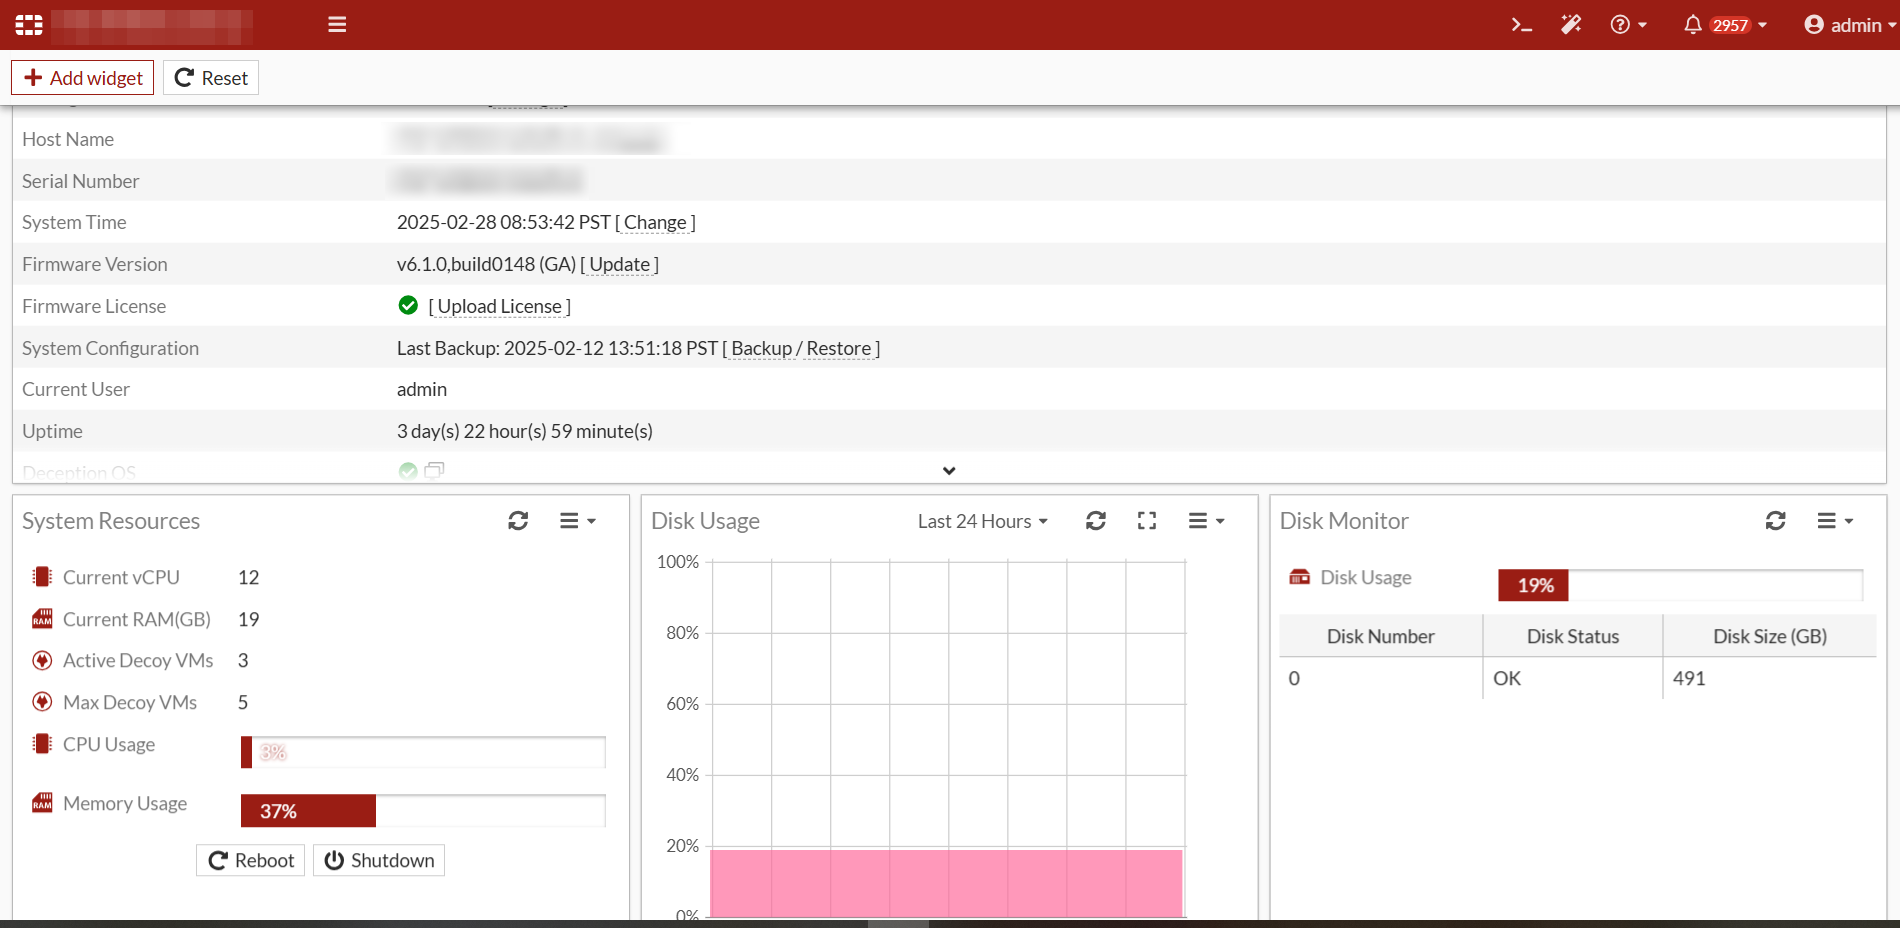
The Dashboard contains system information widgets that allow you to monitor the performance of the FortiDeceptor. The Dashboard also includes widgets that provide an overview of incidents and events over the last 24 hours to 7 days. You can customize the Dashboard by adding and removing widgets.
The following widgets are available:
| Widget | Description |
|---|---|
|
System Resources |
Hardware requirements benchmark for FortiDeceptor Virtual appliances only. This widget provides real-time guidelines for system performance and increasing vCPU & RAM resources during deployment and ongoing maintenance. The widget also provides the overall Real-time usage status of the CPU and memory. |
|
System Information |
Basic information about the FortiDeceptor system, such as the serial number, system up time, and license status information. |
|
License Information |
The list of VM license keys and their expiry dates. |
|
Disk Monitor |
For hardware models:
For VM models:
|
|
Incidents by Severity |
Information about the number of incidents and events, and their level of severity. |
|
Incidents & Events Count |
Number of events occurring each day. |
|
Decoy Distribution by OS |
Number of decoys displayed as a pie-chart showing the OS such as Windows or Ubuntu. |
|
Service Distribution |
Number of decoys deployed displayed a pie-chart showing the type of service such as SSH, SAMBA, SMB, SCADA, RDP, HTTP, HTTPS, IIS (HTTP, HTTPS), or MSSQL. |
|
Incidents by Service |
Information about the number and types of incidents, such as SMB, HTTP, TCP, and so on. |
|
Top 10 Attackers by Incidents |
The top 10 attackers by the number of incidents. |
|
Top 10 Attackers by Events |
The top 10 attackers by the number of events. |
|
Global Incidents Distribution |
Displays the number of Attackers by country on a global map. |
|
Top 10 IPS attacks |
Displays the top 10 IPS attackers by the number of events. |
|
Bandwidth |
Displays Inbound and outbound bandwidth for the specific port. The most recent inbound / outbound bandwidth is also displayed. |
|
Disk Usage |
The current disk usage and the remaining available disk capacity as a percentage. |
|
Memory Usage |
The current memory usage as percentage |
|
CPU usage |
The current CPU usage as a percentage. |
|
Top Critical Logs |
Displays the critical-level logs for the selected time period. |
For information about adding widgets, see Customizing the dashboard.