Fortinet white logo
Fortinet white logo

Administration Guide

Access control of unmanageable and unknown devices

Access control of unmanageable and unknown devices

The ZTNA application gateway can determine whether a client device that does not have FortiClient installed is a mobile device that is considered unmanageable, or is not a mobile device that is considered unknown. The ZTNA application gateway tags the device as either EMS_ALL_UNMANAGEABLE_CLIENTS or EMS_ALL_UNKNOWN_CLIENTS respectively. The FortiGate WAD process achieves this by either matching device TLS fingerprints against a library or learning information from the HTTP User-Agent header if the set user-agent-detect setting is enabled.

Configuring the ZTNA access proxy and proxy policy

The EMS_ALL_UNMANAGEABLE_CLIENTS and EMS_ALL_UNKNOWN_CLIENTS tags allow for ZTNA access control of unmanageable and unknown devices using a proxy policy. The accept-unmanageable option for the empty-cert-action setting allows unmanageable clients to continue ZTNA proxy rule processing.

config firewall access-proxy
    edit <name>
        set client-cert enable
        set user-agent-detect {enable | disable}
        set empty-cert-action {accept | block | accept-unmanageable}	
     next
end

user-agent-detect {enable | disable}

Enable/disable detecting the device type by HTTP User-Agent if no client certificate is provided (default = enable).

empty-cert-action {accept | block | accept-unmanageable}

Set the action for an empty client certificate:

  • accept: accept the SSL handshake if the client certificate is empty.
  • block: block the SSL handshake if the client certificate is empty.
  • accept-unmanageable: accept the SSL handshake only if the end point is unmanageable.

The user-agent-detect and empty-cert-action settings can only be configured in the CLI.

config firewall proxy-policy
    edit <id>
        set ztna-ems-tag {EMS_ALL_UNMANAGEABLE_CLIENTS | EMS_ALL_UNKNOWN_CLIENTS}
    next
end

ztna-ems-tag {EMS_ALL_UNMANAGEABLE_CLIENTS | EMS_ALL_UNKNOWN_CLIENTS}

Set the EMS tag names:

  • EMS_ALL_UNMANAGEABLE_CLIENTS: match any device that is unmanageable.
  • EMS_ALL_UNKNOWN_CLIENTS: match any device that is not recognized.

Consider the following use cases.

  • Case 1: if a client device sends a TLS client hello in a mobile pattern, then WAD will try to match its TLS fingerprint with a WAD original library and mark it with an EMS_ALL_UNMANAGEABLE_CLIENTS tag.
  • Case 2: if WAD cannot match the TLS fingerprint with an original library but user-agent-detect is enabled (under config firewall access-proxy), WAD will try to learn the device type from client request's User-Agent header. If it matches a mobile device, then it is still marked with an EMS_ALL_UNMANAGEABLE_CLIENTS tag.
  • Case 3: if WAD cannot match the TLS fingerprint with an existing original or temporary library, or cannot learn it from User-Agent header, or user-agent-detect is disabled, then it will mark the device as EMS_ALL_UNKNOWN_CLIENTS.

In the access proxy settings, if empty-cert-action is set to accept-unmanageable, then only case 1 and 2 would go through the proxy policy. Case 3 would be denied, and a replacement message page would appear.

To configure ZTNA policy access control of unmanageable devices:
  1. Configure the client certificate actions:
    config firewall access-proxy
        edit "zt1"
            set vip "zt1"
            set client-cert enable
            set user-agent-detect enable
            set auth-portal disable
            set empty-cert-action accept
            set log-blocked-traffic disable
            set add-vhost-domain-to-dnsdb disable
            set decrypted-traffic-mirror ''
        next
    end
  2. Configure the proxy policy with the ZTNA EMS tag to control device access:
    config firewall proxy-policy
        edit 1
            set proxy access-proxy
            set access-proxy "zt1"
            set srcintf "port2" "ag2"
            set srcaddr "all"
            set dstaddr "all"
            set ztna-ems-tag "EMS_ALL_UNMANAGEABLE_CLIENTS"
        next
    end

Configuring dynamic address local tags

Like other ZTNA tags,EMS_ALL_UNMANAGEABLE_CLIENTS and EMS_ALL_UNKNOWN_CLIENTS are dynamic addresses on the FortiGate. The following diagnostic commands can be used to view local tag information:

  • diagnose firewall dynamic address: a list of unmanageable and unknown clients’ IP addresses associated with the EMS_ALL_MANAGEABLE_CLIENTS and EMS_ALL_UNKNOWN_CLIENTS dynamic addresses, respectively, is displayed.

  • diagnose user-device-store device memory list: when device detection is enabled on a FortiGate interface that has a layer 2 connection to unmanageable and unknown device clients, then a client’s device information is displayed.

To verify the list of dynamic firewall addresses in the CLI:
(vdom1) # diagnose firewall dynamic address
List all dynamic addresses:
IP dynamic addresses in VDOM vdom1(vfid: 1):
...
CMDB name: EMS_ALL_UNMANAGEABLE_CLIENTS
EMS_ALL_UNMANAGEABLE_CLIENTS: ID(101)
        ADDR(10.1.100.22)
Total IP dynamic range blocks: 1.
Total IP dynamic addresses: 1.
CMDB name: EMS_ALL_UNKNOWN_CLIENTS
EMS_ALL_UNKNOWN_CLIENTS: ID(154)
Total IP dynamic range blocks: 0.
Total IP dynamic addresses: 0.
...
To verify the client device information in the CLI:
(vdom1) # diagnose user-device-store device memory list
Record #1:
	  ...
        device_info
                ...
                'is_online' = 'true'
                'is_ems_registered' = 'false'
                'active_start_time' = '1668811449'
                'is_fortiguard_src' = 'false'
                'tags' = 'EMS_ALL_UNMANAGEABLE_CLIENTS'
                ...
        interface_info
        ...
To view the local tag information in the GUI:
  1. Go to Policy & Objects > ZTNA and select the ZTNA Tags tab.

  2. Hover over a tag to view the tooltip, which displays matched endpoints and resolved addresses.

To apply a local tag in a full ZTNA policy:
  1. Go to Policy & Objects > Proxy Policy.

  2. Click Create New, or select and edit an existing entry.

  3. In the ZTNA Tag field, click the + to add tags. The local tags appear in the IP section.
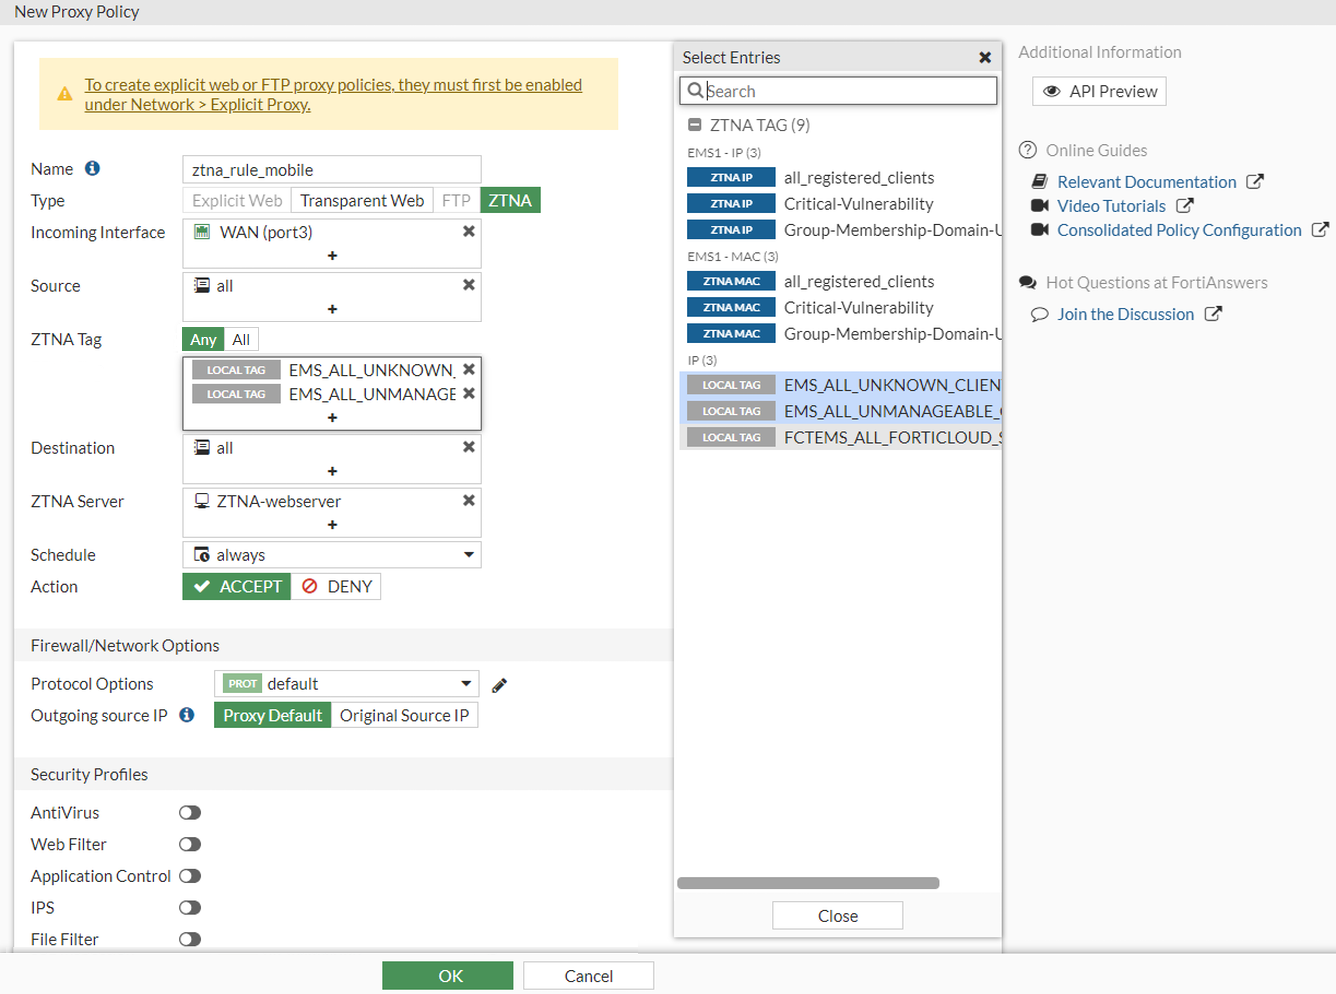
  4. Configure the other settings as needed.

  5. Click OK.

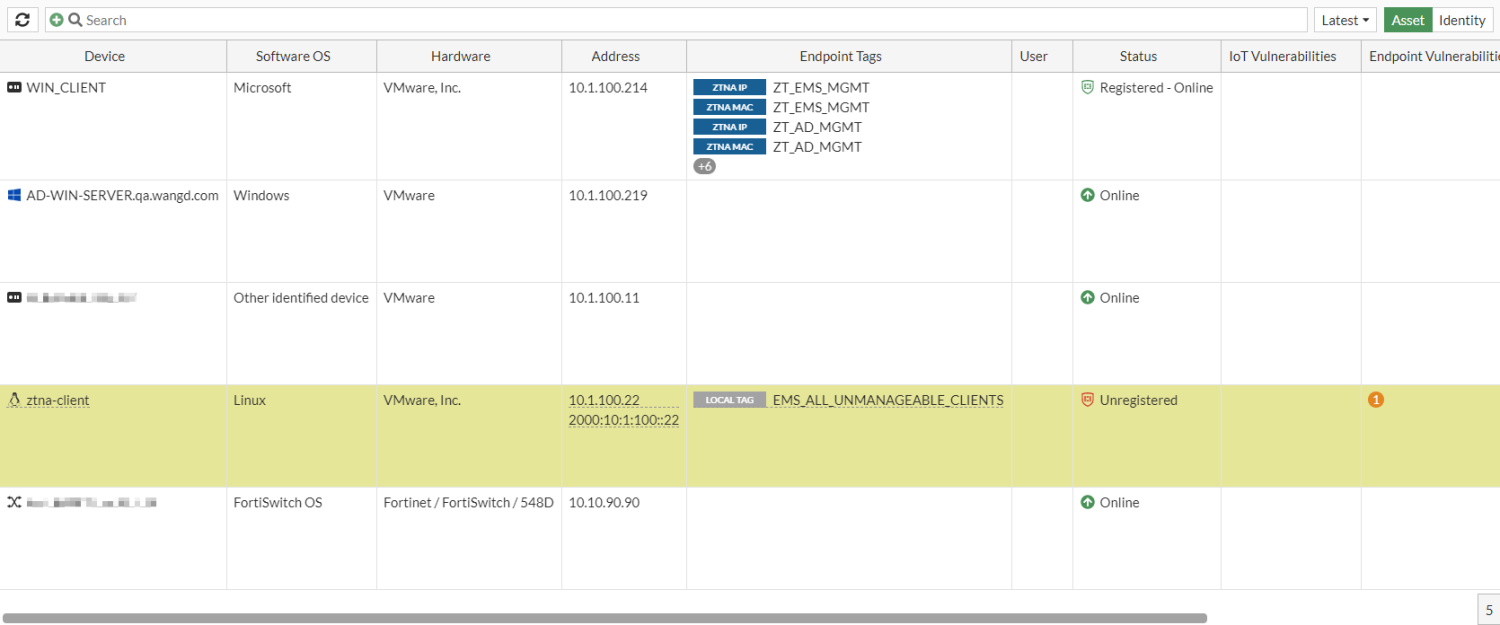
Local tag information is also available in the following GUI widgets and pages:

  • Dashboard > FortiClient widget

  • Security Fabric > Asset Identity Center page
Viewing ZTNA traffic logs

ZTNA traffic logs include the following fields related to unmanageable and unknown devices.

  • Client connection status with EMS server with possible values of unknown, offline, or online:

    • CLI = emsconnection

    • GUI = EMS Connection

  • Device manageability status with possible values of unknown, manageable, or unmanageable:

    • CLI = clientdevicemanageable

    • GUI = Client Device Manageable

The device manageability status can have one of the following values:

  • Unknown: traffic from a client with an unknown TLS fingerprint and where the user agent information is not available for learning.

  • Manageable: traffic from a non-mobile device (platform or operating system), with a known TLS fingerprint, or where the user agent information is available for learning.

  • Unmanageable: traffic from a mobile device with a known mobile TLS fingerprint or user agent information is available for learning.

To view the ZTNA traffic logs in the CLI:
(vdom1)# execute log filter category 0
(vdom1)# execute log filter field subtype ztna
(vdom1)# execute log display

1: date=2022-11-18 time=14:23:57 eventtime=1668810238188622828 tz="-0800" logid="0005000024" type="traffic" subtype="ztna" level="notice" vd="vdom1" srcip=10.1.100.22 srcport=41400 srcintf="port2" srcintfrole="undefined" dstcountry="Reserved" srccountry="Reserved" dstip=172.16.200.207 dstport=443 dstintf="port1" dstintfrole="undefined" sessionid=12147 service="HTTPS" proxyapptype="http" proto=6 action="accept" policyid=1 policytype="proxy-policy" poluuid="03a79dd2-6775-51ed-19a0-444a0314f1a0" policyname="ztna_rule_mobile" duration=0 gatewayid=1 vip="ztna_server" accessproxy="ztna_server" clientdeviceid="pf-mobile;os-unknown;app-safari" clientdevicemanageable="unmanageable" clientdevicetags="EMS_ALL_UNMANAGEABLE_CLIENTS" emsconnection="unknown" wanin=1884 rcvdbyte=1884 wanout=833 lanin=960 sentbyte=960 lanout=3046 fctuid="pf-mobile;os-unknown;app-safari" appcat="unscanned"

3: date=2022-11-18 time=14:23:52 eventtime=1668810232937847134 tz="-0800" logid="0005000024" type="traffic" subtype="ztna" level="notice" vd="vdom1" srcip=10.1.100.22 srcport=46392 srcintf="port2" srcintfrole="undefined" dstcountry="Reserved" srccountry="Reserved" dstip=172.16.200.209 dstport=443 dstintf="port1" dstintfrole="undefined" sessionid=12144 service="HTTPS" proxyapptype="http" proto=6 action="accept" policyid=2 policytype="proxy-policy" poluuid="141b7db8-6785-51ed-32a5-58d696e60e2d" duration=0 gatewayid=1 vip="ztna_server2" accessproxy="ztna_server2" clientdeviceid="pf-pc;os-unknown;app-curl" clientdevicemanageable="manageable" clientdevicetags="EMS_ALL_UNKNOWN_CLIENTS" emsconnection="unknown" wanin=1907 rcvdbyte=1907 wanout=699 lanin=861 sentbyte=861 lanout=3089 fctuid="pf-pc;os-unknown;app-curl" appcat="unscanned"

5: date=2022-11-18 time=14:23:42 eventtime=1668810222897968134 tz="-0800" logid="0005000024" type="traffic" subtype="ztna" level="notice" vd="vdom1" srcip=10.1.100.22 srcport=46390 srcintf="port2" srcintfrole="undefined" dstcountry="Reserved" srccountry="Reserved" dstip=172.18.62.68 dstport=4443 dstintf="vdom1" dstintfrole="undefined" sessionid=12134 service="tcp/4443" proxyapptype="http" proto=6 action="deny" policyid=0 policytype="proxy-policy" duration=0 vip="ztna_server2" accessproxy="ztna_server2" clientdevicemanageable="unknown" msg="Denied: failed to match a proxy-policy" wanin=0 rcvdbyte=0 wanout=0 lanin=806 sentbyte=806 lanout=2661 appcat="unscanned" crscore=30 craction=131072 crlevel="high"
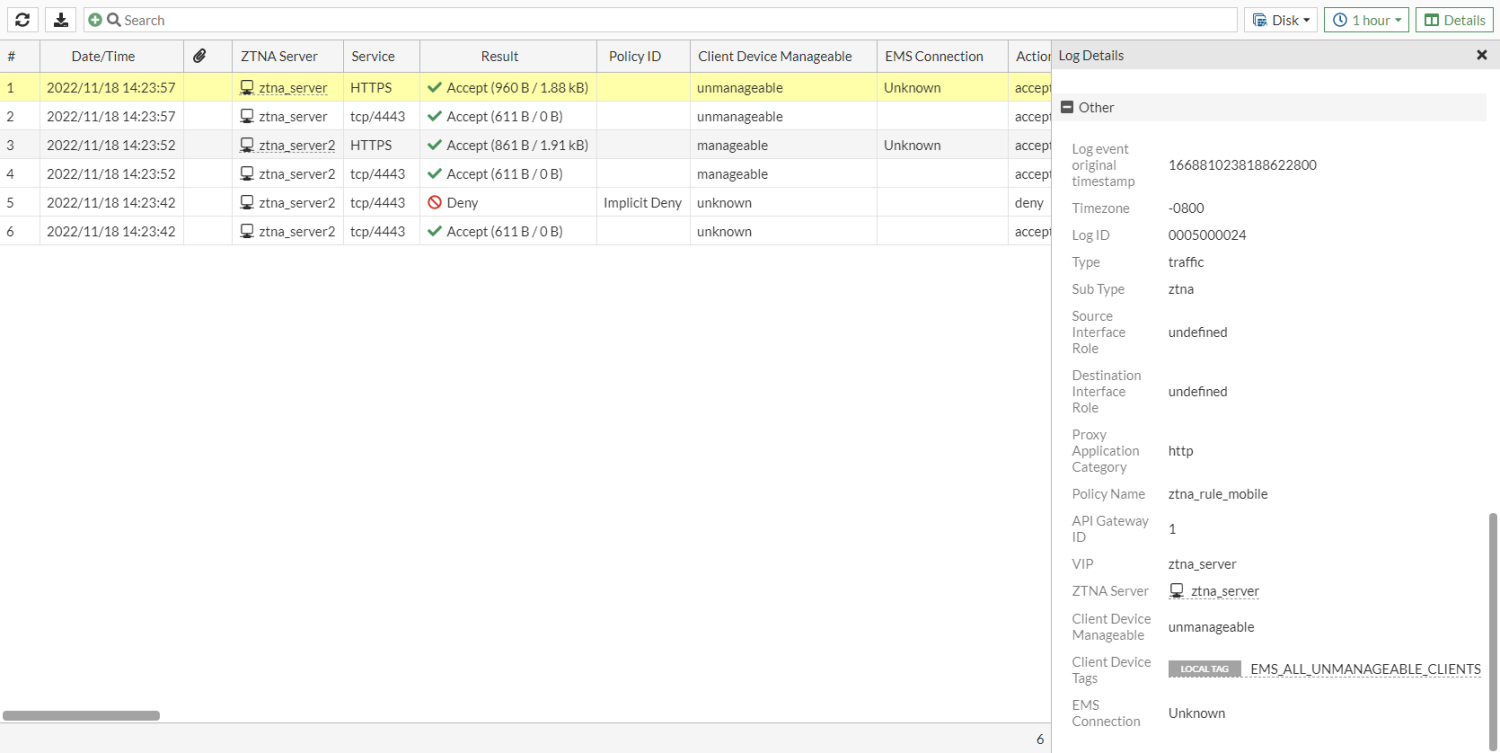
To view the ZTNA traffic logs in the GUI:
  1. Go to Log & Report > ZTNA Traffic.

  2. Select an entry and click Details.

  3. Check the Client Device Manageable and EMS Connection fields.
Access control of unmanageable and unknown devices

Access control of unmanageable and unknown devices

The ZTNA application gateway can determine whether a client device that does not have FortiClient installed is a mobile device that is considered unmanageable, or is not a mobile device that is considered unknown. The ZTNA application gateway tags the device as either EMS_ALL_UNMANAGEABLE_CLIENTS or EMS_ALL_UNKNOWN_CLIENTS respectively. The FortiGate WAD process achieves this by either matching device TLS fingerprints against a library or learning information from the HTTP User-Agent header if the set user-agent-detect setting is enabled.

Configuring the ZTNA access proxy and proxy policy

The EMS_ALL_UNMANAGEABLE_CLIENTS and EMS_ALL_UNKNOWN_CLIENTS tags allow for ZTNA access control of unmanageable and unknown devices using a proxy policy. The accept-unmanageable option for the empty-cert-action setting allows unmanageable clients to continue ZTNA proxy rule processing.

config firewall access-proxy
    edit <name>
        set client-cert enable
        set user-agent-detect {enable | disable}
        set empty-cert-action {accept | block | accept-unmanageable}	
     next
end

user-agent-detect {enable | disable}

Enable/disable detecting the device type by HTTP User-Agent if no client certificate is provided (default = enable).

empty-cert-action {accept | block | accept-unmanageable}

Set the action for an empty client certificate:

  • accept: accept the SSL handshake if the client certificate is empty.
  • block: block the SSL handshake if the client certificate is empty.
  • accept-unmanageable: accept the SSL handshake only if the end point is unmanageable.

The user-agent-detect and empty-cert-action settings can only be configured in the CLI.

config firewall proxy-policy
    edit <id>
        set ztna-ems-tag {EMS_ALL_UNMANAGEABLE_CLIENTS | EMS_ALL_UNKNOWN_CLIENTS}
    next
end

ztna-ems-tag {EMS_ALL_UNMANAGEABLE_CLIENTS | EMS_ALL_UNKNOWN_CLIENTS}

Set the EMS tag names:

  • EMS_ALL_UNMANAGEABLE_CLIENTS: match any device that is unmanageable.
  • EMS_ALL_UNKNOWN_CLIENTS: match any device that is not recognized.

Consider the following use cases.

  • Case 1: if a client device sends a TLS client hello in a mobile pattern, then WAD will try to match its TLS fingerprint with a WAD original library and mark it with an EMS_ALL_UNMANAGEABLE_CLIENTS tag.
  • Case 2: if WAD cannot match the TLS fingerprint with an original library but user-agent-detect is enabled (under config firewall access-proxy), WAD will try to learn the device type from client request's User-Agent header. If it matches a mobile device, then it is still marked with an EMS_ALL_UNMANAGEABLE_CLIENTS tag.
  • Case 3: if WAD cannot match the TLS fingerprint with an existing original or temporary library, or cannot learn it from User-Agent header, or user-agent-detect is disabled, then it will mark the device as EMS_ALL_UNKNOWN_CLIENTS.

In the access proxy settings, if empty-cert-action is set to accept-unmanageable, then only case 1 and 2 would go through the proxy policy. Case 3 would be denied, and a replacement message page would appear.

To configure ZTNA policy access control of unmanageable devices:
  1. Configure the client certificate actions:
    config firewall access-proxy
        edit "zt1"
            set vip "zt1"
            set client-cert enable
            set user-agent-detect enable
            set auth-portal disable
            set empty-cert-action accept
            set log-blocked-traffic disable
            set add-vhost-domain-to-dnsdb disable
            set decrypted-traffic-mirror ''
        next
    end
  2. Configure the proxy policy with the ZTNA EMS tag to control device access:
    config firewall proxy-policy
        edit 1
            set proxy access-proxy
            set access-proxy "zt1"
            set srcintf "port2" "ag2"
            set srcaddr "all"
            set dstaddr "all"
            set ztna-ems-tag "EMS_ALL_UNMANAGEABLE_CLIENTS"
        next
    end

Configuring dynamic address local tags

Like other ZTNA tags,EMS_ALL_UNMANAGEABLE_CLIENTS and EMS_ALL_UNKNOWN_CLIENTS are dynamic addresses on the FortiGate. The following diagnostic commands can be used to view local tag information:

  • diagnose firewall dynamic address: a list of unmanageable and unknown clients’ IP addresses associated with the EMS_ALL_MANAGEABLE_CLIENTS and EMS_ALL_UNKNOWN_CLIENTS dynamic addresses, respectively, is displayed.

  • diagnose user-device-store device memory list: when device detection is enabled on a FortiGate interface that has a layer 2 connection to unmanageable and unknown device clients, then a client’s device information is displayed.

To verify the list of dynamic firewall addresses in the CLI:
(vdom1) # diagnose firewall dynamic address
List all dynamic addresses:
IP dynamic addresses in VDOM vdom1(vfid: 1):
...
CMDB name: EMS_ALL_UNMANAGEABLE_CLIENTS
EMS_ALL_UNMANAGEABLE_CLIENTS: ID(101)
        ADDR(10.1.100.22)
Total IP dynamic range blocks: 1.
Total IP dynamic addresses: 1.
CMDB name: EMS_ALL_UNKNOWN_CLIENTS
EMS_ALL_UNKNOWN_CLIENTS: ID(154)
Total IP dynamic range blocks: 0.
Total IP dynamic addresses: 0.
...
To verify the client device information in the CLI:
(vdom1) # diagnose user-device-store device memory list
Record #1:
	  ...
        device_info
                ...
                'is_online' = 'true'
                'is_ems_registered' = 'false'
                'active_start_time' = '1668811449'
                'is_fortiguard_src' = 'false'
                'tags' = 'EMS_ALL_UNMANAGEABLE_CLIENTS'
                ...
        interface_info
        ...
To view the local tag information in the GUI:
  1. Go to Policy & Objects > ZTNA and select the ZTNA Tags tab.

  2. Hover over a tag to view the tooltip, which displays matched endpoints and resolved addresses.

To apply a local tag in a full ZTNA policy:
  1. Go to Policy & Objects > Proxy Policy.

  2. Click Create New, or select and edit an existing entry.

  3. In the ZTNA Tag field, click the + to add tags. The local tags appear in the IP section.

  4. Configure the other settings as needed.

  5. Click OK.

Local tag information is also available in the following GUI widgets and pages:

  • Dashboard > FortiClient widget

  • Security Fabric > Asset Identity Center page

Viewing ZTNA traffic logs

ZTNA traffic logs include the following fields related to unmanageable and unknown devices.

  • Client connection status with EMS server with possible values of unknown, offline, or online:

    • CLI = emsconnection

    • GUI = EMS Connection

  • Device manageability status with possible values of unknown, manageable, or unmanageable:

    • CLI = clientdevicemanageable

    • GUI = Client Device Manageable

The device manageability status can have one of the following values:

  • Unknown: traffic from a client with an unknown TLS fingerprint and where the user agent information is not available for learning.

  • Manageable: traffic from a non-mobile device (platform or operating system), with a known TLS fingerprint, or where the user agent information is available for learning.

  • Unmanageable: traffic from a mobile device with a known mobile TLS fingerprint or user agent information is available for learning.

To view the ZTNA traffic logs in the CLI:
(vdom1)# execute log filter category 0
(vdom1)# execute log filter field subtype ztna
(vdom1)# execute log display

1: date=2022-11-18 time=14:23:57 eventtime=1668810238188622828 tz="-0800" logid="0005000024" type="traffic" subtype="ztna" level="notice" vd="vdom1" srcip=10.1.100.22 srcport=41400 srcintf="port2" srcintfrole="undefined" dstcountry="Reserved" srccountry="Reserved" dstip=172.16.200.207 dstport=443 dstintf="port1" dstintfrole="undefined" sessionid=12147 service="HTTPS" proxyapptype="http" proto=6 action="accept" policyid=1 policytype="proxy-policy" poluuid="03a79dd2-6775-51ed-19a0-444a0314f1a0" policyname="ztna_rule_mobile" duration=0 gatewayid=1 vip="ztna_server" accessproxy="ztna_server" clientdeviceid="pf-mobile;os-unknown;app-safari" clientdevicemanageable="unmanageable" clientdevicetags="EMS_ALL_UNMANAGEABLE_CLIENTS" emsconnection="unknown" wanin=1884 rcvdbyte=1884 wanout=833 lanin=960 sentbyte=960 lanout=3046 fctuid="pf-mobile;os-unknown;app-safari" appcat="unscanned"

3: date=2022-11-18 time=14:23:52 eventtime=1668810232937847134 tz="-0800" logid="0005000024" type="traffic" subtype="ztna" level="notice" vd="vdom1" srcip=10.1.100.22 srcport=46392 srcintf="port2" srcintfrole="undefined" dstcountry="Reserved" srccountry="Reserved" dstip=172.16.200.209 dstport=443 dstintf="port1" dstintfrole="undefined" sessionid=12144 service="HTTPS" proxyapptype="http" proto=6 action="accept" policyid=2 policytype="proxy-policy" poluuid="141b7db8-6785-51ed-32a5-58d696e60e2d" duration=0 gatewayid=1 vip="ztna_server2" accessproxy="ztna_server2" clientdeviceid="pf-pc;os-unknown;app-curl" clientdevicemanageable="manageable" clientdevicetags="EMS_ALL_UNKNOWN_CLIENTS" emsconnection="unknown" wanin=1907 rcvdbyte=1907 wanout=699 lanin=861 sentbyte=861 lanout=3089 fctuid="pf-pc;os-unknown;app-curl" appcat="unscanned"

5: date=2022-11-18 time=14:23:42 eventtime=1668810222897968134 tz="-0800" logid="0005000024" type="traffic" subtype="ztna" level="notice" vd="vdom1" srcip=10.1.100.22 srcport=46390 srcintf="port2" srcintfrole="undefined" dstcountry="Reserved" srccountry="Reserved" dstip=172.18.62.68 dstport=4443 dstintf="vdom1" dstintfrole="undefined" sessionid=12134 service="tcp/4443" proxyapptype="http" proto=6 action="deny" policyid=0 policytype="proxy-policy" duration=0 vip="ztna_server2" accessproxy="ztna_server2" clientdevicemanageable="unknown" msg="Denied: failed to match a proxy-policy" wanin=0 rcvdbyte=0 wanout=0 lanin=806 sentbyte=806 lanout=2661 appcat="unscanned" crscore=30 craction=131072 crlevel="high"
To view the ZTNA traffic logs in the GUI:
  1. Go to Log & Report > ZTNA Traffic.

  2. Select an entry and click Details.

  3. Check the Client Device Manageable and EMS Connection fields.