
Passive monitoring of TCP metrics NEW
FortiGate can now perform passive monitoring of TCP metrics by measuring and logging the following for each TCP session:
-
Network response time
-
Server response time
-
Original retransmits
-
Reply retransmits
-
SYN retransmits
-
SYN-ACK retransmits
-
Original or reply resets
Passive monitoring of TCP sessions is configured in firewall policies with the SD-WAN zone as the destination interface using the following CLI command:
config firewall policy
    edit <entry>
        set app-monitor {enable | disable}
    next
end
When set app-monitor is enabled in a firewall policy, NPU offloading for the firewall policy is automatically disabled.
The following metrics for each TCP session are logged:
|
tcpnrt
|
Represents TCP Network Response Time and the time between
|
|
tcpsrt
|
Represents TCP Server Response Time and the time between SYN to SYN_ACK in milliseconds. |
| tcporgrtrs | Represents TCP Original Retransmit and the number of retransmissions in the original direction. |
| tcprplrtrs | Represents TCP Reply Retransmit and the number of retransmissions in the reply direction. |
| tcpsynrtrs | Represents TCP SYN Retransmit and number of SYN retransmissions. |
|
tcpsynackrtrs |
Represents TCP SYN ACK Retransmit and number of |
|
tcprst |
Represents TCP Reset and values are |
This feature helps monitor performance of TCP traffic and locate potential network issues. You can display TCP metrics using the diagnose sys session list command, or you can view traffic logs in either the CLI or the GUI.
SD-WAN traffic steering remains independent from the measured TCP session metrics.
Example
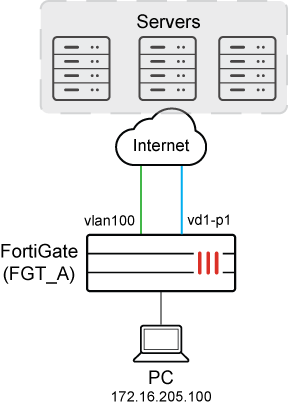
In this example, SD-WAN is configured with a zone named virtual-wan-link, and it contains two members (vlan100 and vd1-p1). A firewall policy is configured for the SD-WAN zone to passively monitor TCP metrics from the PC to a server.
To configure SD-WAN:
-
Configure SD-WAN:
config system sdwan set status enable config zone edit "virtual-wan-link" next end config members edit 1 set interface "vd1-p1" next edit 2 set interface "vlan100" set gateway 172.16.206.2 next end config service edit 1 set name "1" set dst "all" set src "172.16.205.0" set priority-members 1 2 next end end -
Identify the preferred interface:
In this example
vd1-p1is the preferred SD-WAN member.# diagnose sys sdwan service4 Service(1): Address Mode(IPV4) flags=0x4200 use-shortcut-sla use-shortcut Tie break: cfg Shortcut priority: 2 Gen(1), TOS(0x0/0x0), Protocol(0): src(1->65535):dst(1->65535), Mode(manual) Members(2): 1: Seq_num(1 vd1-p1 virtual-wan-link), alive, selected 2: Seq_num(2 vlan100 virtual-wan-link), alive, selected Src address(1): 172.16.205.0-172.16.205.255 Dst address(1): 0.0.0.0-255.255.255.255 -
Configure a firewall policy for the SD-WAN zone to monitor traffic from the PC:
In this example, the
dstintfoption is set to the SD-WAN zone (virtual-wan-link), thesrcaddroption identifies the PC (172.16.205.0), and passive monitoring and logging of TCP metrics is enabled.config firewall policy edit 1 set name "TCP-Metrics" set srcintf "any" set dstintf "virtual-wan-link" set action accept set srcaddr "172.16.205.0" set dstaddr "all" set schedule "always" set service "ALL" set app-monitor enable set utm-status enable set ssl-ssh-profile "certificate-inspection" set application-list "g-default" set logtraffic all set auto-asic-offload disable next end -
As traffic passes from the PC through FortiGate to the server, TCP traffic is measured and logged, and you can view the results:
-
View a session list:
# diagnose sys session list

session info: proto=6 proto_state=11 duration=172 expire=3577 timeout=3600 refresh_dir=both flags=00000000 socktype=0 sockport=0 av_idx=0 use=3
origin-shaper=
reply-shaper=
per_ip_shaper=
class_id=0 ha_id=0 policy_dir=0 tunnel=/ tun_id=172.16.209.2/0.0.0.0 vlan_cos=0/255
state=log may_dirty f00 f02 app_valid
statistic(bytes/packets/allow_err): org=59961/864/1 reply=2663311/2103/1 tuples=2
tx speed(Bps/kbps): 2/0 rx speed(Bps/kbps): 3/0
orgin->sink: org pre->post, reply pre->post dev=15->115/115->15 gwy=172.16.209.2/172.16.205.100
hook=pre dir=org act=noop 172.16.205.100:51128->172.16.202.2:22(0.0.0.0:0)
hook=post dir=reply act=noop 172.16.202.2:22->172.16.205.100:51128(0.0.0.0:0)
pos/(before,after) 0/(0,0), 0/(0,0)
misc=0 policy_id=1 pol_uuid_idx=843 auth_info=0 chk_client_info=0 vd=0
serial=00006eb8 tos=ff/ff app_list=6000 app=16060 url_cat=0
sdwan_mbr_seq=1 sdwan_service_id=1
rpdb_link_id=ff000001 ngfwid=n/a
tcp_srt=240 tcp_nrt=0 tcp_org_rtrs=17 tcp_rpl_rtrs=273 tcp_syn_rtrs=0 tcp_syn_ack_rtrs=0 tcp_rst=00
npu_state=0x1041001 no_offload
no_ofld_reason:  disabled-by-policy non-npu-intf
total session: 1
-
View metrics for TCP sessions in the logs:
# execute log display

1: date=2024-11-27 time=09:16:16 eventtime=1732655776116103929 tz="+1200" logid="0000000020" type="traffic" subtype="forward" level="notice" vd="root" srcip=172.16.205.100 srcport=51128 srcintf="port5" srcintfrole="undefined" dstip=172.16.202.2 dstport=22 dstintf="vd1-p1" dstintfrole="wan" srccountry="Reserved" dstcountry="Reserved" sessionid=28344 proto=6 action="accept" policyid=1 policytype="policy" poluuid="ba9c4c14-85b8-51ef-6644-c7ff3d55c4ce" policyname="TCP-Metrics" service="SSH" trandisp="noop" appid=16060 app="SSH" appcat="Network.Service" apprisk="elevated" applist="g-default" duration=149 sentbyte=59857 rcvdbyte=2663123 sentpkt=863 rcvdpkt=2101 vpntype="ipsecvpn" vwlid=1 vwlquality="Seq_num(1 vd1-p1 virtual-wan-link), alive, selected" vwlname="1" tcpnrt=0 tcpsrt=240 tcporgrtrs=17 tcprplrtrs=273 tcpsynrtrs=0 tcpsynackrtrs=0 tcprst="none" sentdelta=59857 rcvddelta=2663123 durationdelta=149 sentpktdelta=863 rcvdpktdelta=2101
-