
Adding FortiTelemetry monitors
This topic applies only to a FortiGate acting as a FortiTelemetry Controller with FortiTelemetry enabled on the System > Feature Visibility page. For a summary of FortiTelemetry-related tasks that you can do in FortiOS, see FortiTelemetry. See also FortiTelemetry Administration Guide.
Add FortiTelemetry monitors to view and monitor data collected by the agents and analyzed by FortiTelemetry Cloud. After FortiTelemetry Cloud analyzes the data, it returns to the FortiTelemetry Controller an application experience score and an application failure rate, which you can view in the FortiTelemetry monitor.
To add a FortiTelemetry monitor:
-
In the tree menu, under the monitors section, click + (Add Monitor). The Add Monitor window opens.
-
Under Security Fabric, click + (Add) next to FortiTelemetry. The Add FortiTelemetry as Standalone Dashboard pane opens.
-
Set the following options, and click OK to add the monitor:
Name
Type a name for the monitor.
FortiGate
Select the FortiGate acting as the FortiTelemetry Controller.
Source
Select one of the following sources:
-
Application
-
Agent
-
Source interface
-
Destination interface
-
Profile
-
Policy
Time period
Select a time range for the data:
-
1 hour
-
24 hours
-
7 days
Sort by
Select how to sort the monitored data.
-
To view FortiTelemetry data:
-
Under Dashboard, click the FortiTelemetry monitor that you added.
-
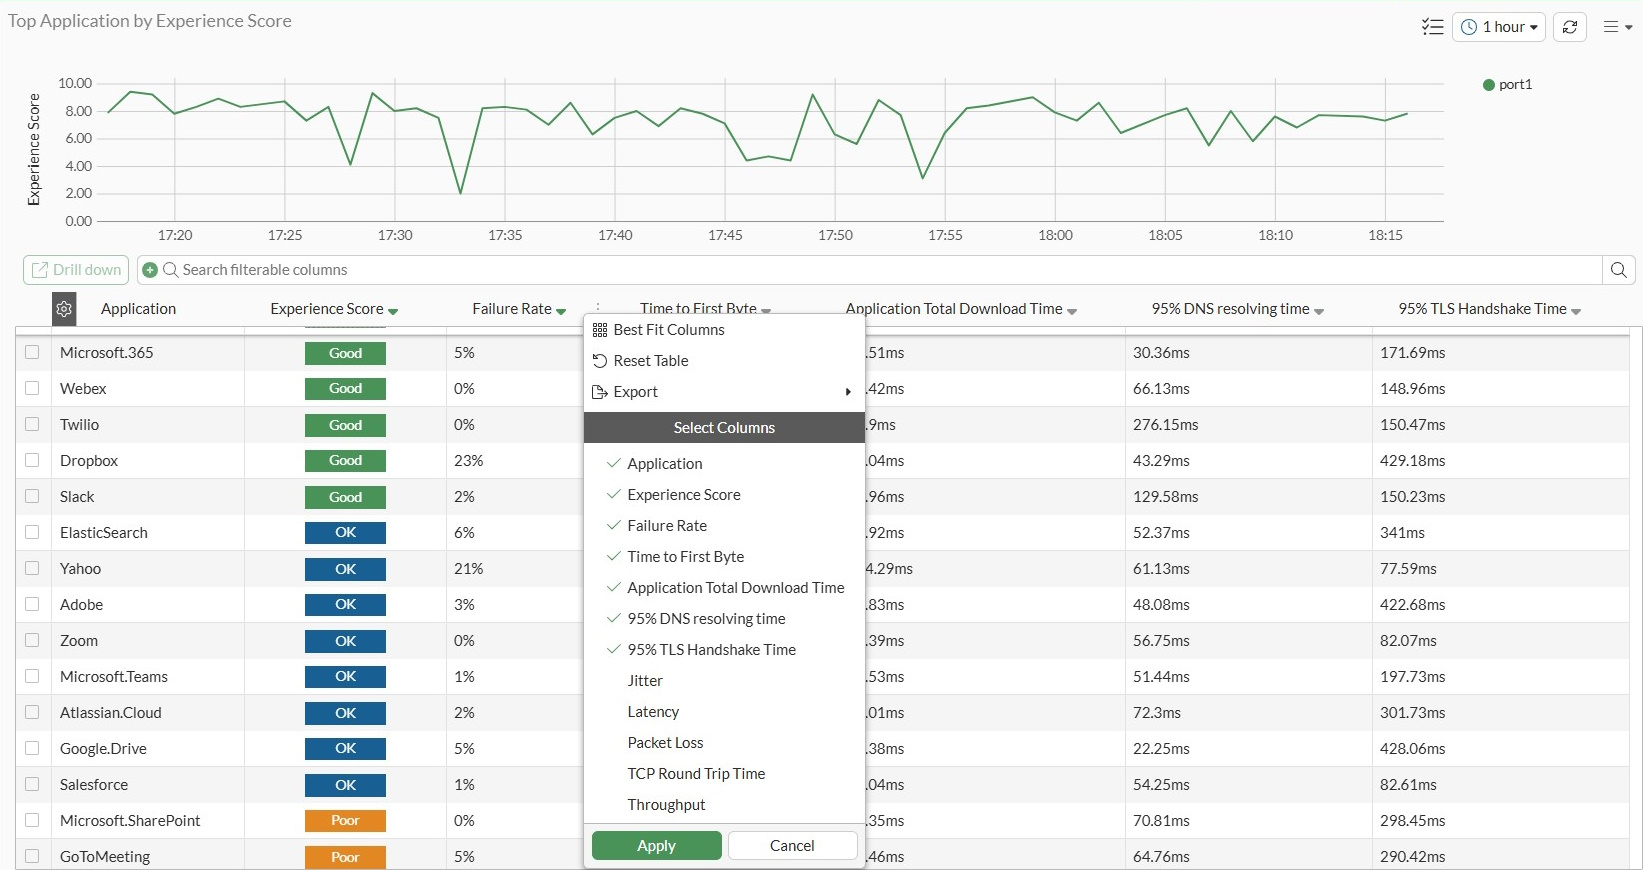
Click the gear icon to customize what columns display:
-
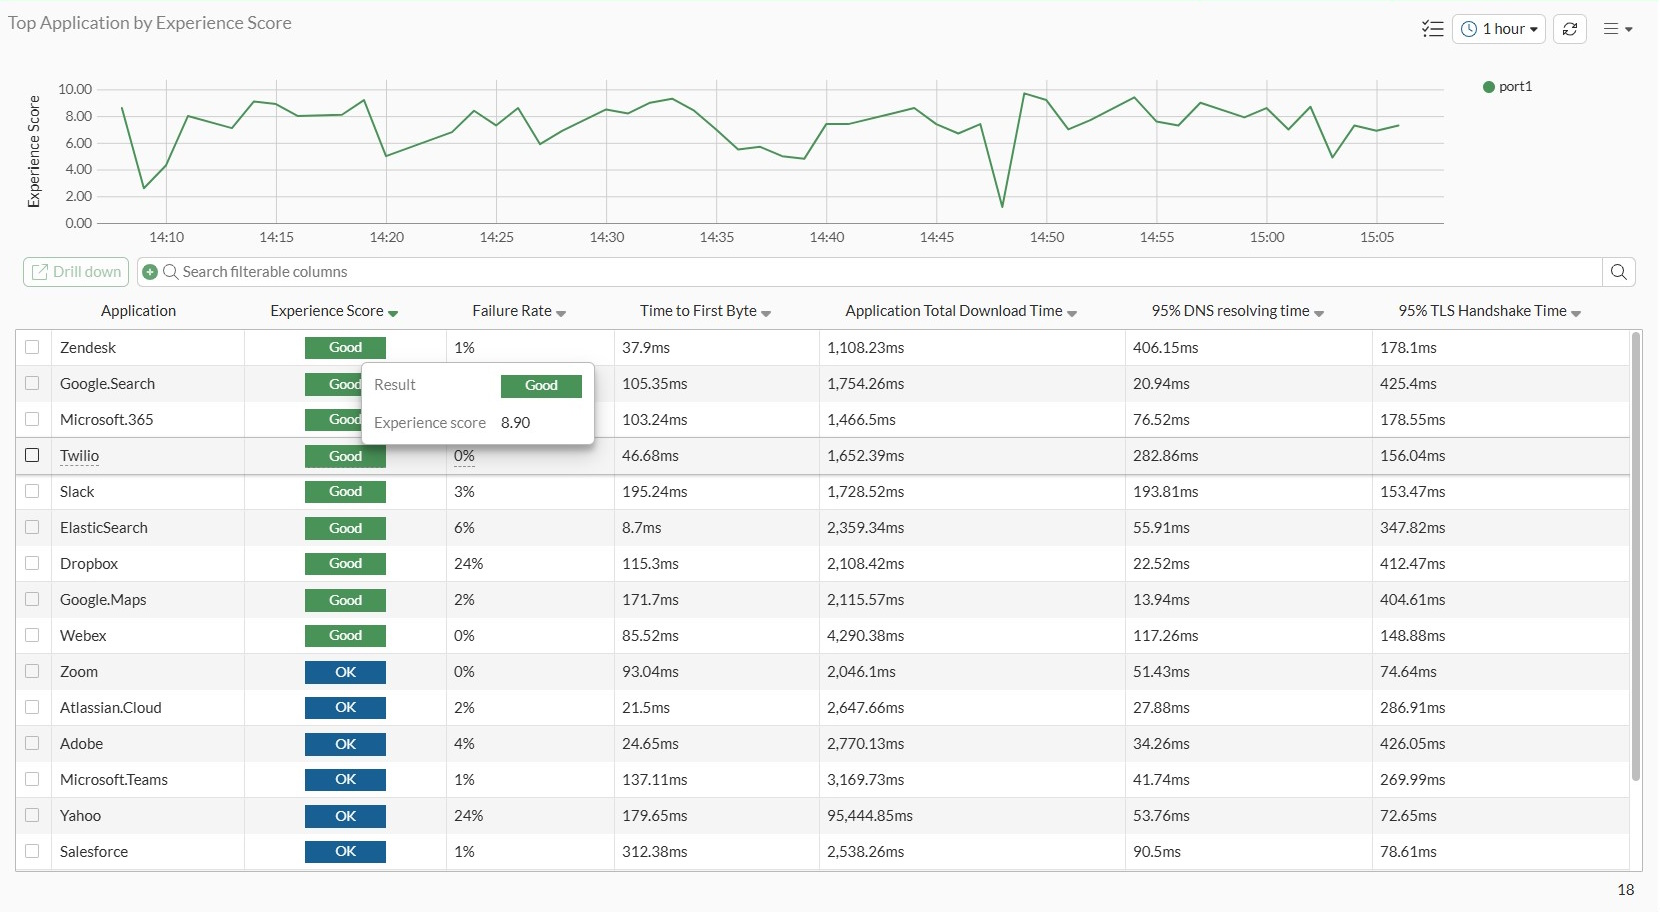
Hover over the Experience Score rating to view the experience score for each application:
-
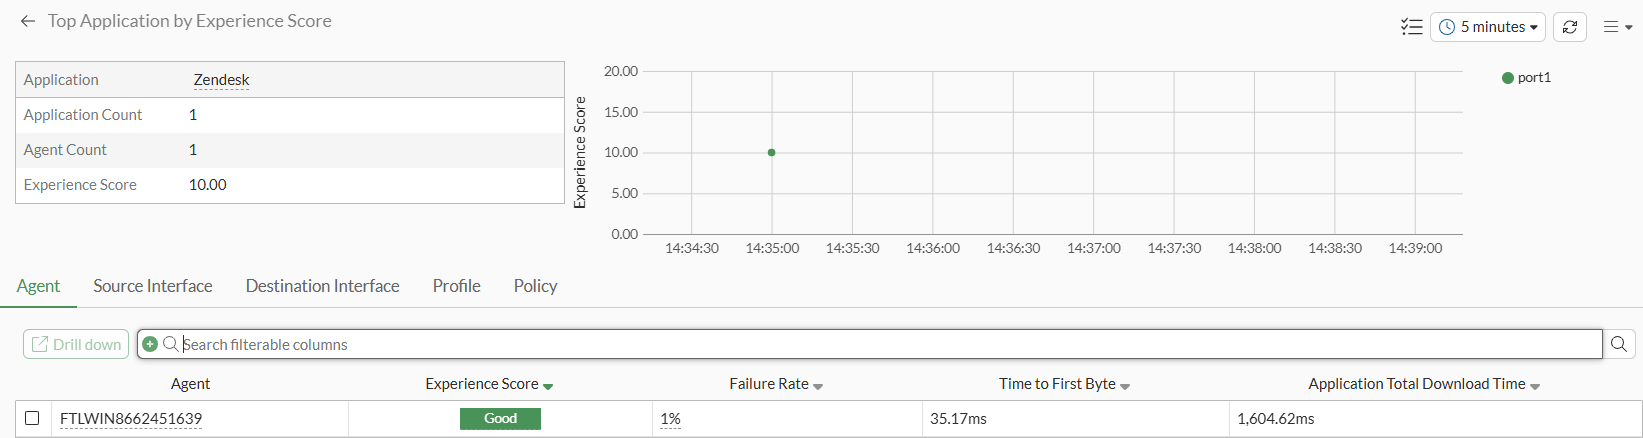
Select the application row in the table to display a Drill Down button, and click Drill Down to view details about the agent on the Agent tab:
-
You can continue drilling down to additional details. For example, select the agent to display a Drill Down button, and click Drill Down to view details about the destination interface on the Destination Interface tab, and so on.