


Physical Topology
The physical topology view shows the devices in the Security Fabric and the devices they are connected to. You can also select whether or not to view access layer devices in this topology. To see the physical topology, in FortiManager GUI, select Fabric View > Physical Topology.
From the dropdown list beside the search bar, select one of the following views:
- Device Traffic: organize devices by traffic.
- Device Count: organize devices by the number of devices connected to it.
- Device Operating System: organize devices by operating system.
- Device Hardware Vendor: organize devices by hardware vendor.
- Risk: only include devices that have endpoints with medium, high, or critical risk values of the specified type: All, Compromised Host, Vulnerability, or Threat Score.
- No Devices: do not show endpoints.

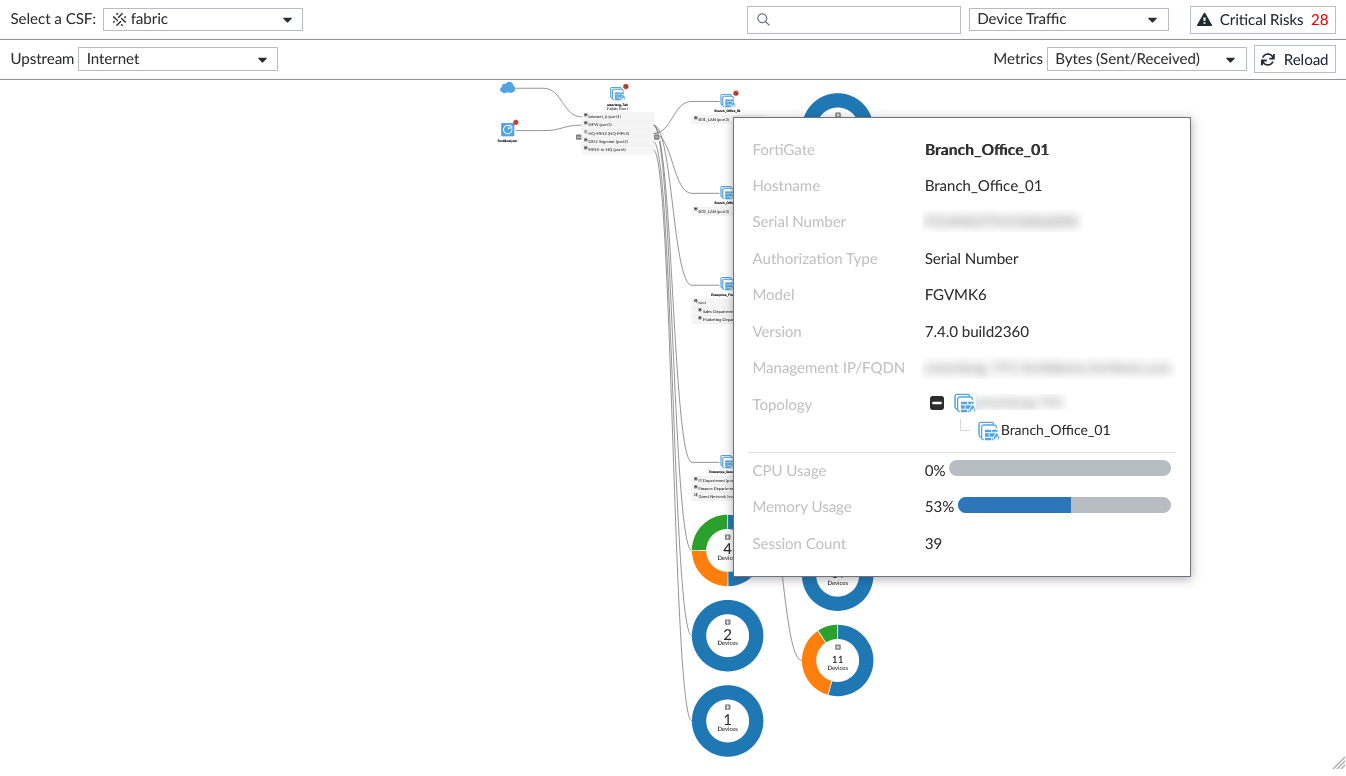
The physical topology view displays your network as a chart of interconnected devices. These devices are grouped based on the upstream device they are connected to. You can click a device in the topology to view additional information.
The following fields are displayed in when viewing device information:
-
FortiGate: hostname, serial number, model, version, and management IP.
-
FortiAnalyzer: hostname, version, IP address, and model.
-
FortiSwitch: label, serial number, and version.
-
Device: name, IP address, hostname, MAC, interfaces, online interfaces, hardware type, hardware vendor, OS, and user.
Security Fabric Rating recommendations are also shown in the topology, beside the icon of the device the recommendations apply to. Click the icon to view the rating report.