
Version 25.3.b
New functionality
Mutes and Excludes page
A new Mutes and Excludes page has been added to the main settings menu. This page summarizes all muted and excluded devices, including device-level mutes for detectors. It contains three tabs: Mutes, Excludes and Subnets.
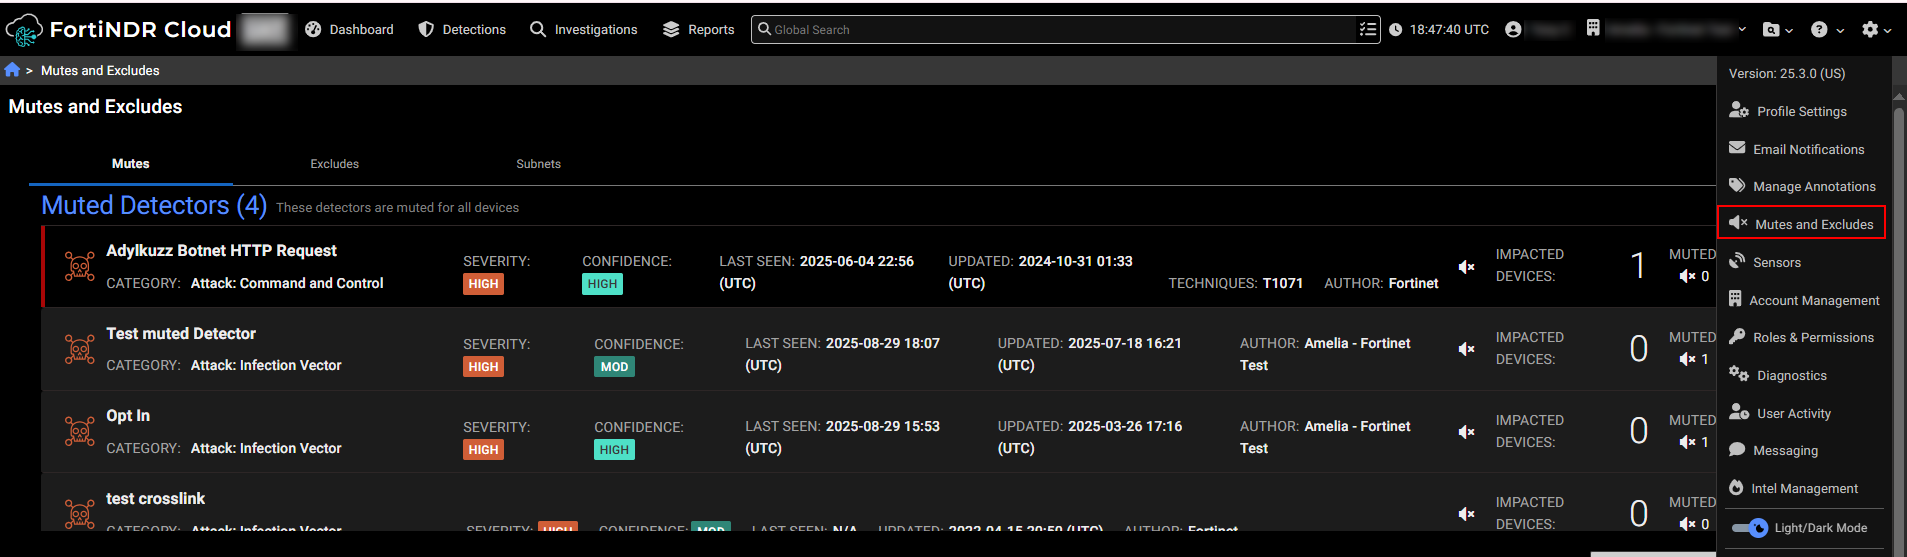
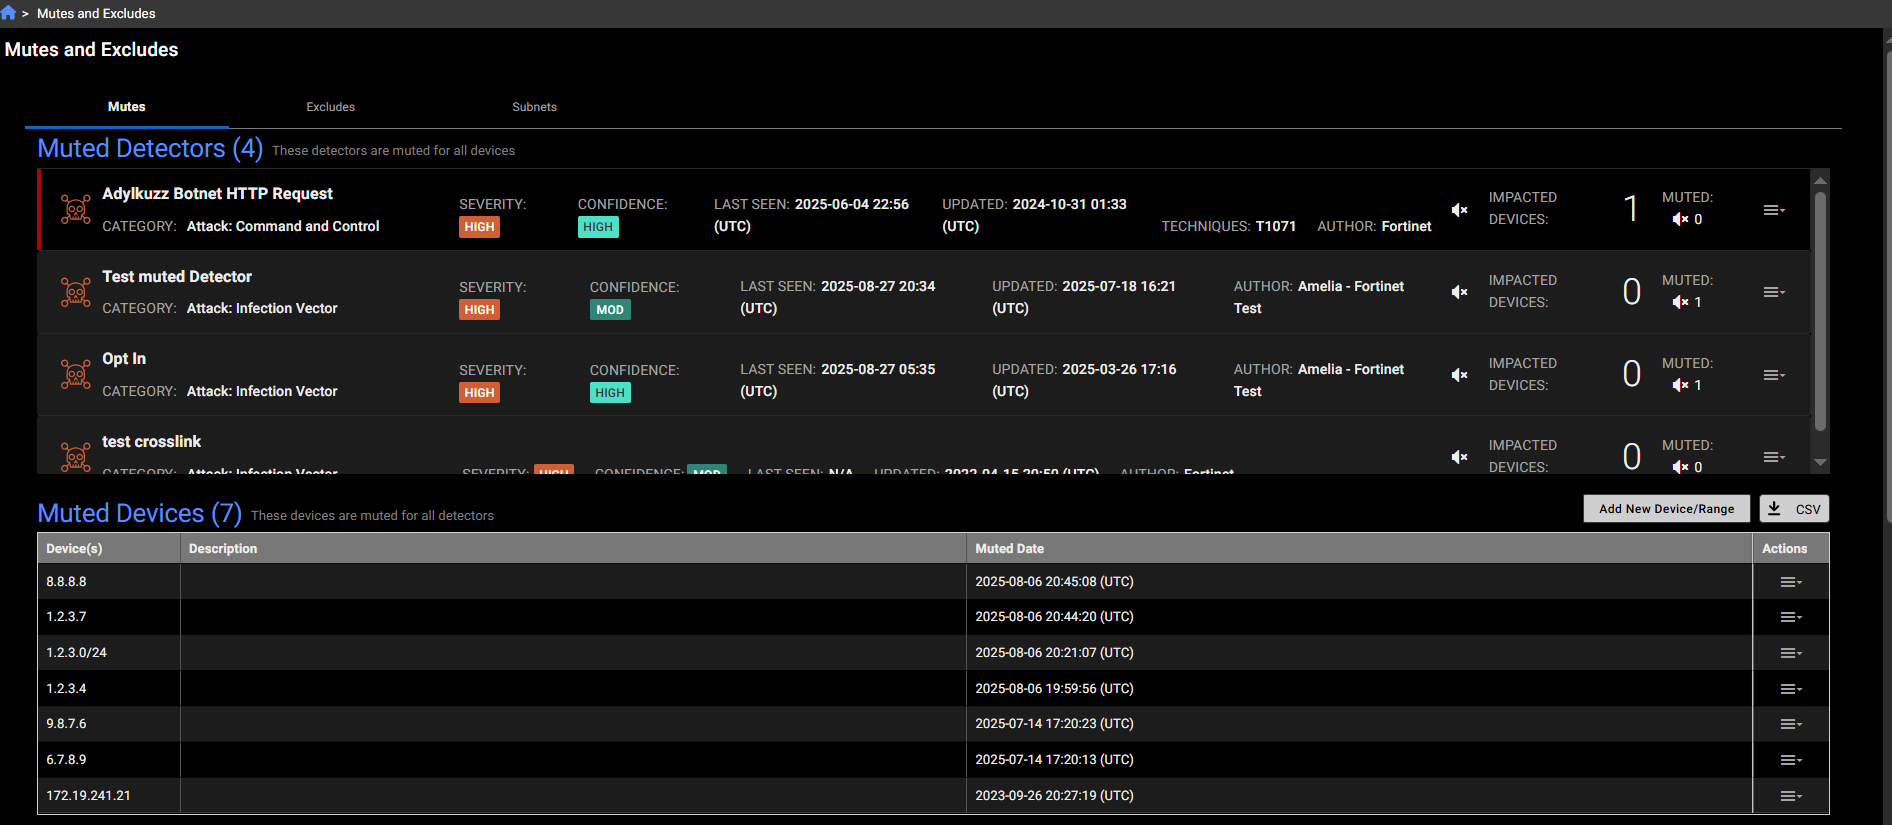
Mutes tab
The Mutes tab shows Muted Detectors (detectors that are muted); Muted Devices (Devices that have muted all detectors); Muted Devices for Detectors(Devices that are muted for specific detectors); and Muted Detections (The detection is muted or impacted device is muted for the whole account or for a specific detector).
You can use this table to add a muted device for the whole account, unmute or edit existing muted devices, add or update a muted device for a specific detector.
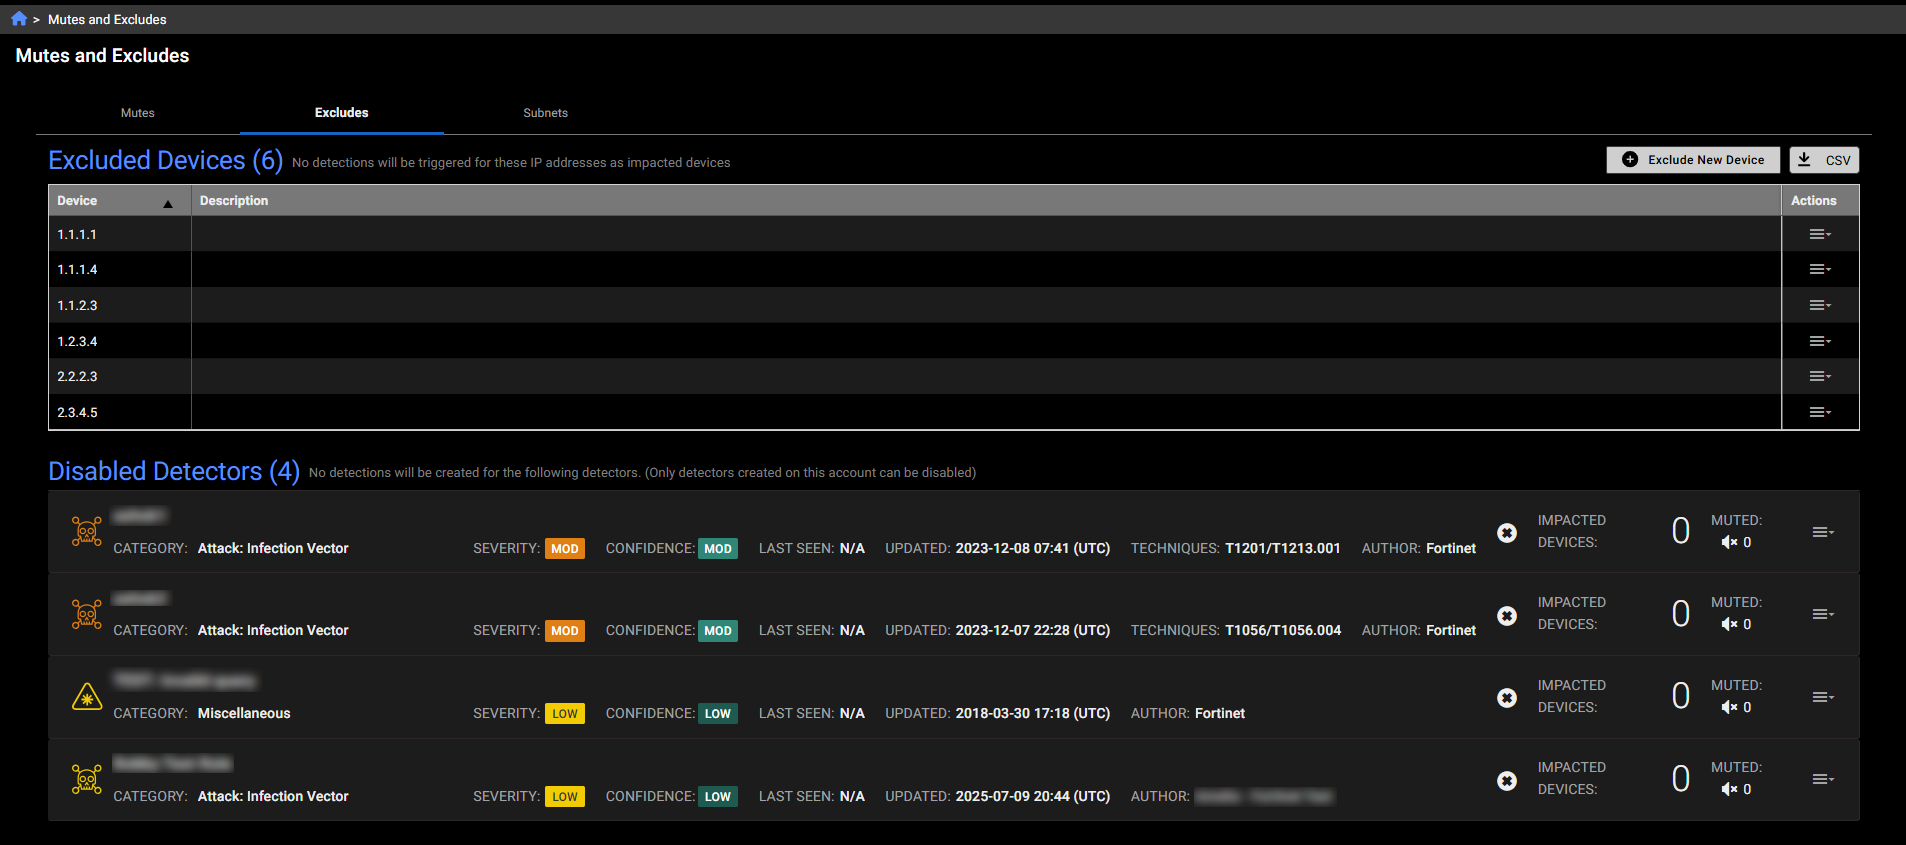
Excludes tab
This tab shows devices that are excluded at the account level, meaning no detections will be triggered for them. It also includes disabled detectors.
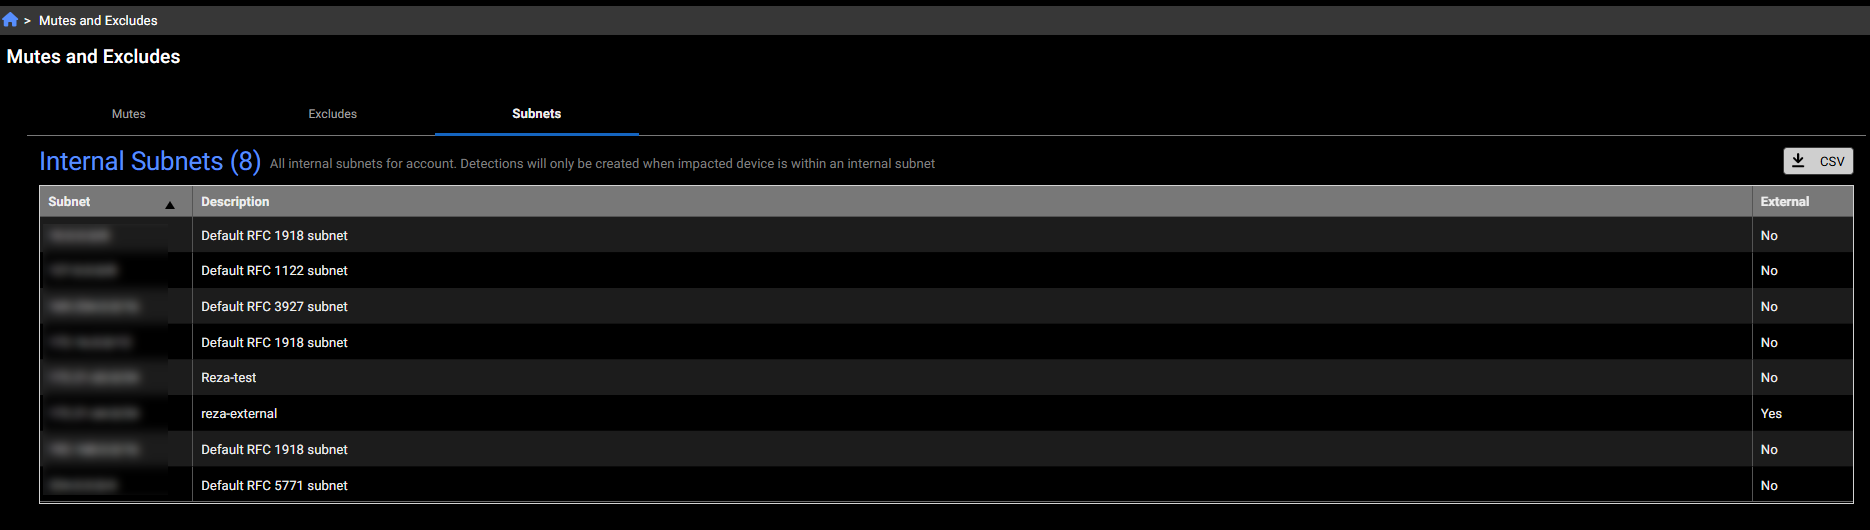
Subnets tab
This tab displays all internal subnets for the account. Detections will only be created when the impacted device is within an internal subnet
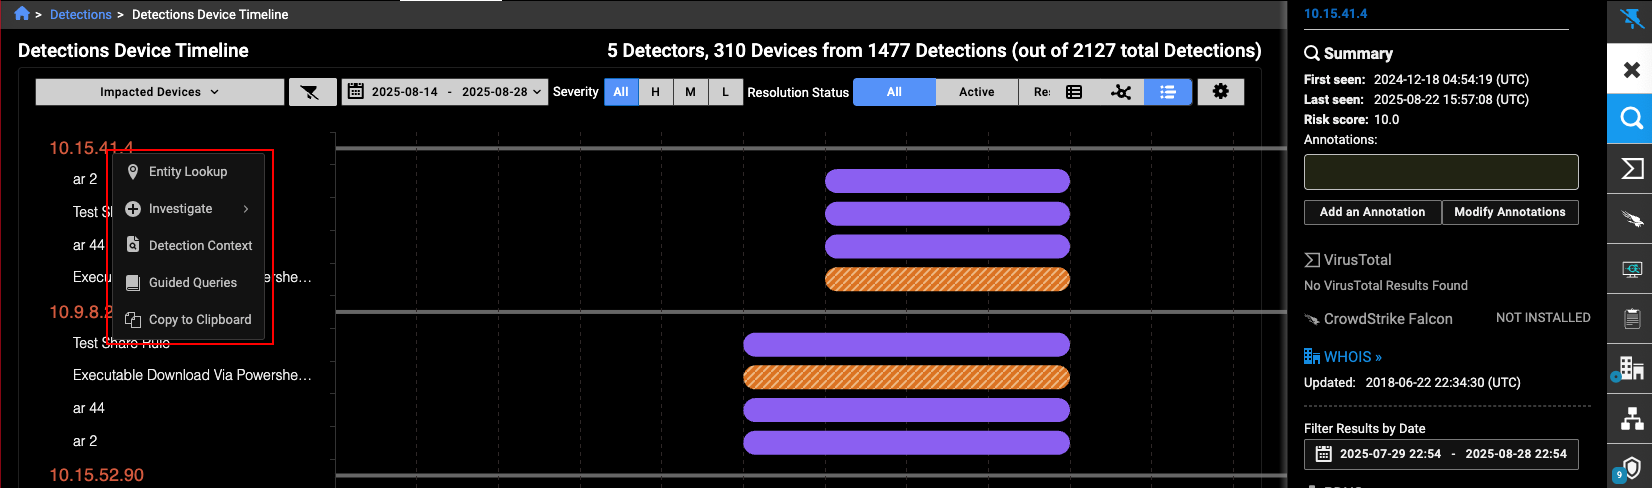
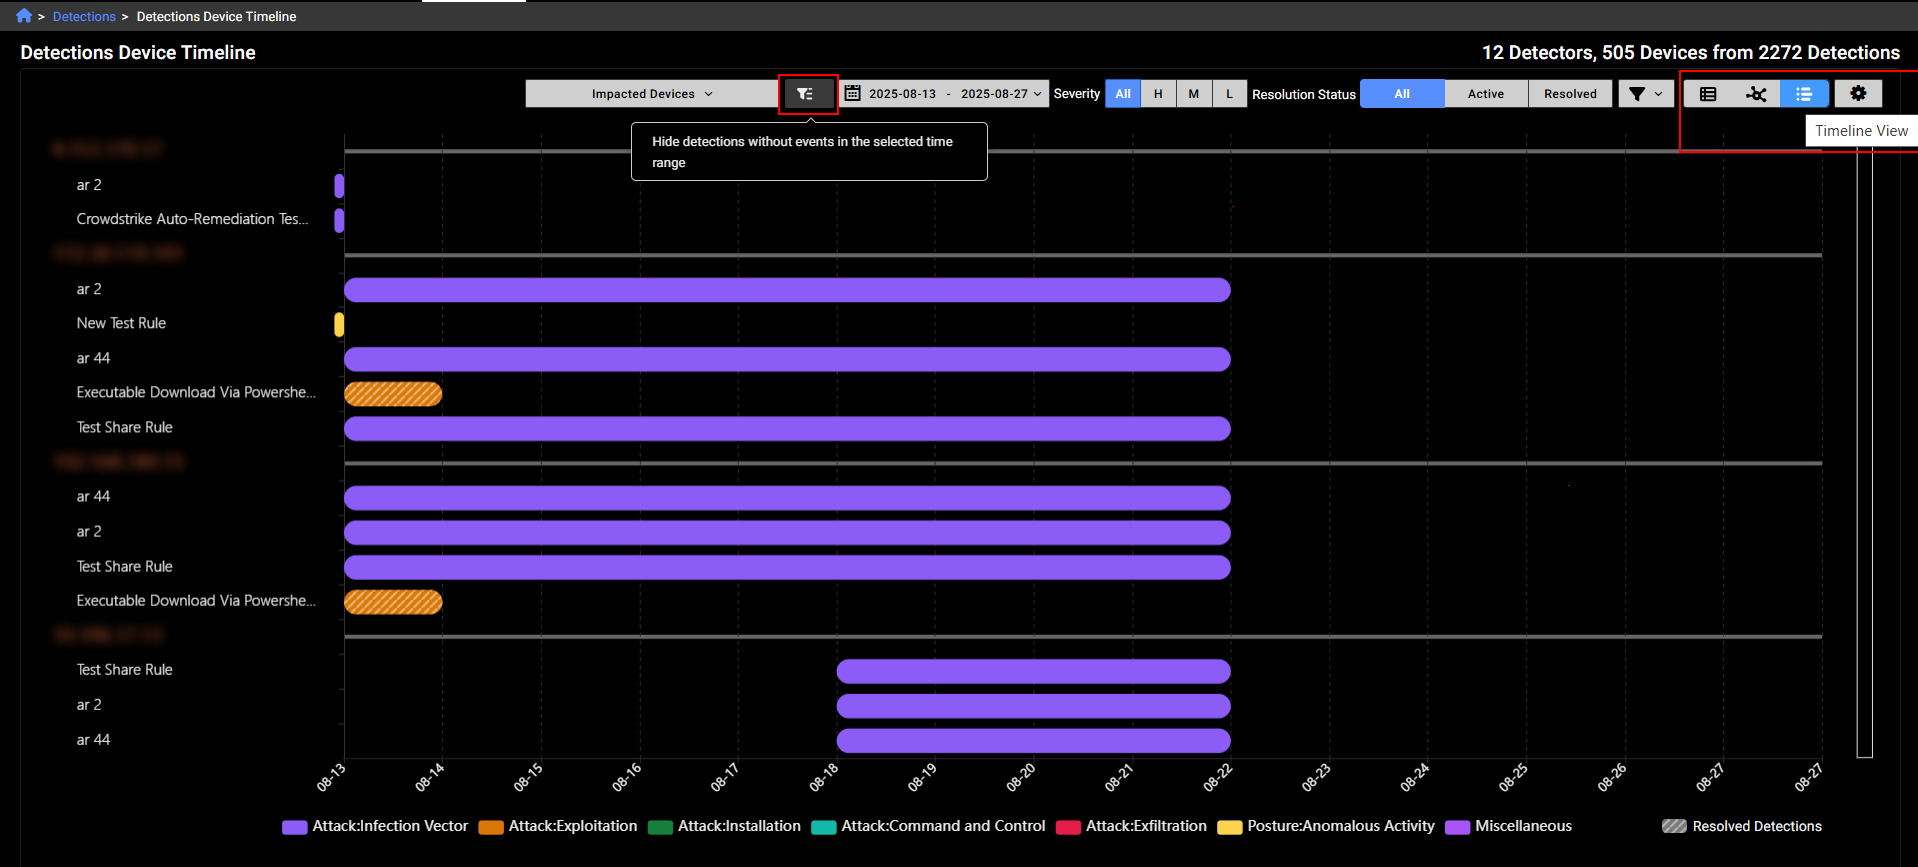
Detections Device Timeline
We have added a new view called Detections Device Timeline to Detections. This view shows all detections sorted by the device risk score.
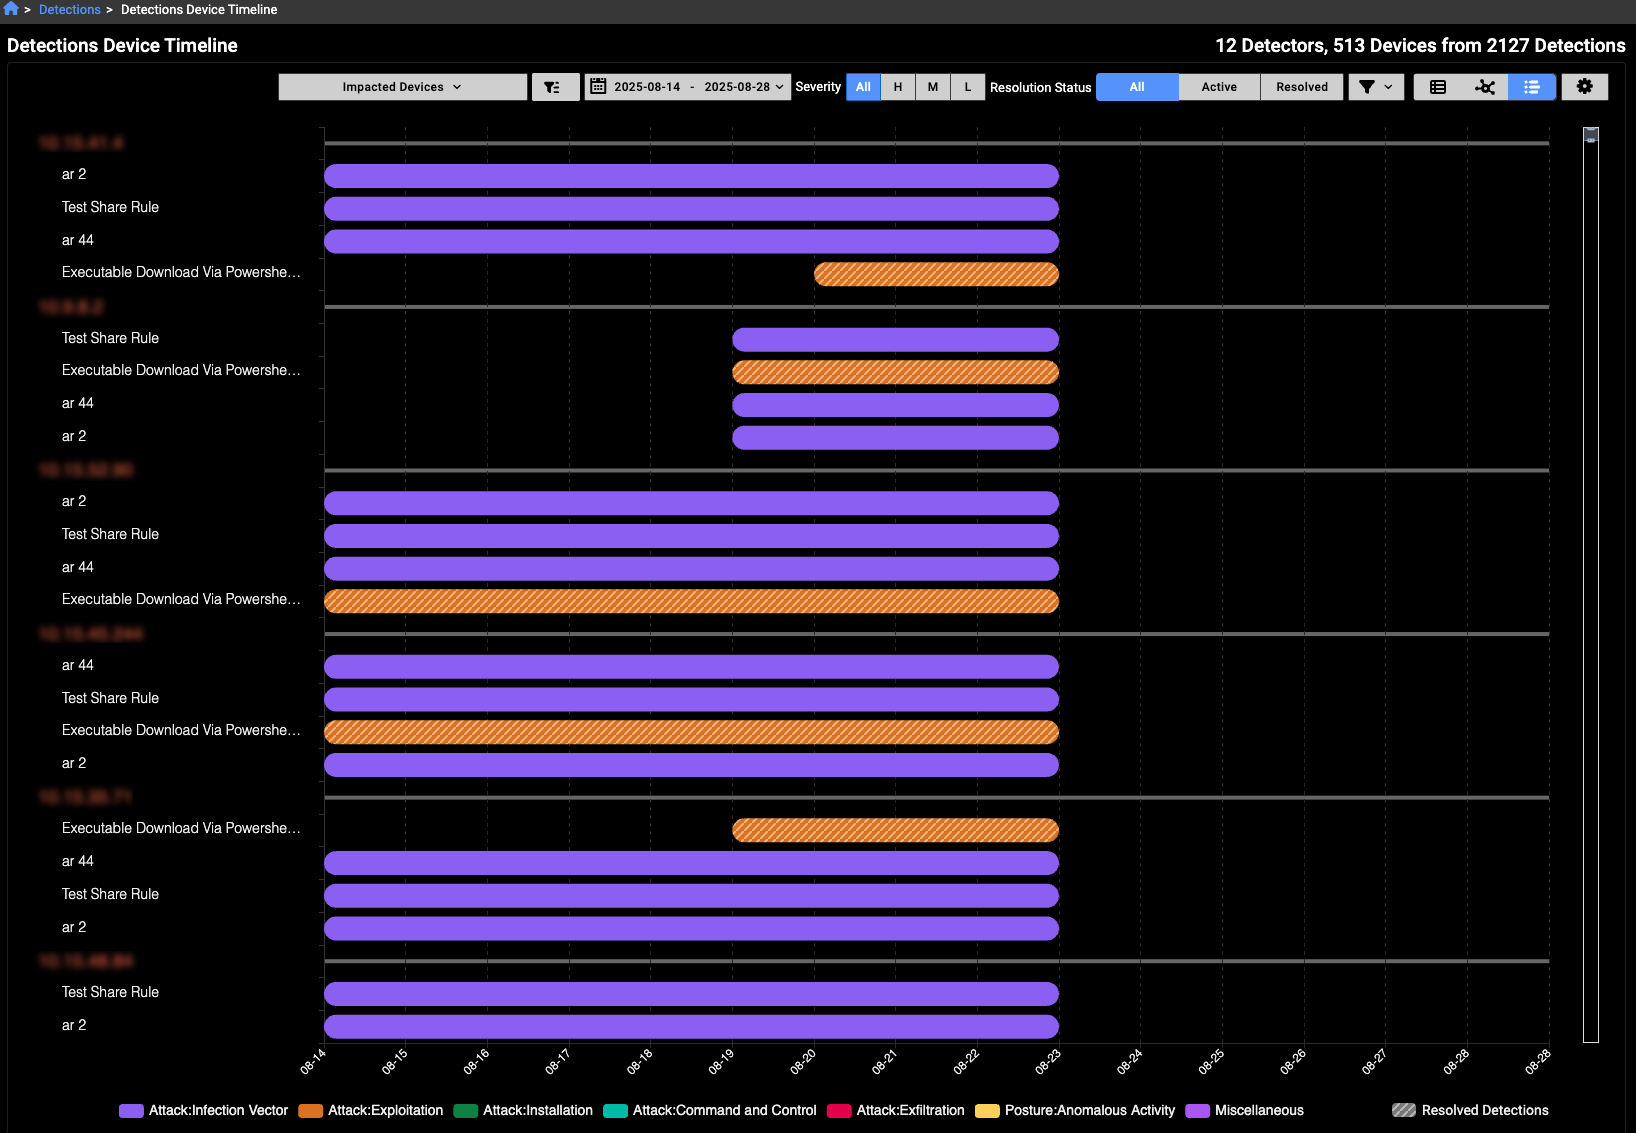
A solid background color in each bar on the chart represents a detection category, as indicated in the legend at the bottom of the page. If a bar is striped, it means all detections within that range have been resolved. Note that a single bar does not correspond to one detection; instead, it may represent multiple detections that occurred within the same time range.
Hover over a bar in the chart to view details about the detection. You can also click the Detection Context button to view the detections and observations related to this IP on the Detection Context page.
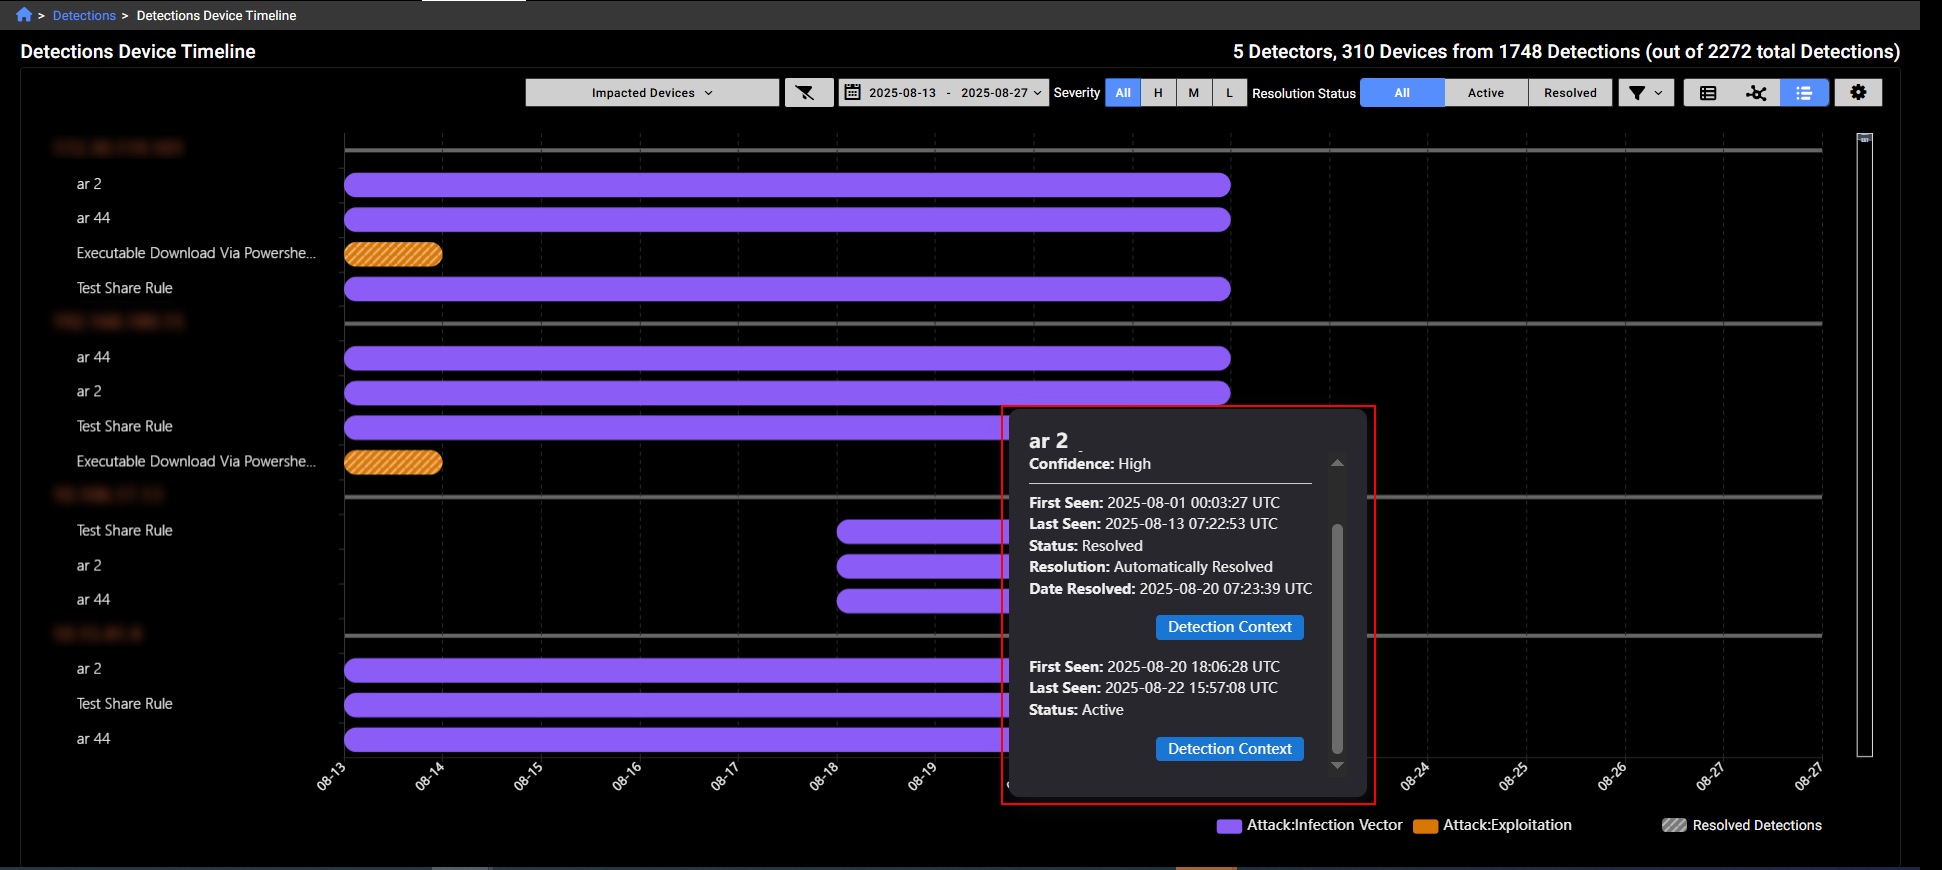
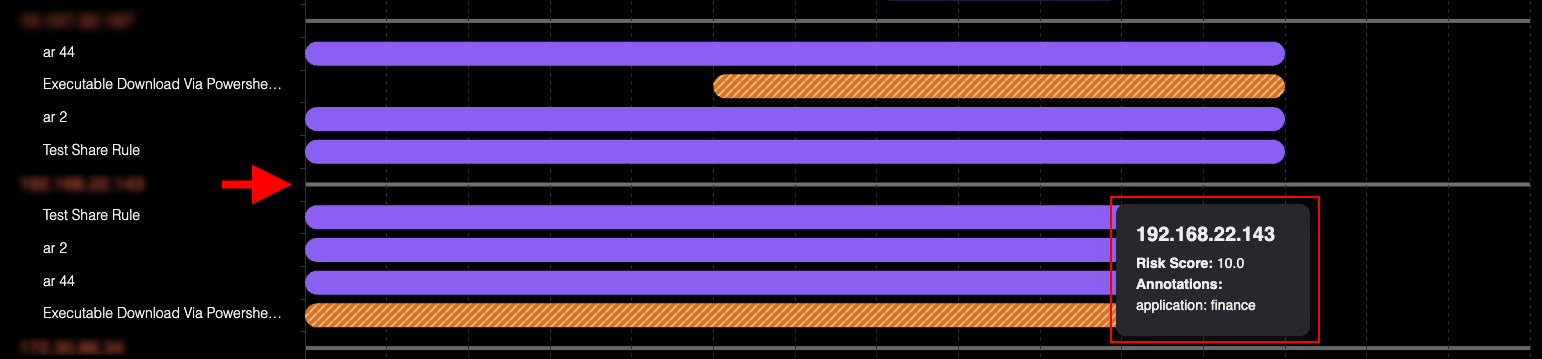
Hover over the line next to the IP label to view its risk score. Any annotations related to the IP will be displayed here
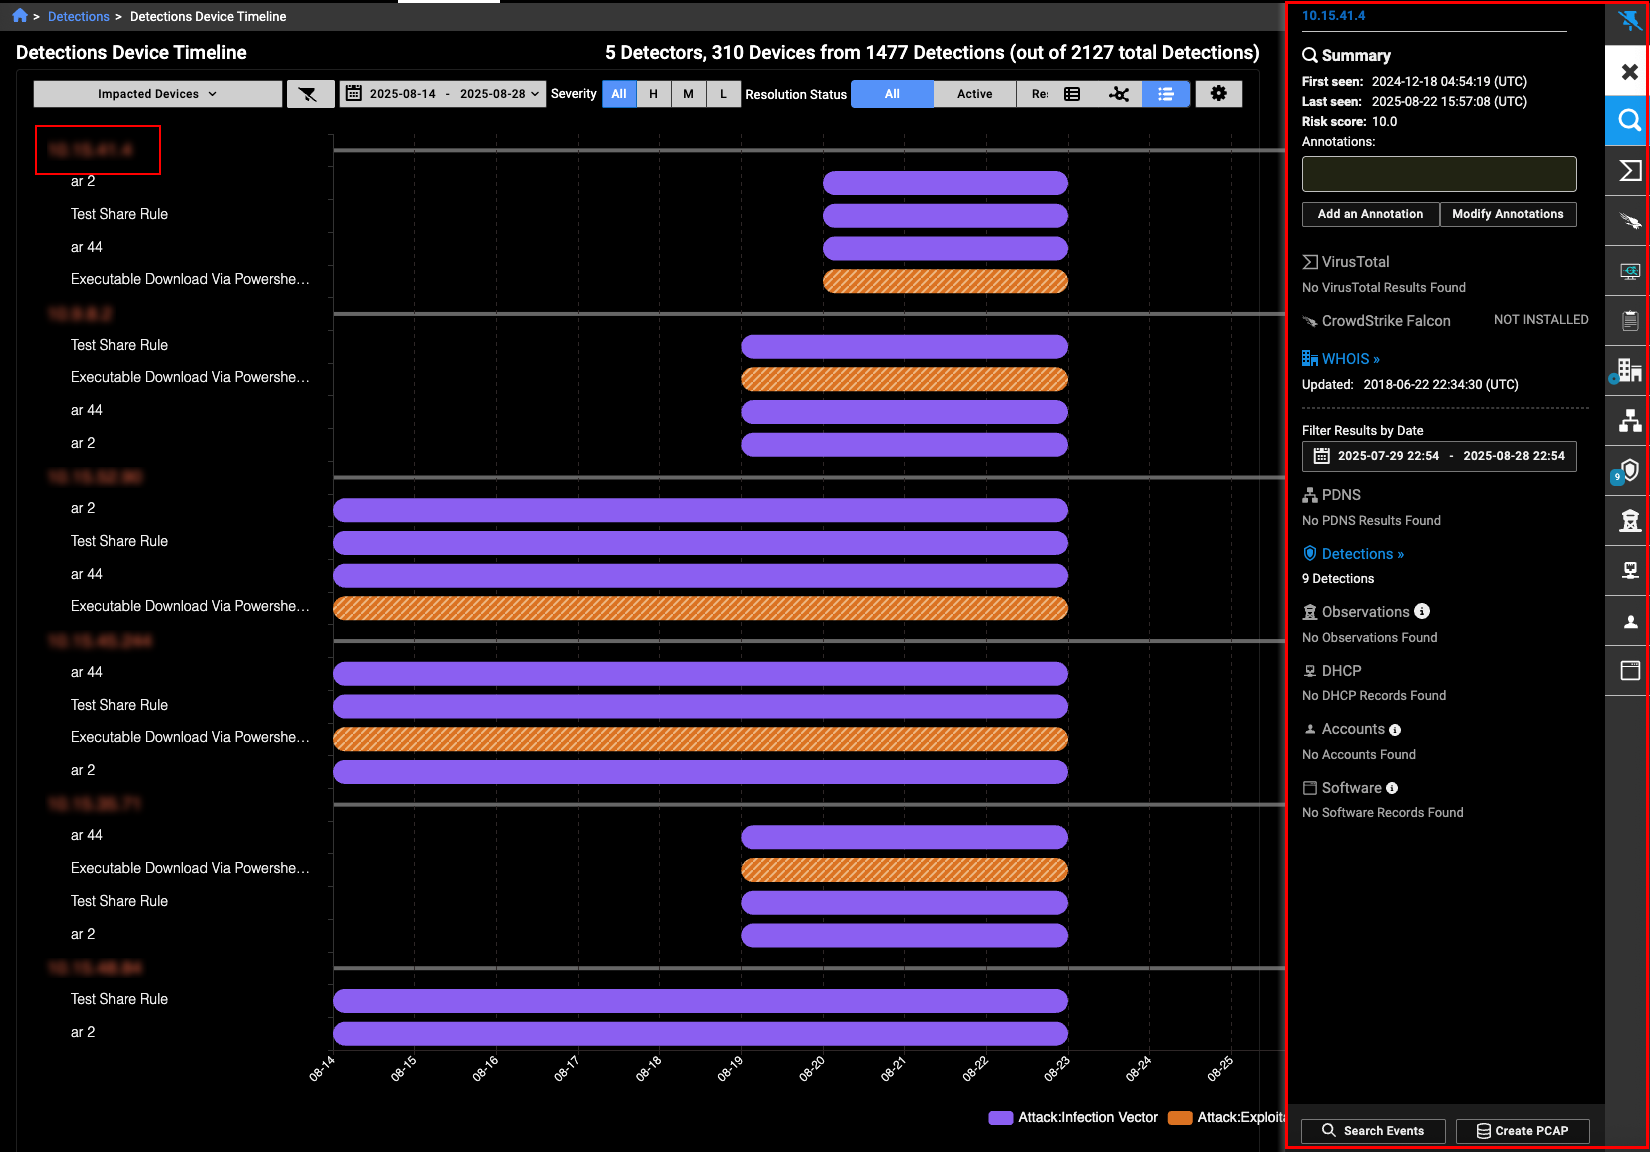
Left-click the IP label to open the Entity Panel.
Right-click the IP label to open the context menu.
You can filter the view to hide detections that have no associated events during the selected time range. Use the toggles on the right side of the page to switch between the Detections Table and Detections Visualizer views. Both views also support the Detections Device Timeline toggle.
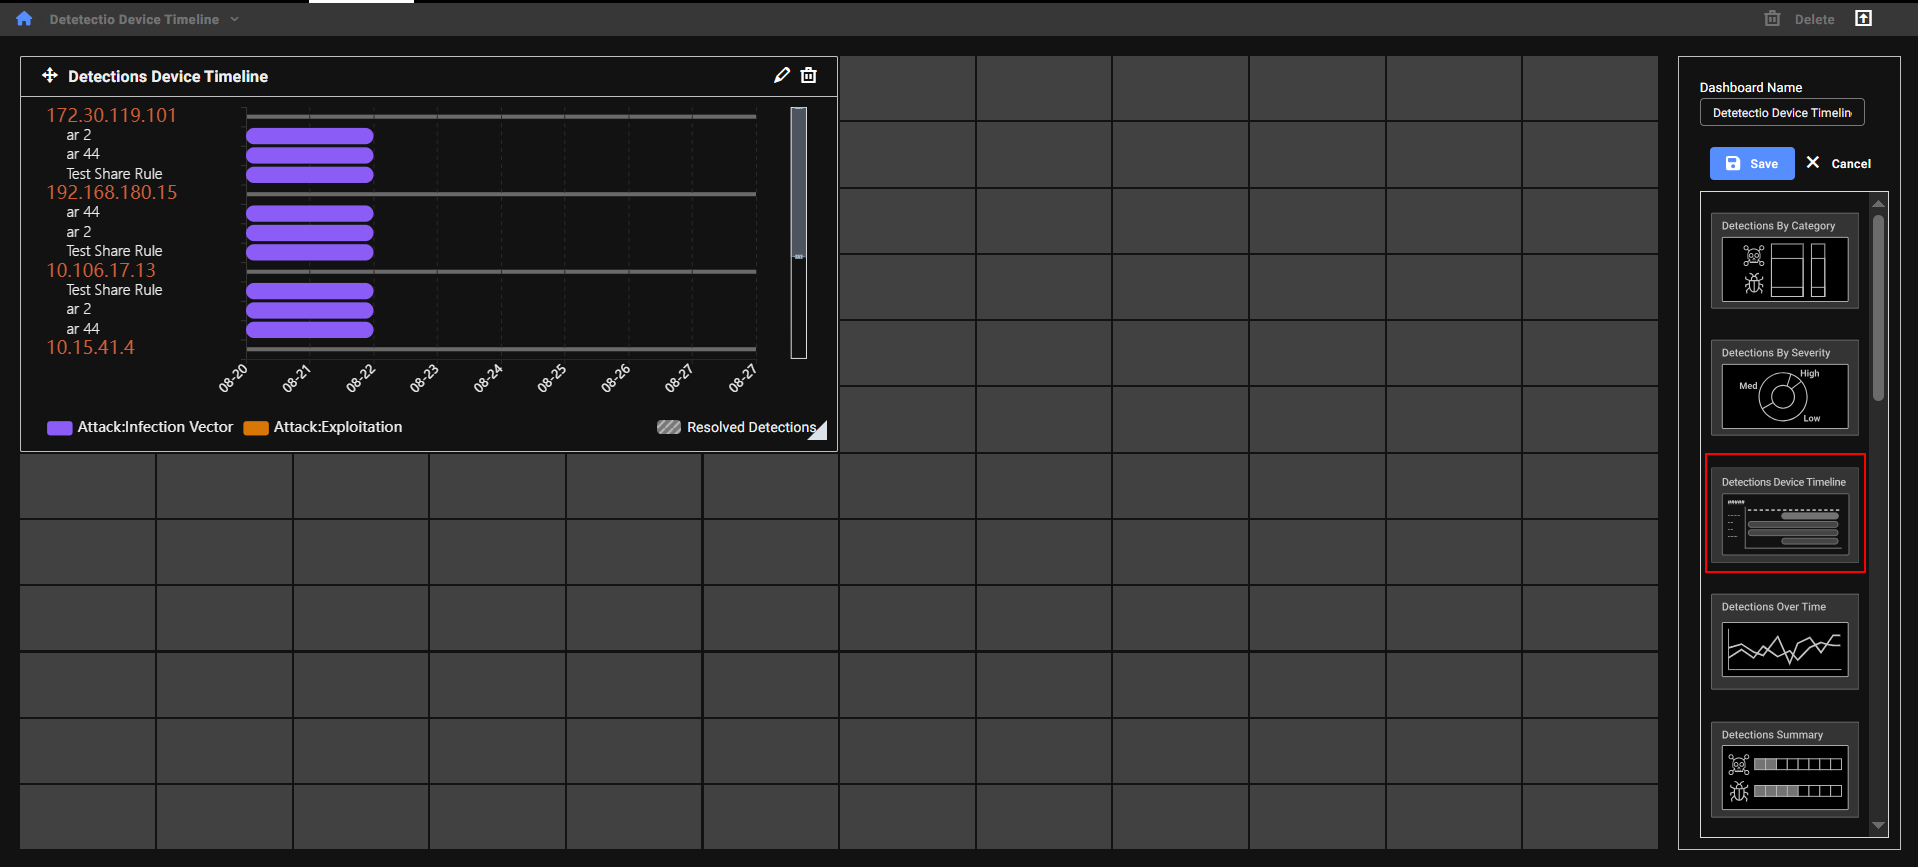
The Detections Device Timeline is available as a dedicated dashboard widget. By default, it displays the top five IPs with the highest risk scores from the past seven days. These settings are customizable.
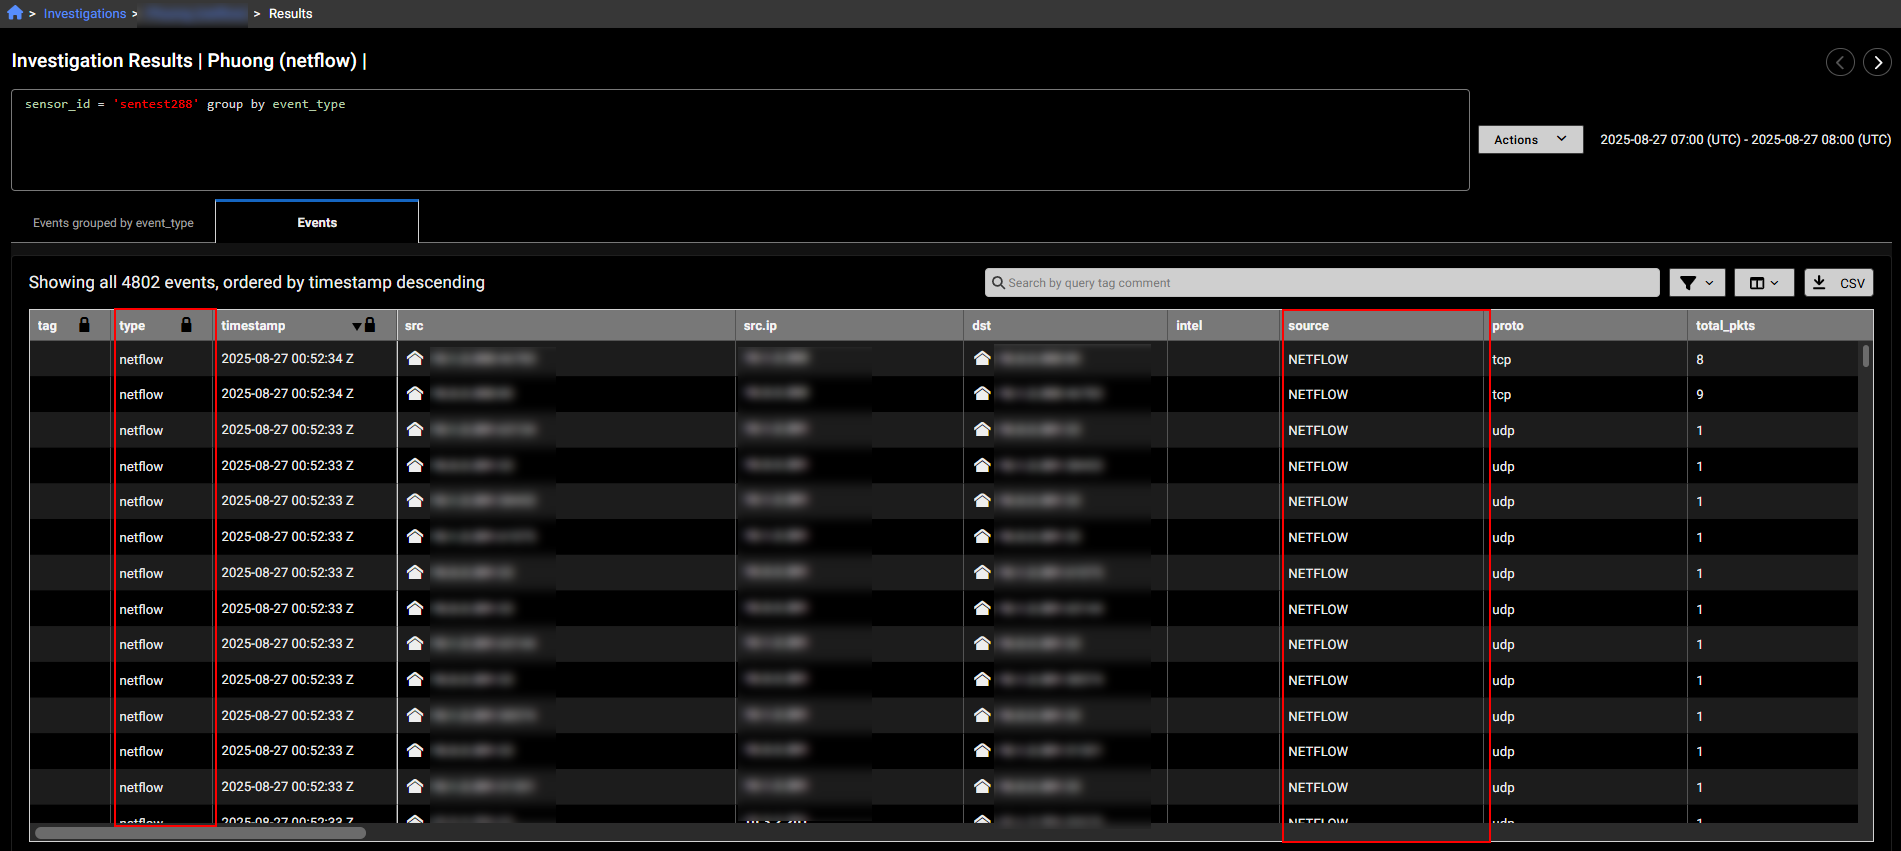
NetFlow events
NetFlow event types are now supported in investigations. NetFlow traffic is processed using source and destination objects. The Entity Panel continues to treat this traffic as sensor data. If incoming NetFlow matches your sensor’s configuration, it will be displayed accordingly.
|
|
|
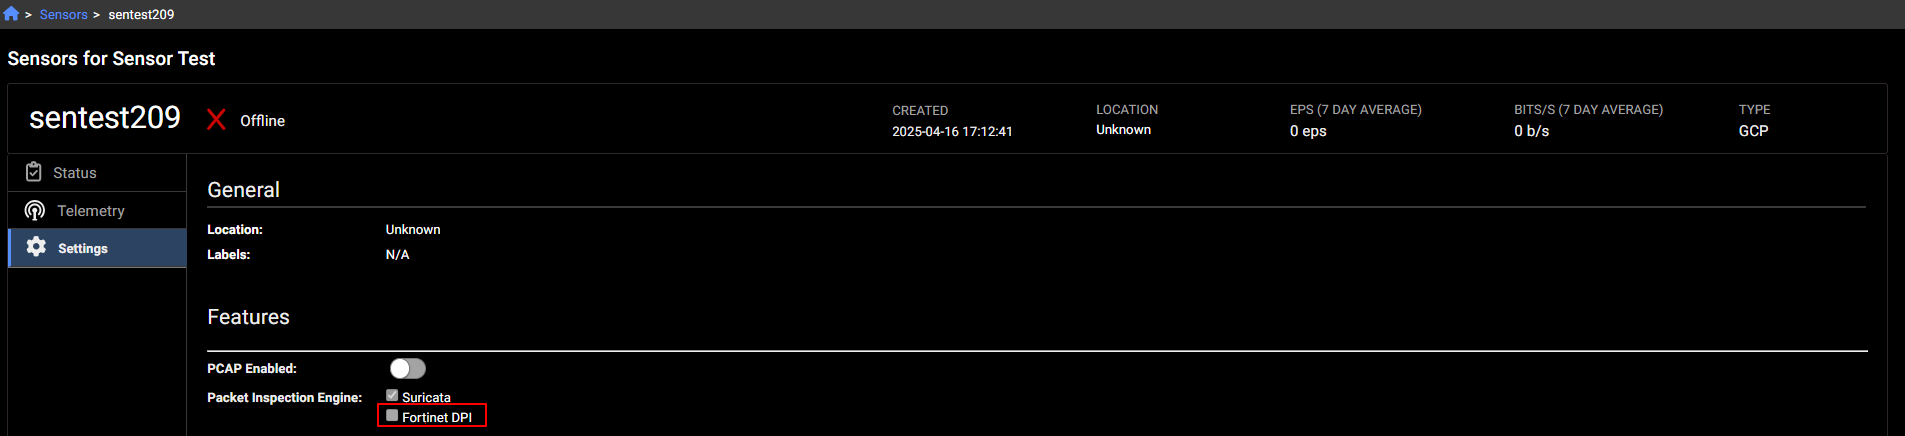
DPI events
Deep Packet Inspection (DPI) is now a supported event type. Unlike traditional stateful packet inspection, which only analyzes packet headers (e.g., source/destination IP and port), DPI examines both the header and the payload of each packet. This allows for deeper visibility into network traffic by inspecting a broader range of metadata and content. DPI events provide enhanced context for threat detection and investigation by capturing detailed packet-level data as it passes through network checkpoints.
DPI alerts classify network activity and threats into key categories. ApplD identifies applications like DNS, P2P, and social media. OT - Protocol detects operational technology protocols, while OT - Threats flags malicious activity in OT environments. Botnet alerts track known botnets, and IDS covers intrusion detection signatures. Information includes general alerts such as insecure SSL configurations.
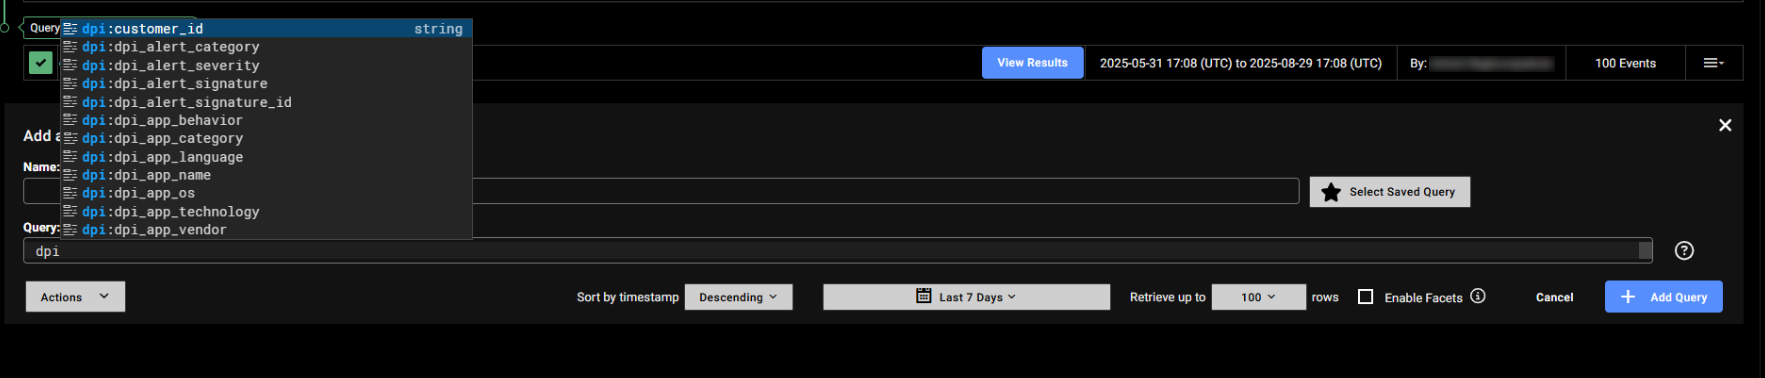
To enable DPI events, go to the sensor's Settings and select Fortinet DPI.
Improved functionality
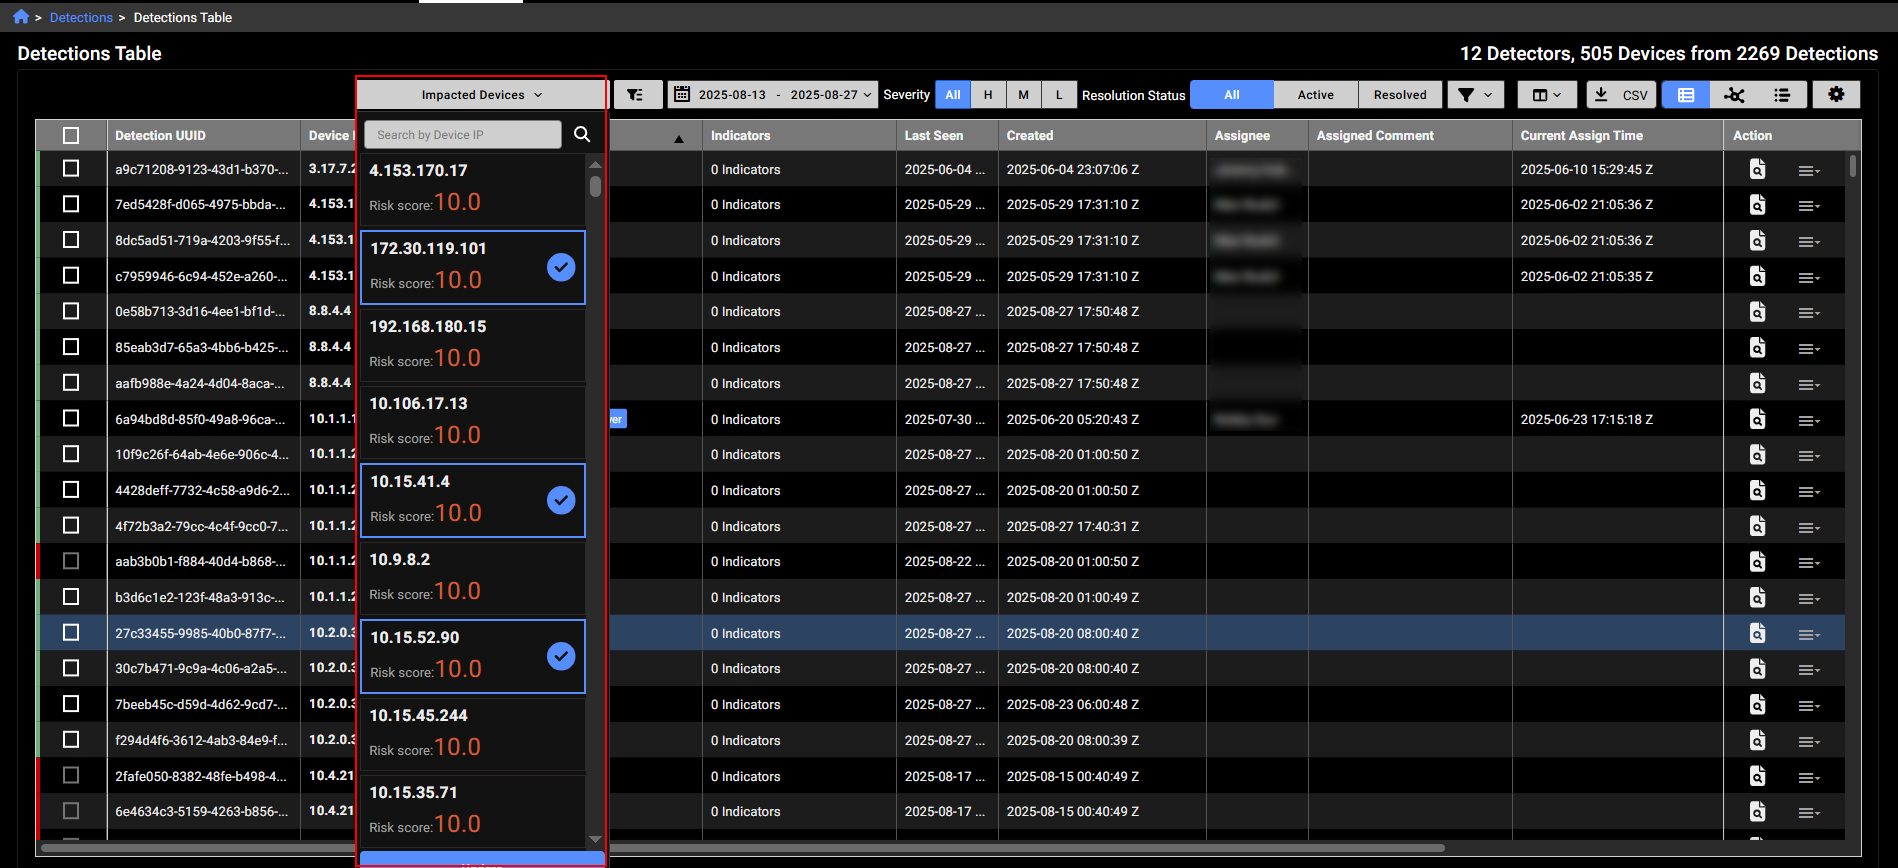
Impacted device filter
We have replaced the Device IP search box with a new filter called Impacted Devices in the Detections Table, Detections Visualizer and Detection Device Timeline. The IPs in the list are sorted by Risk Score. You can filter IPs with the search box and select the devices you want to include in the view.
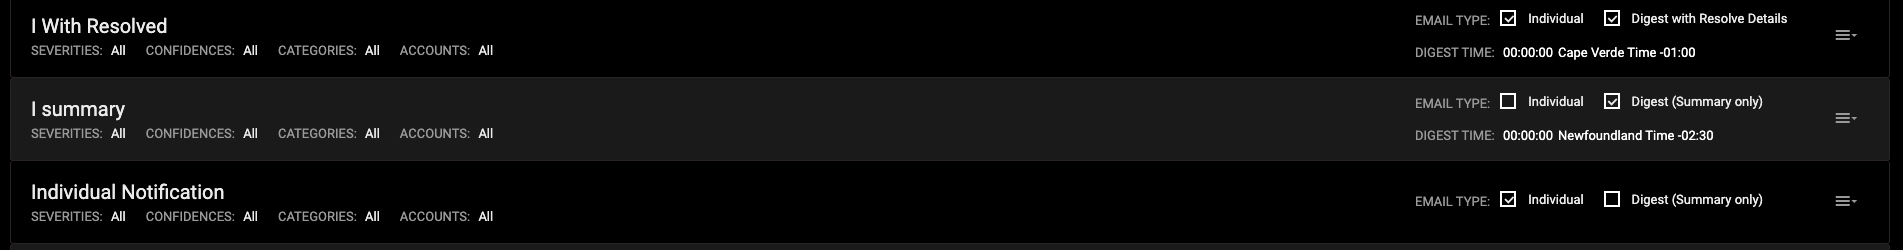
Notification emails
The email notifications settings and page have been updated include resolved details in Digest emails.
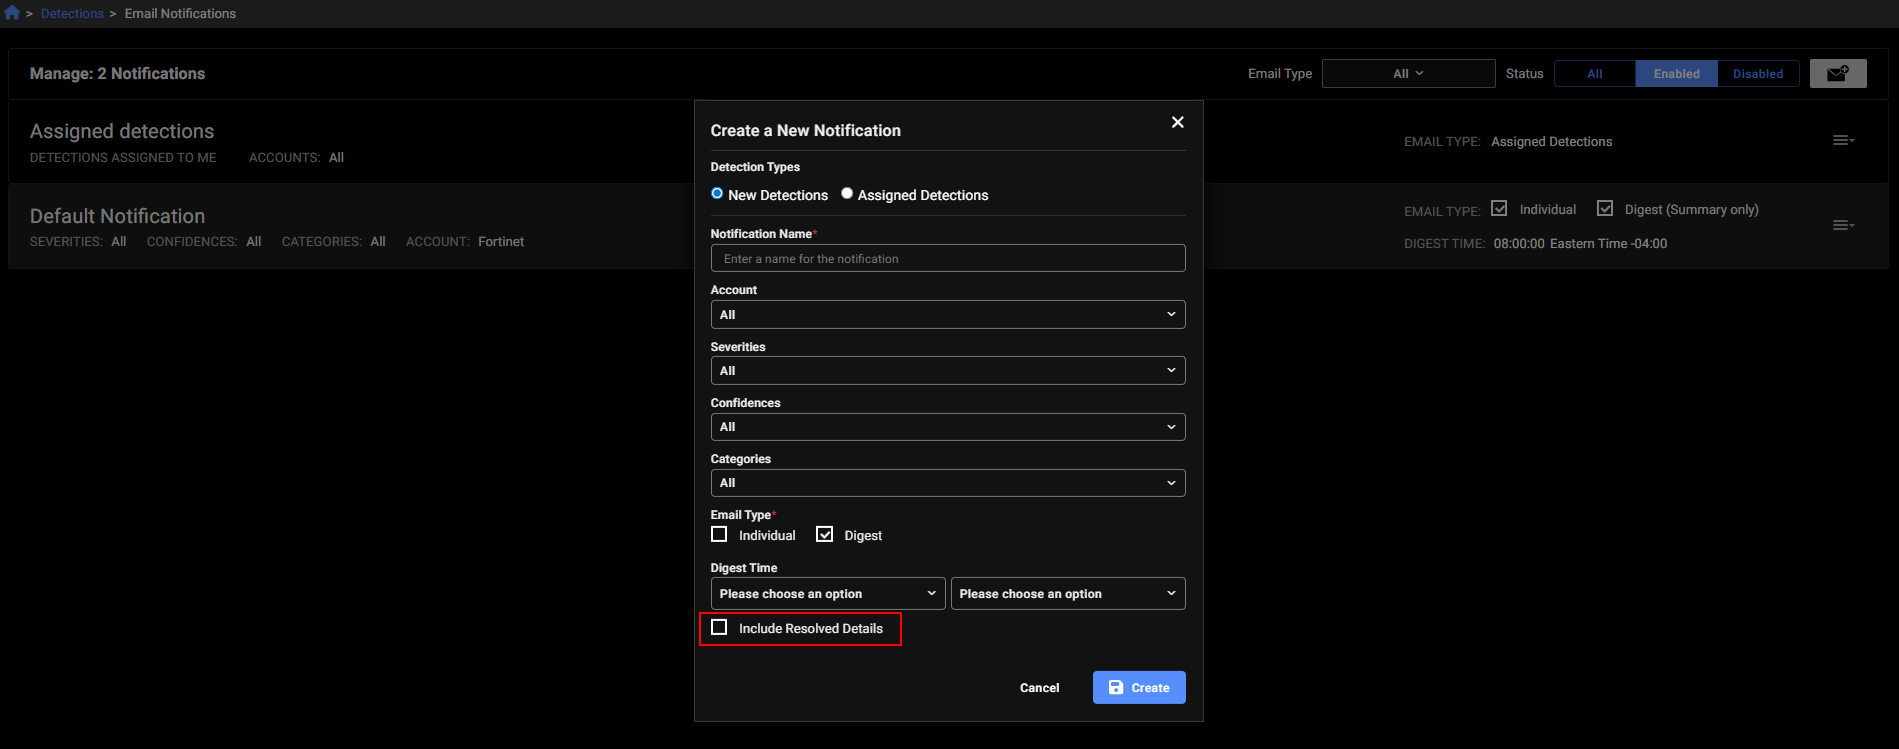
The Email Notifications page will display Digest with Resolve Details next to the email when this feature is enabled. This feature is in limited availability. If you would like it enabled please contact your TSM.
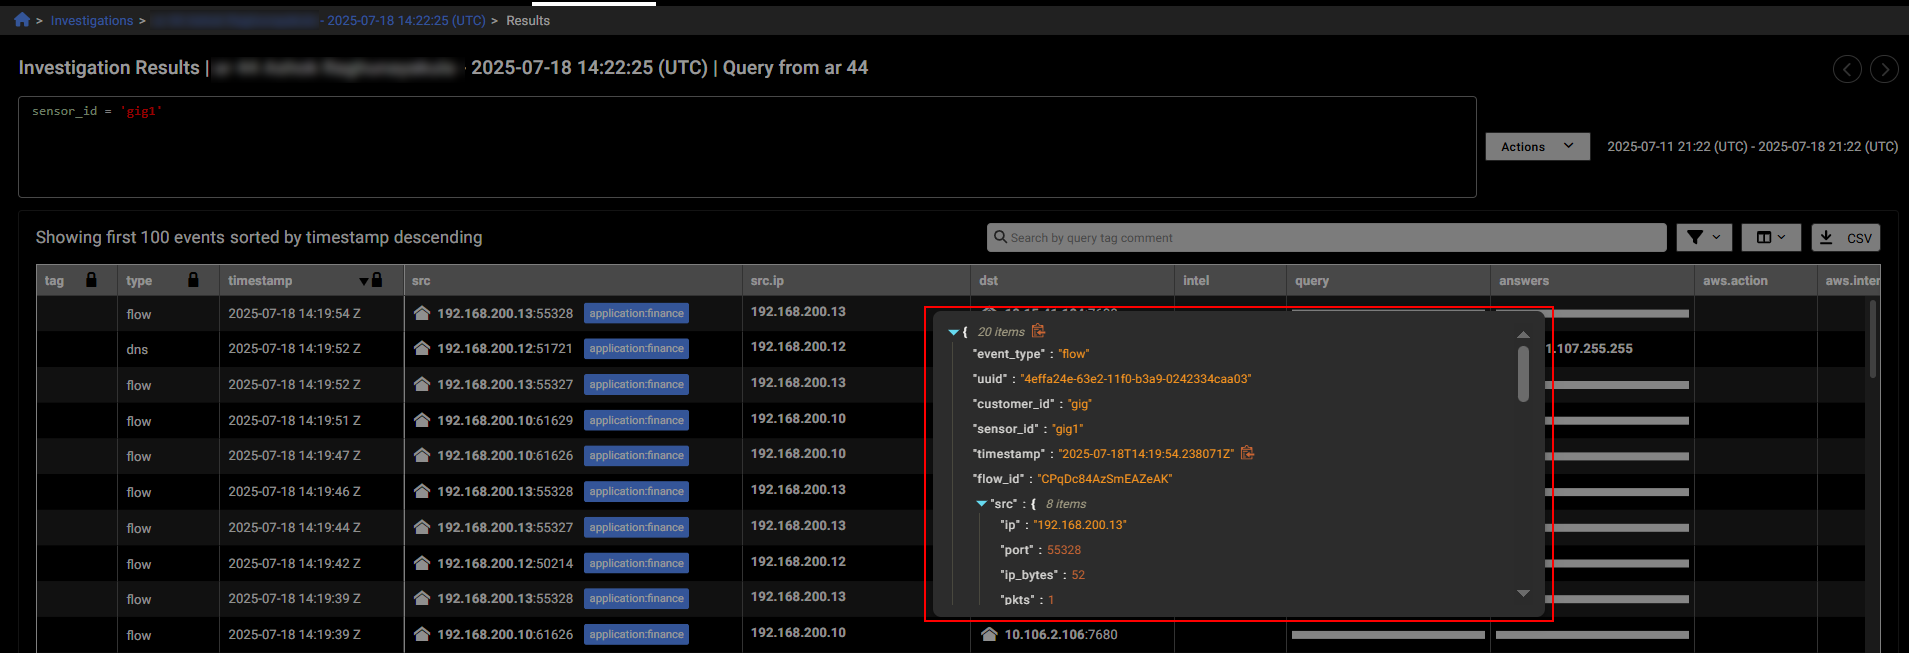
Single Event View
You can now view all details for a single event by double-clicking a blank area within the event row. This opens a pop-up displaying the full row data in JSON format. To copy the JSON, click the copy icon next to the first line. This feature saves time by eliminating the need to scroll through individual cells in the investigation results table.
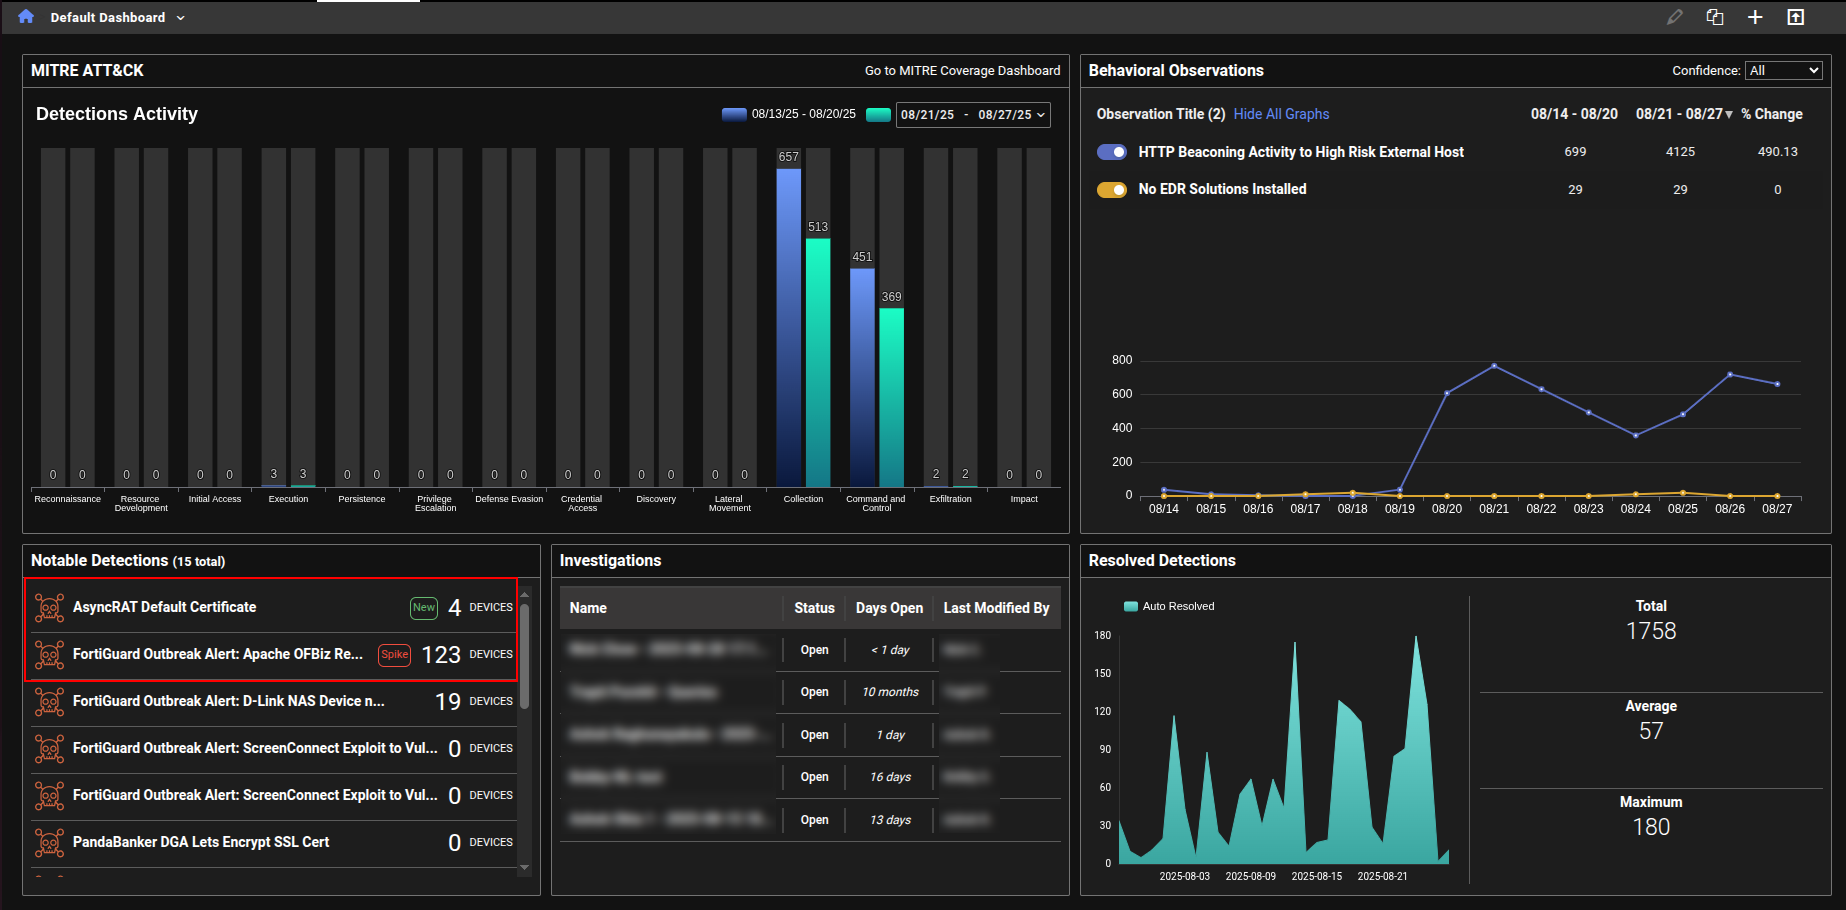
Notable detections
We have added labels to the Notable Detections table in the Dashboard to highlight new detections and spikes in detection activity.
-
New indicates that there were no active detections during the baseline period (defined as 30 to 7 days ago), but at least one detection has occurred in the past 7 days.
-
Spike indicates that the number of active detections in the past 7 days is more than three times higher than the baseline count.
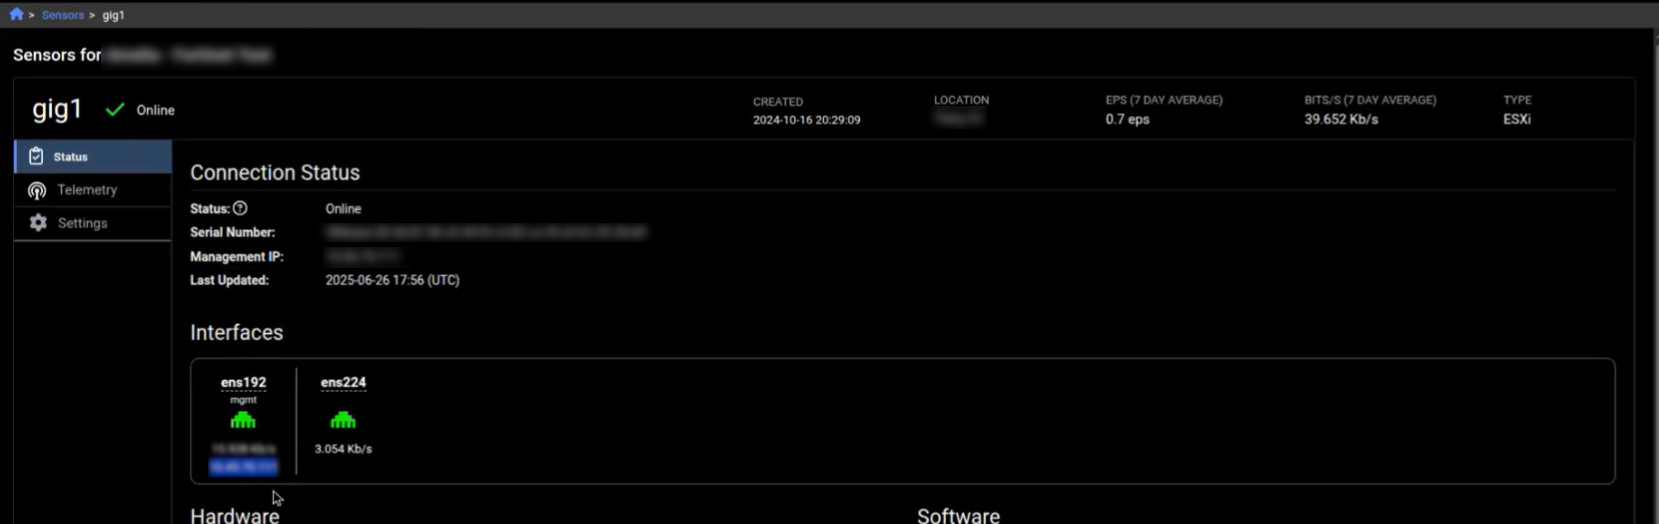
Sensor details
On the Sensors details page, each interface now displays its IP address—if that information is included in the API response. This is especially useful when the interface is configured as a NetFlow collector.
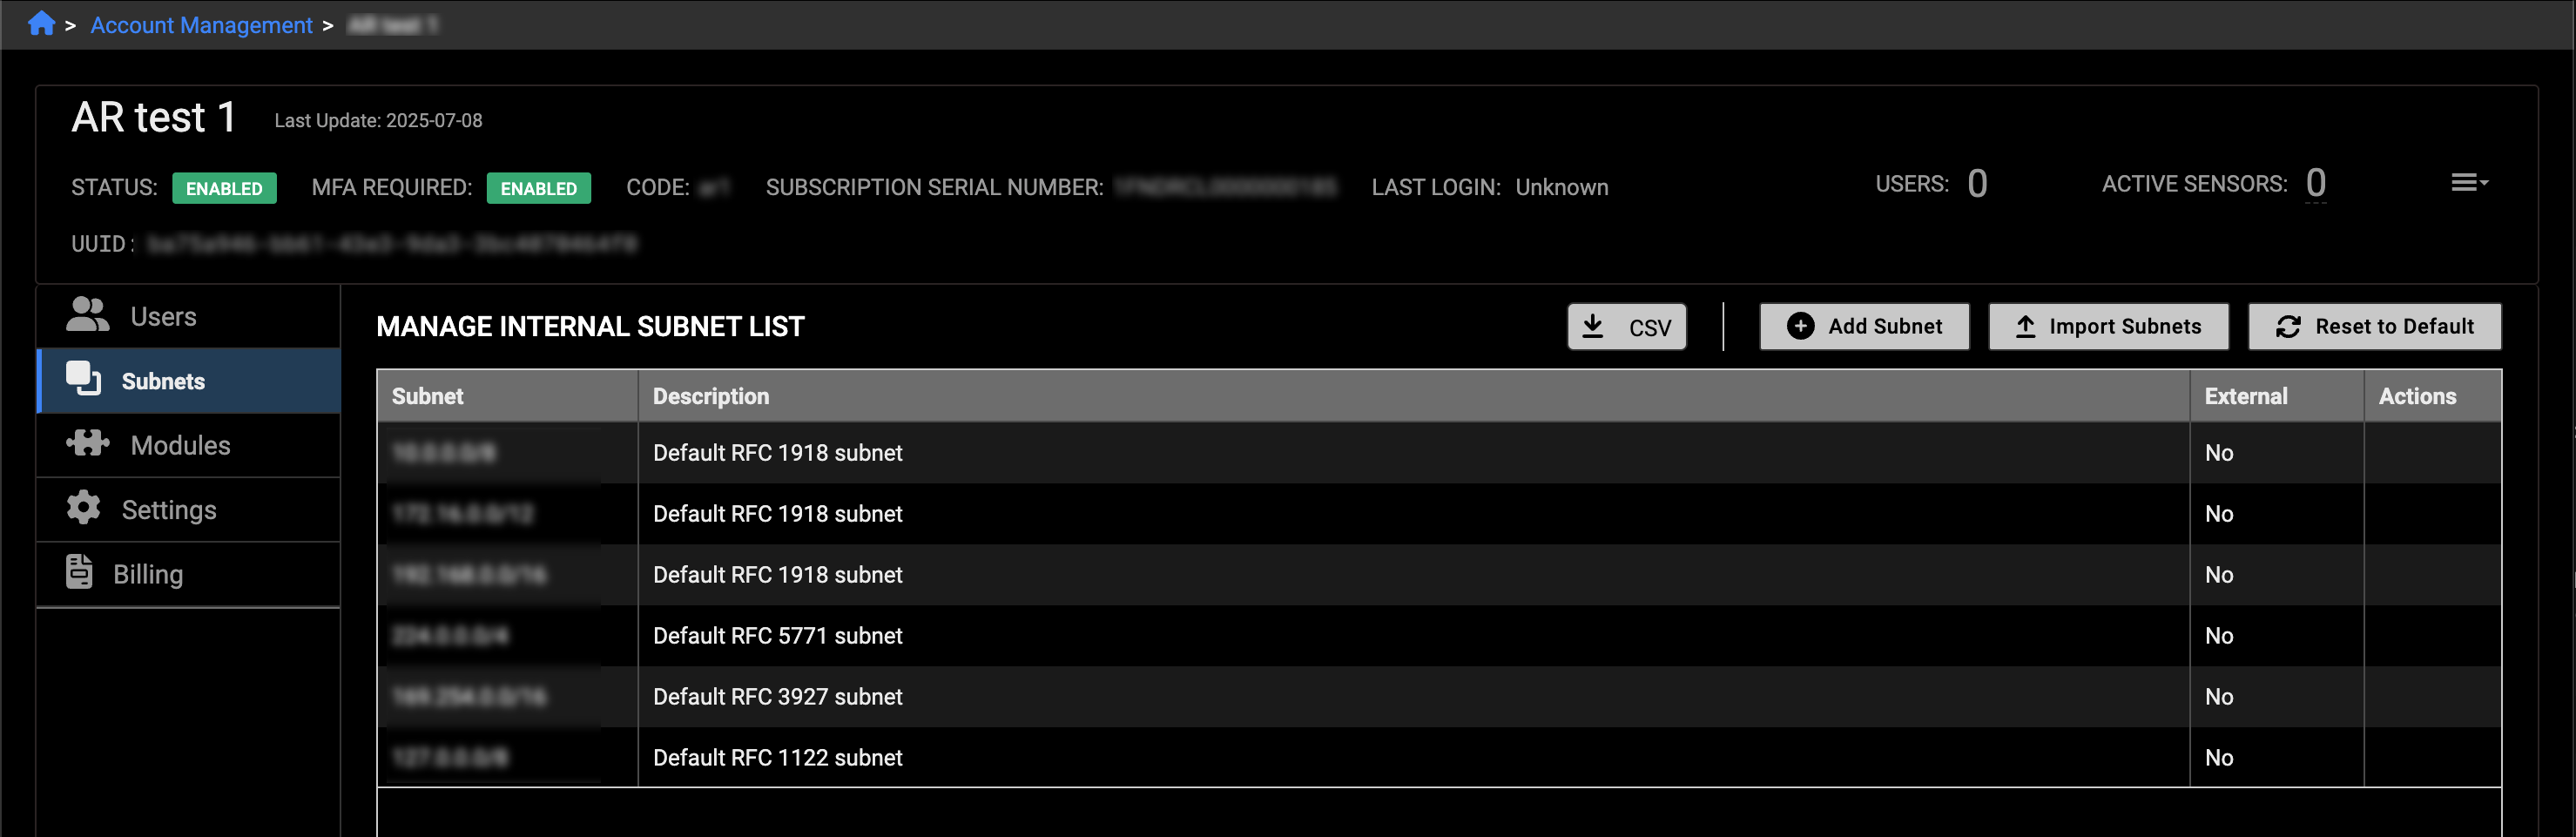
Bulk subnet imports
We have added a new Import Subnets button to the Account Management > Subnets tab. This allows you to upload thousands of subnets at once and delete them in bulk. Click the CSV button to download the current subnets, then add or remove entries and re-upload the file. You can also click the Reset to Default button to delete all subnets except the default.
Annotations
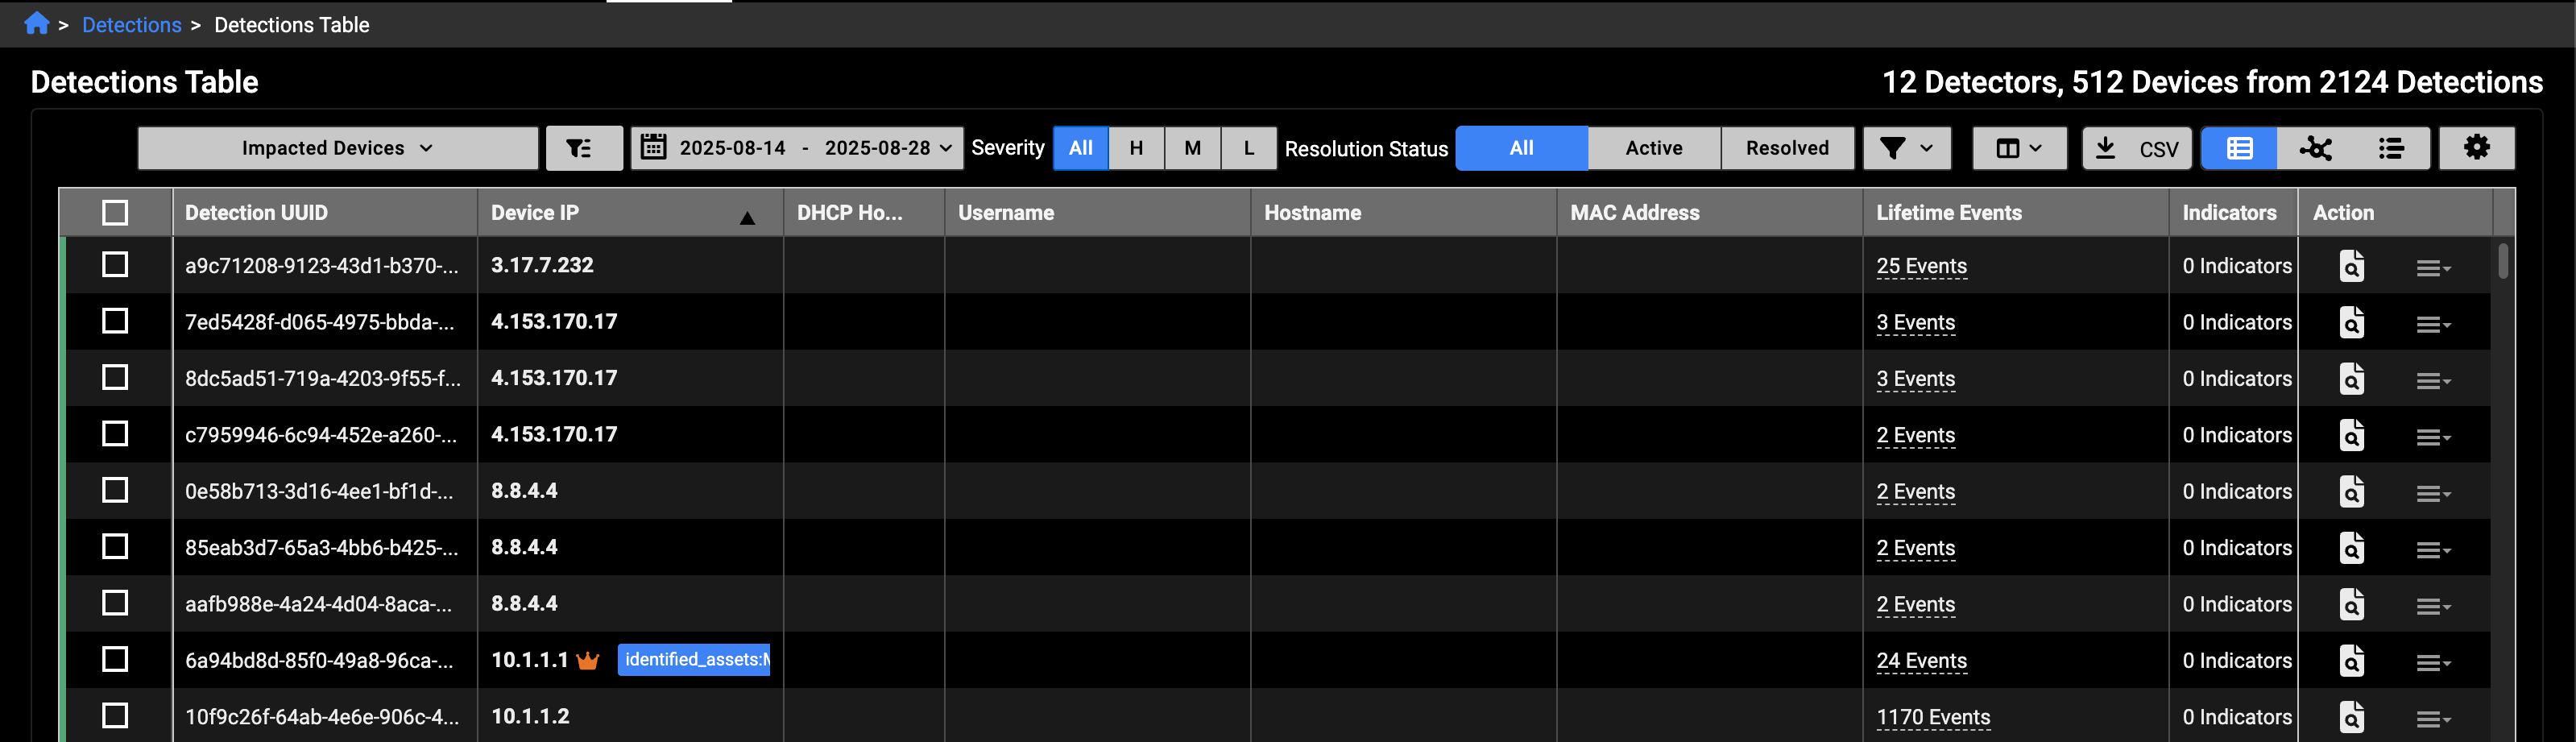
A new annotation type, Identified Assets, has been added for FortiGuard ATR. This allows assets to be tagged with priority levels—high, moderate, or low risk—which are then visible in the events and detections tables.
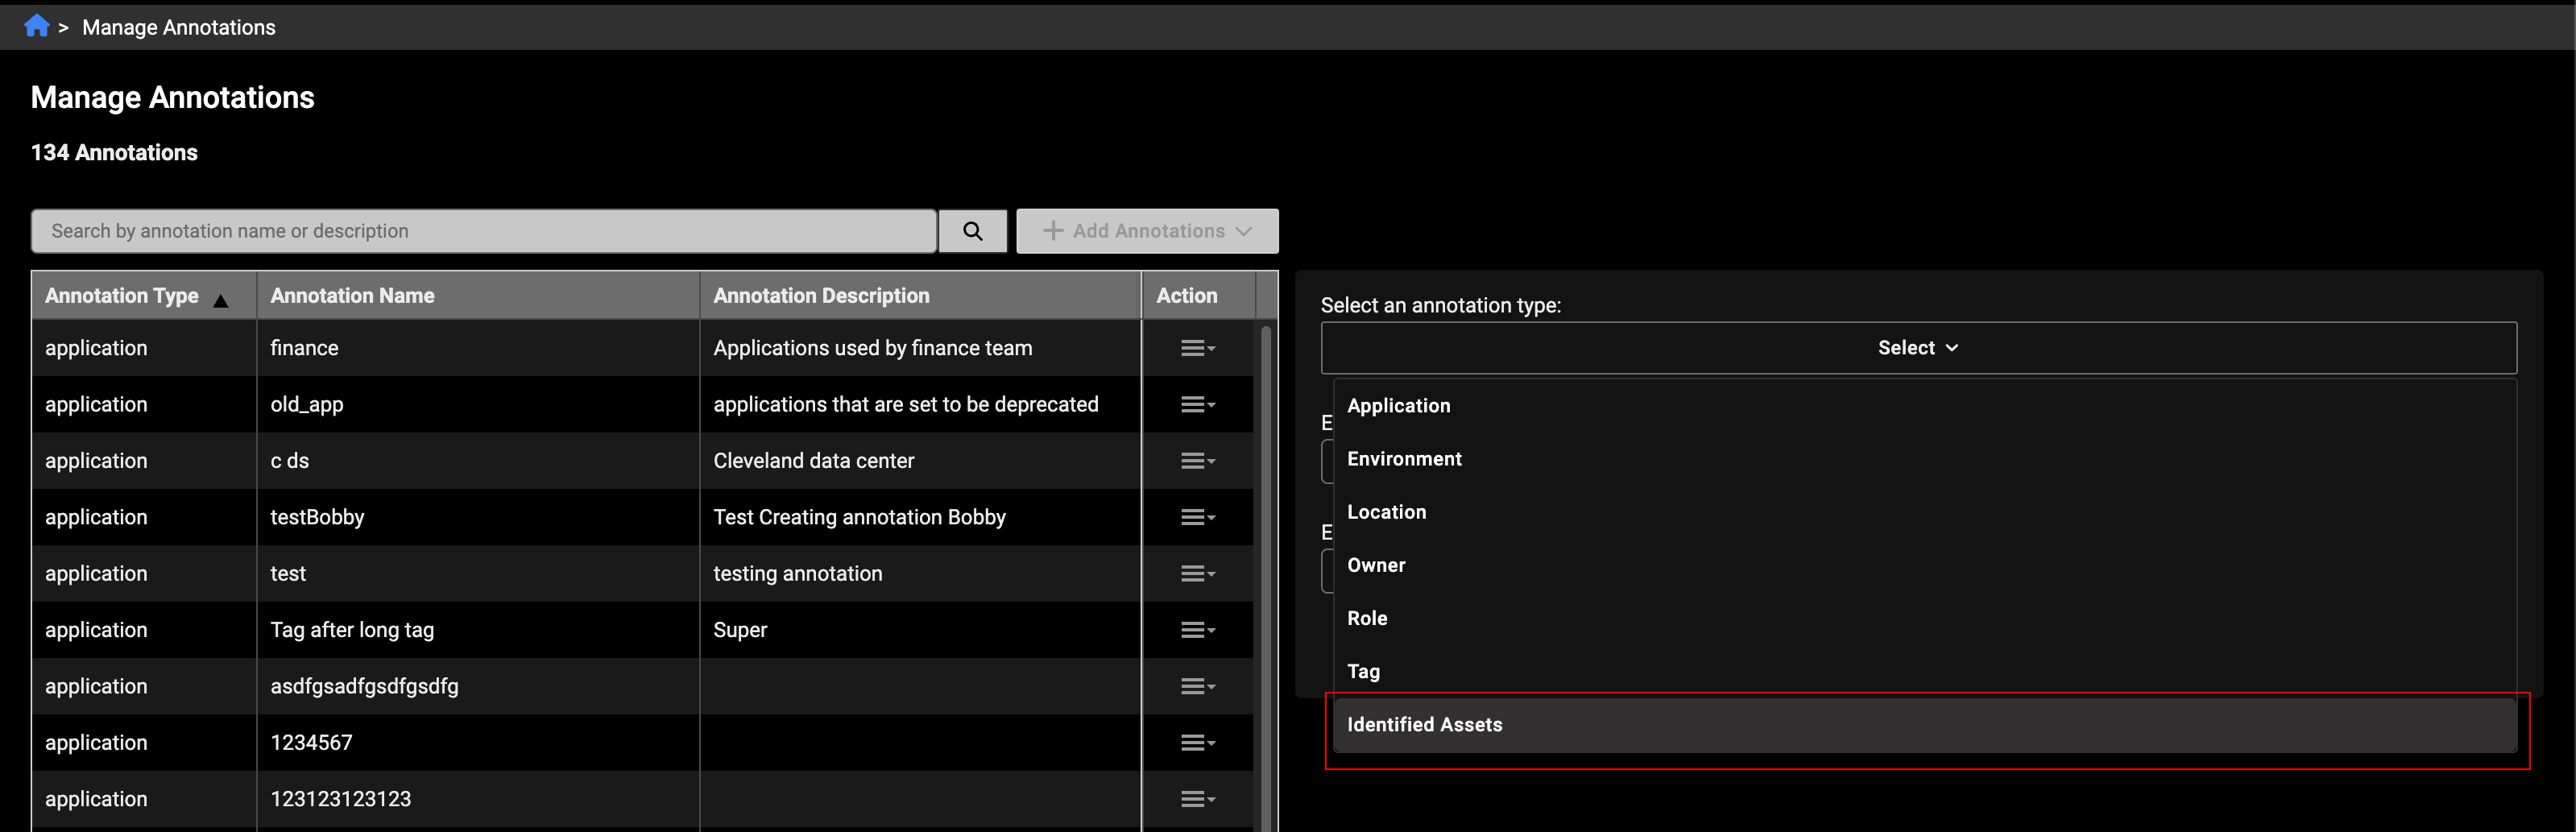
Assets marked as identified will display a crown icon, color-coded by priority: red for high, orange for moderate, and yellow for low.
Shared dashboards
In previous versions for FortiNDR Cloud when a user opened a shared dashboard containing query charts, the associated investigations and results were tied to the account that originally created the dashboard. In version 25.3.b, when a user opens a shared dashboard with query charts, a new investigation is now created in their own account. This ensures that:
-
The query results shown are based on the current account's data, not the dashboard creator's.
-
Clicking the chart title also opens the query inside the investigation specific to the current account.
When a user clones a dashboard that contains query charts, a new investigation is automatically created in the user's account for each query chart widget. This ensures that the cloned dashboard runs fresh queries and displays results based on the current account data. The investigation is independent of the original dashboard and tailored to the account.
Users with only the Admin role (and no additional roles like User) will not see dashboards that contain query charts. This ensures that only users with the appropriate permissions can access dashboards with query-based data.
Other improvements
Investigation Summary field
When a new investigation is created, the system now automatically adds a summary note at the top. This ensures the summary remains visible above any subsequent query entries, unlike regular notes which follow the timeline order.
Data sources
Previously, users could only view included and excluded data sources by going to the Edit Detector page. Now, this information is also visible in View mode under the Query tab, making it easier to access without needing to edit the detector.
Network Security Posture Report
A new query named DNS over HTTPS(DoH) Usage was added the Network Security Posture Report.
Deprecated features
The following dashboards, features and view have been deprecated in version 25.3.b
-
Dashboards:
- Example Hunt Dashboard 2
- Security Posture - Deprecated SSL
- Security Posture -DNS
- Security Posture - Outdated / EOL software
- Security Posture - SSH Connections
- Device tracking
- Triage devices