
Version 25.4.0
Improved functionality
Default dashboard
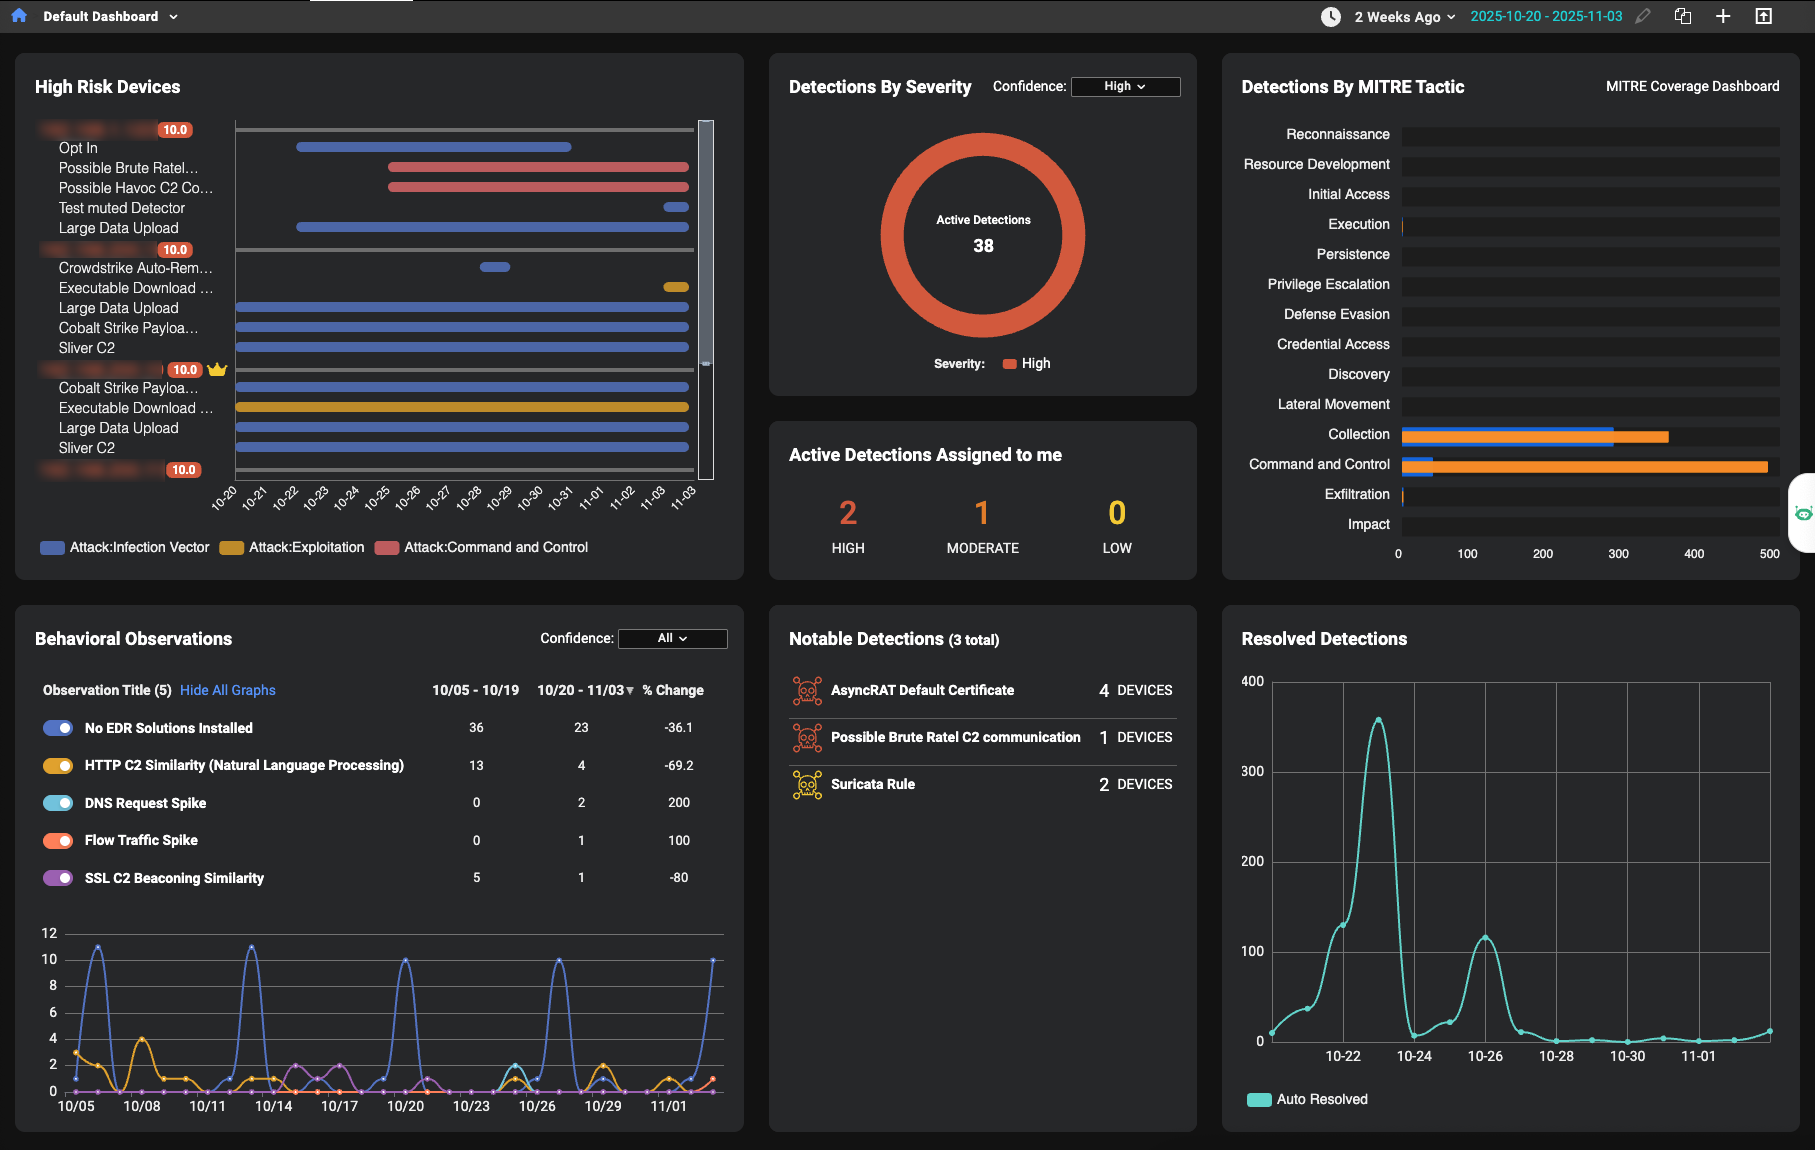
The default dashboard has been redesigned with a cleaner, more modern layout. The new design introduces enhanced functionality and richer visualizations. This redesign is driven by a focus on analyst workflows and risk-based prioritization. All dashboard widgets (both default and custom) now feature a refreshed look with simplified styling for a more streamlined appearance. Widgets also load in a structured sequence, improving visual consistency during page load.
Key improvements:
-
The Global Date Picker (located above the Detections by MITRE Tactic widget) applies a selected date range to all dashboard widgets with a time range, updating them simultaneously regardless of their individual time settings.
- The new High-Risk Devices widget helps you quickly identify high-risk assets by displaying risk scores next to device IPs and using color-coded crown icons for identified assets. Click a device IP to open the Entity Panel.
- The Detections by Severity widget helps you identify high-severity detections by grouping them by confidence level on initial load, with an added dropdown menu to switch between severity levels or view all.
- The Notable Detections widget highlights detectors with tags such as New or Spike to help quickly identify emerging or unusual activity.
- The Detections by MITRE Tactic and Resolved Detections widgets now features redesigned visualizations for improved clarity.
Detection device timeline
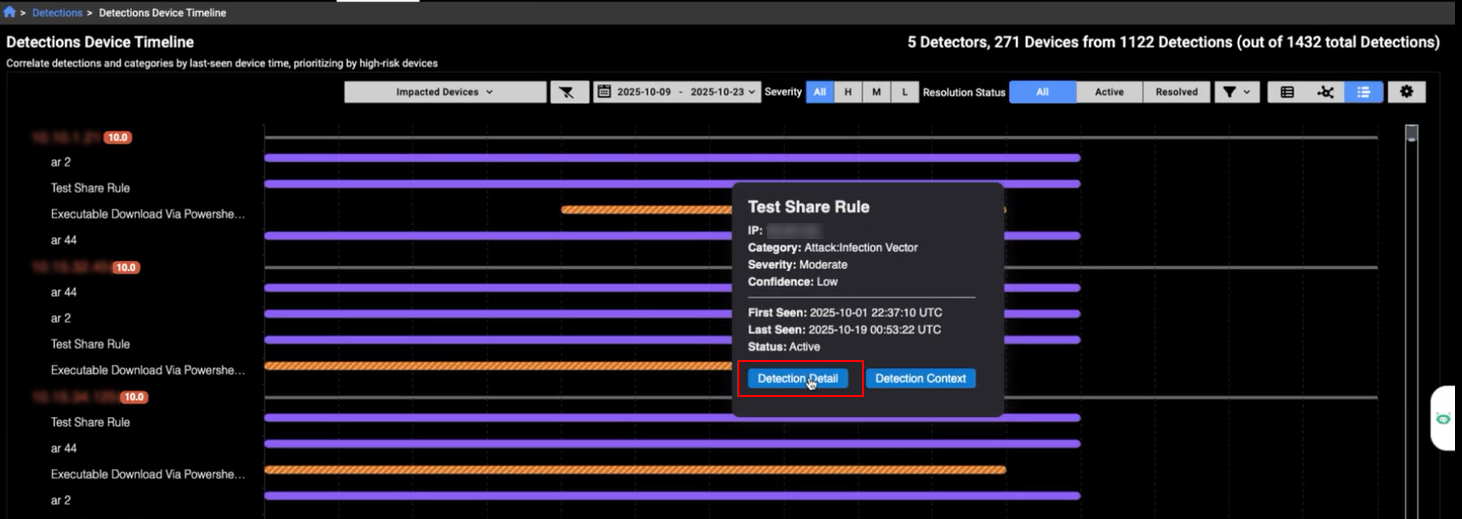
The Detection Device Timeline now features a cleaner design for improved readability. A new Detection Detail button has been added to the tooltip, allowing you to quickly navigate to the detection details page for a selected detector.
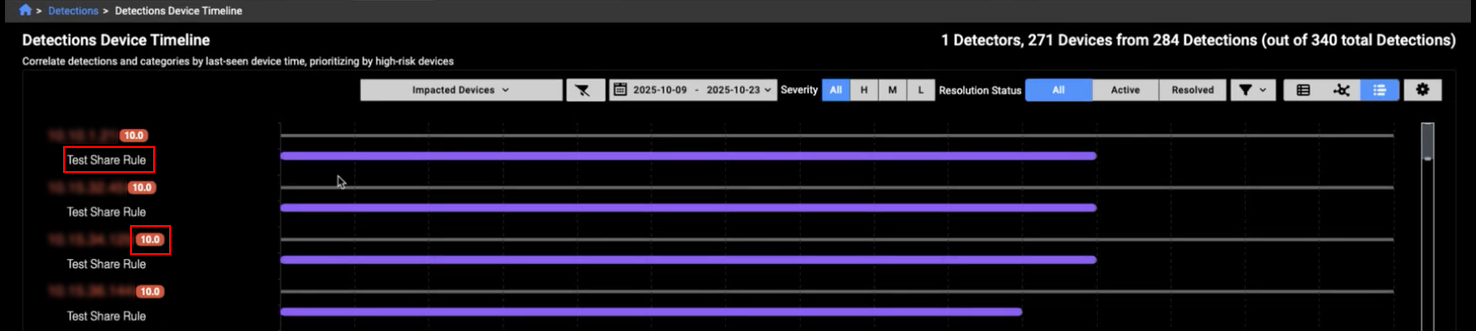
You can now filter the timeline to show detections from a specific detector by clicking its name. Risk scores are displayed next to the IP addresses, providing quick insight into the risk level of the detection.
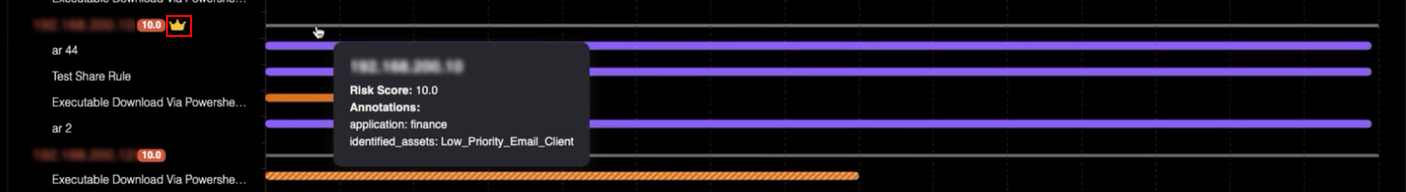
A crown icon appears next to an IP to indicate Identified Assets within the timeline view. The crown's color is determined by the priority level: High, Moderate, or Low.
Event fields
IQL queries have been expanded to include the following events and fields:
- BACnet events:
- BACnet Device control :A BACnet device control event occurs when BACnet messages like Reinitialize-Device or Device-Communication-Control are detected. These events log administrative actions that affect device availability and behavior.
- BACnet Discovery: A BACnet discovery event is created when Who-Is/I-Am/Who-Has/I-Have messages are observed, recording device/object identifiers and vendor information for rapid inventory. This log focuses on unconfirmed services used for discovery.
- BACnet Property: A BACnet property event is created when Read-Property-Request, Read-Property-ACK, or Write-Property-Request messages are observed, capturing object type, instance number, property identifier, array index, and value. This log focuses on confirmed services used for reading and writing properties.
- BACnet header: A BACnet header event is created when any BACnet/IP packet is seen; the log captures header information for both APDU and NPDU messages. BACnet is a building automation/control protocol used for device discovery, property access, and supervisory functions.
- Profinet: A profinet event is created by the use of PROFINET an Ethernet protocol for communication between devices in industrial automation systems.
- SSH: SSH events now support the following fields:
- ssf_hassh: Adds support for identifying SSH clients and servers using network fingerprinting, helping to detect and classify SSH traffic more accurately.
- ssh_hassh_server: Adds network fingerprinting to help detect and classify specific SSH server implementations based on their behavior.
- community_id: This field was added to Suricata and Flow events. This field makes it easier to match network connections across different tools to help streamline investigations and improve event correlation.
Other improvements
Improved Entity Panel performance:
- We have improved the responsiveness of the Entity Panel. Individual sections now appear sooner, providing faster visibility and a smoother user experience.
MITRE techniques:
- The following techniques were added: Compromise Infrastructure - Network Devices, Wi-Fi Networks, Remote Access Tools - Remote Desktop Software, Modify Registry, Account Manipulation - Additional Local or Domain Groups, Application Layer Protocol - Publish/Subscribe Protocols, Software Extensions - IDE Extensions, Exfiltration Over Web Service - Exfiltration Over Webhook, Resource Hijacking - Compute Hijacking, Resource Hijacking - Bandwidth Hijacking, and Hide Infrastructure.
Improved visual styling:
- We have refined the appearance of the Investigation Details page by applying distinct colors and italic styling to improve clarity and visibility.
-
Dropdown menus have been improved to accommodate sub-menus that to do not fit a broswer page. We have all also improved the performance of the context menus.