
Version 25.2.c
New functionality
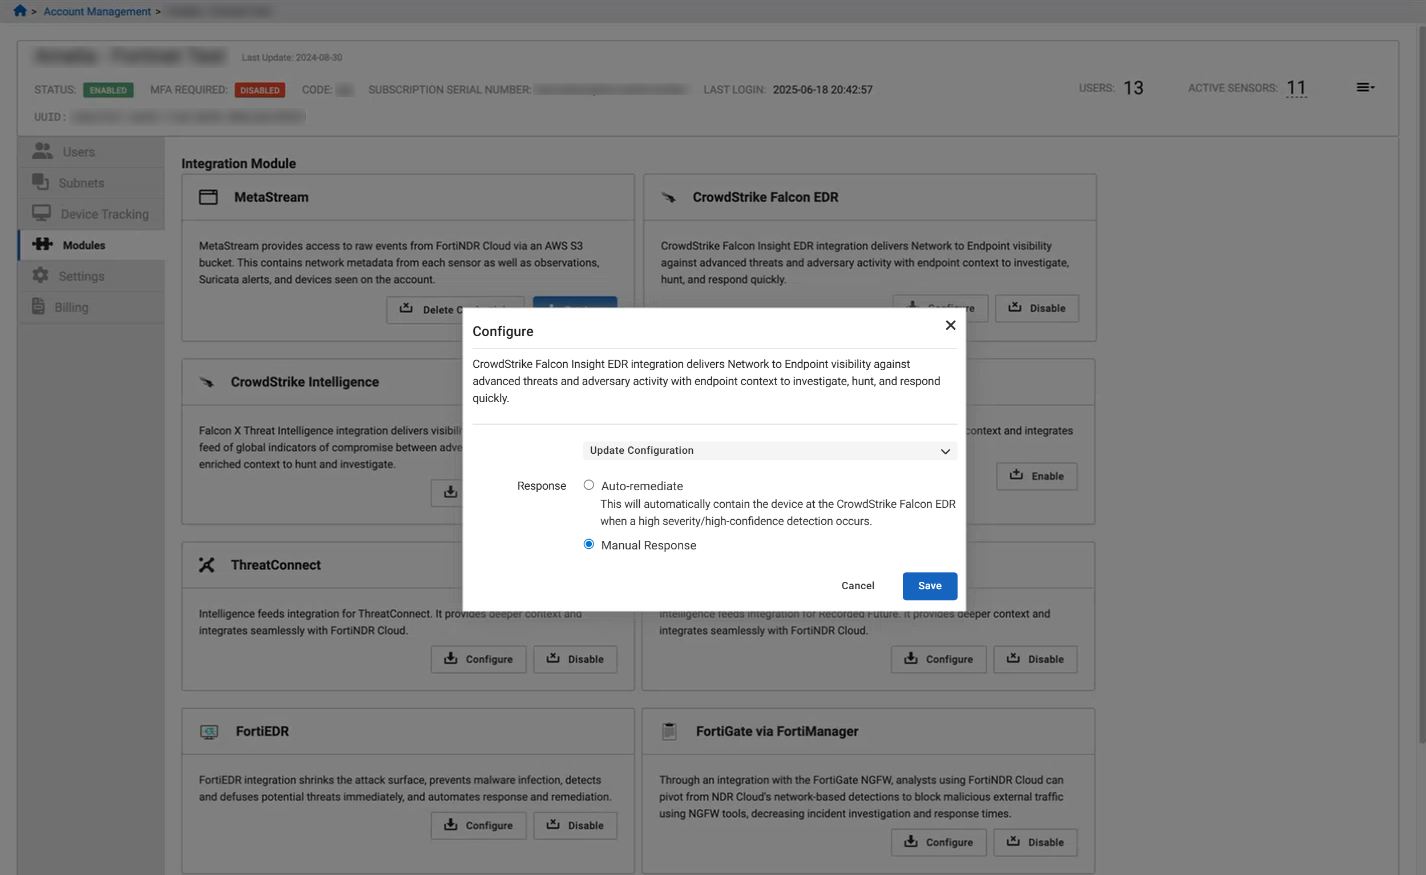
Automated integration response modules
Automated integration response modules are added for FortiEDR and CrowdStrike Falcon EDR. Only a single integration can be set to Auto-Remediate at a time; others may be configured, but must be set up to respond manually.
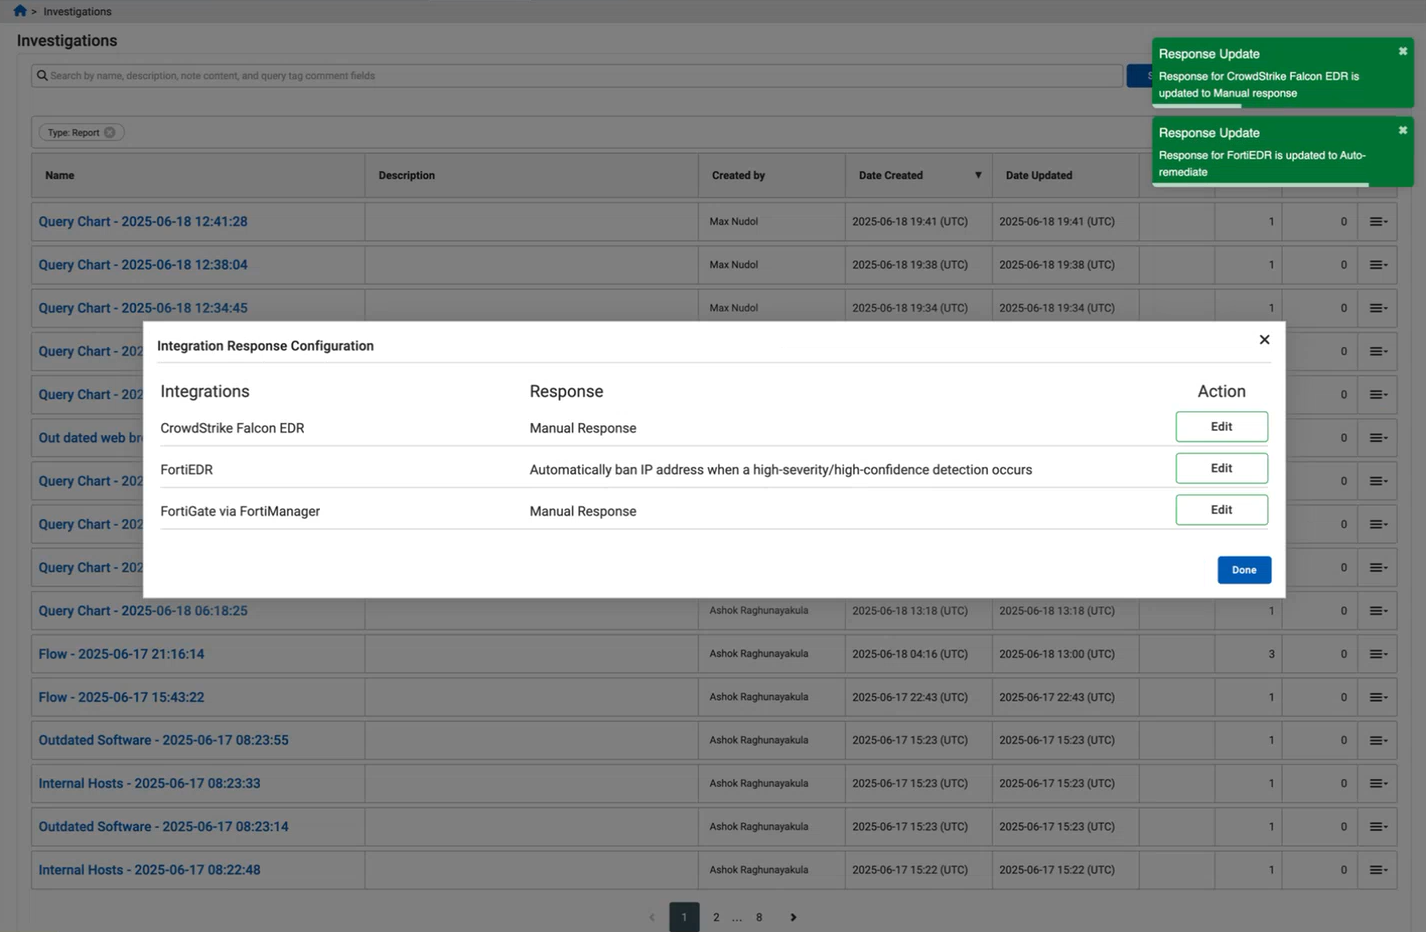
Integrations can also be configured from the Account Management > <account> > Modules page.
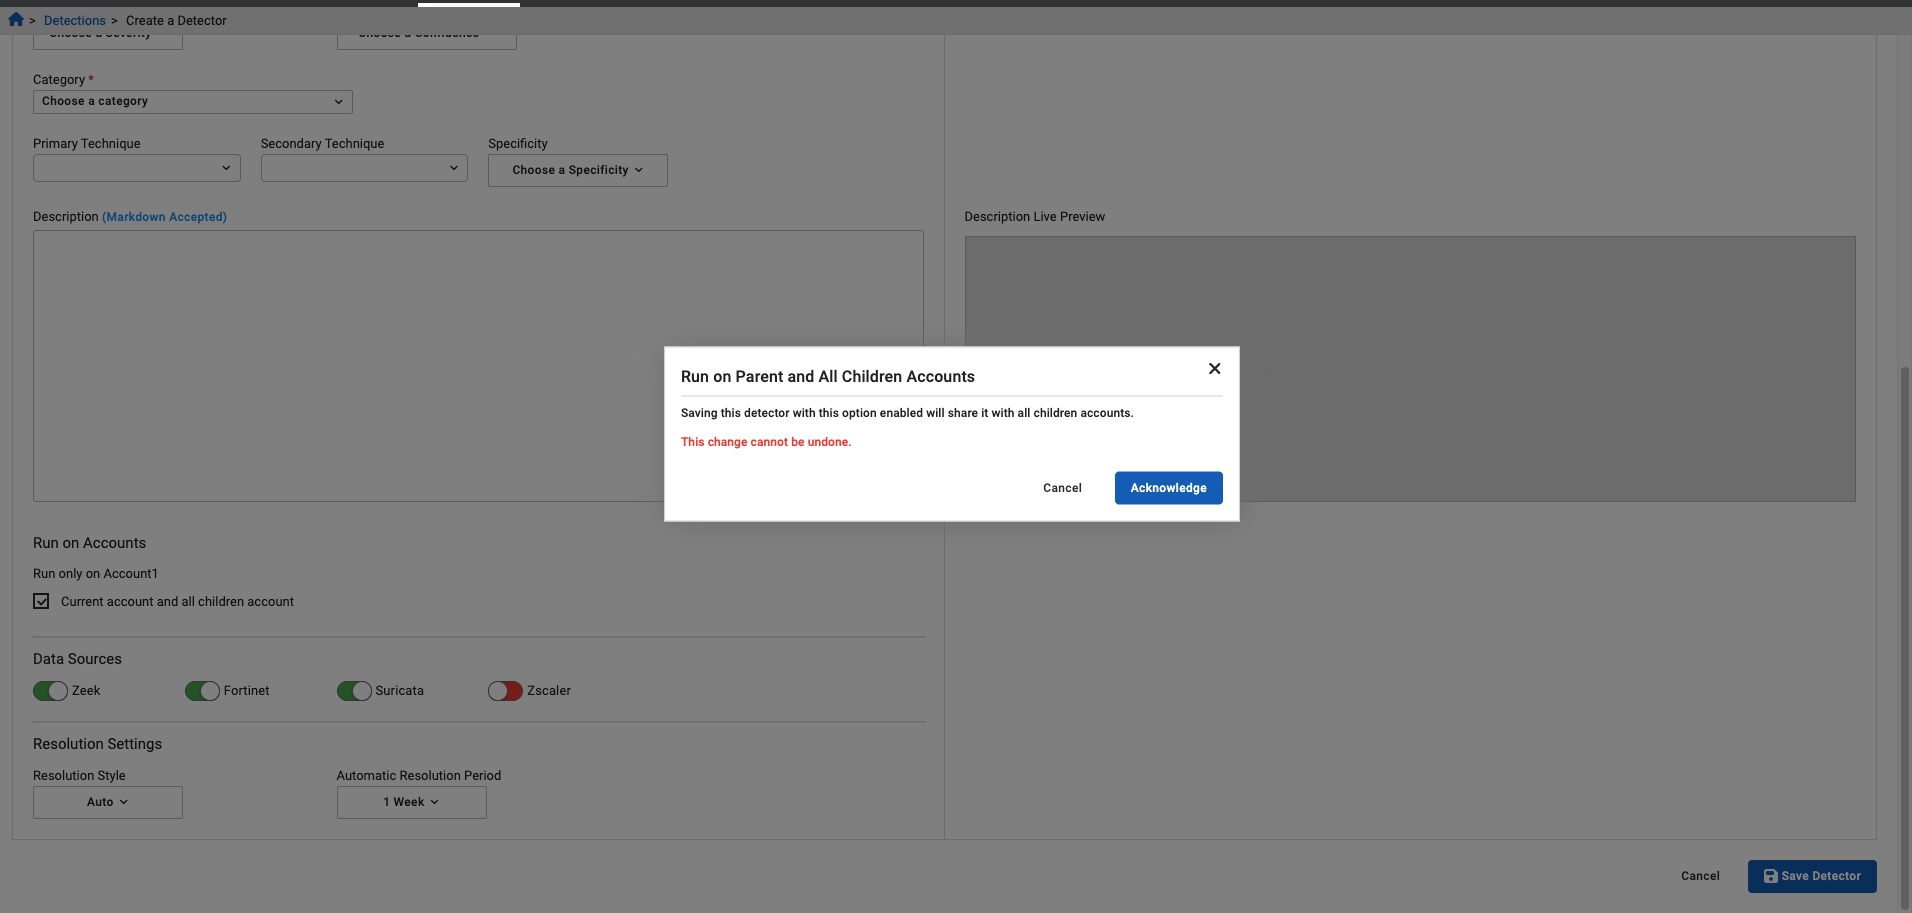
Share detectors with other accounts
When creating a detector on a parent account, you have the option to run the detector on the current account and child accounts by enabling the Current account and all children account option. Note that this cannot be undone.
On a child account, when you create a detector, it can run on the current account or it can be moved to the parent account and run on the parent and all children accounts. Note that this selection also cannot be undone.
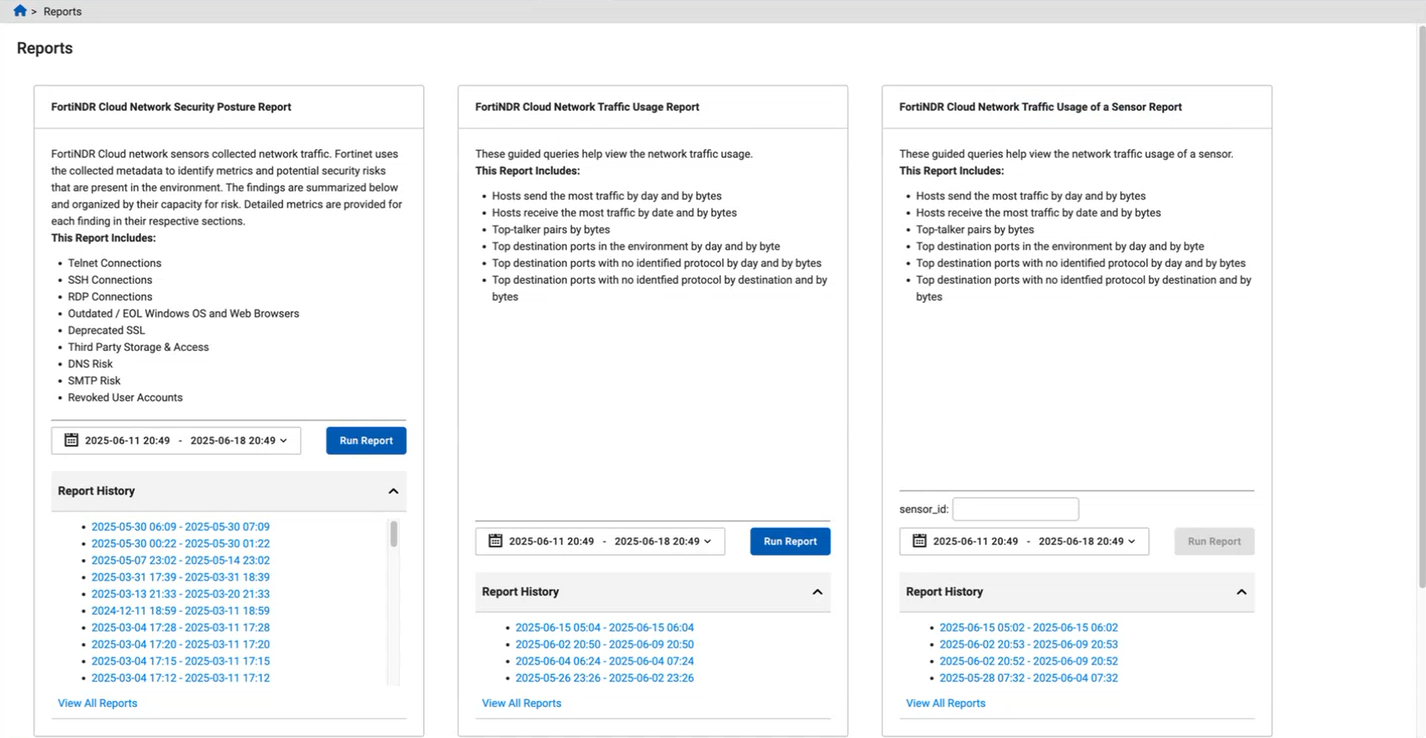
Network Traffic Usage reports
Two new reports are added for network traffic usage of an account and network traffic usage of a specific sensor over the past billing cycle (by default).
The reports include:
-
Hosts send the most traffic by day and by bytes
-
Hosts receive the most traffic by date and by bytes
-
Top-talker pairs by bytes
-
Top destination ports in my environment by day and by bytes
-
Top destination ports with no identified protocol by day and by bytes
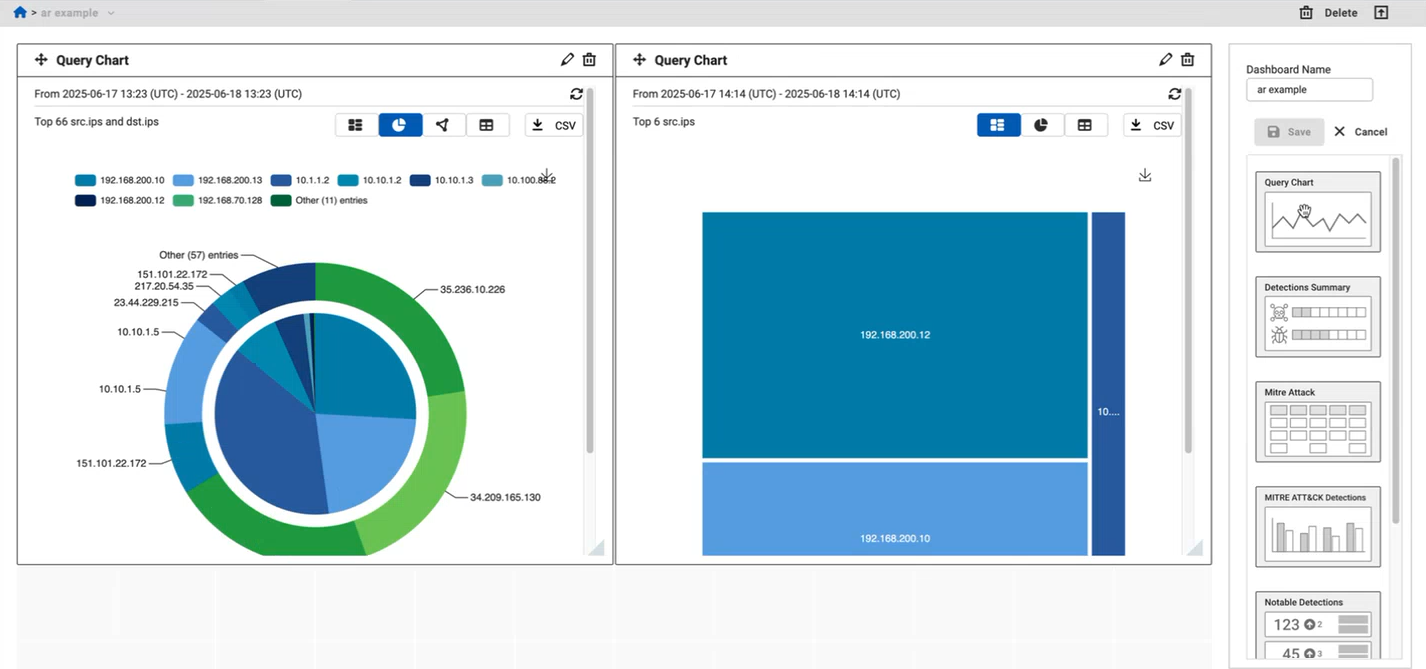
Query chart widget
A Query Chart widget can be added to the dashboard. Saved group by queries from the investigations can be added to the widget, the time range can be selected, and the widget can be given a custom Name. Different types of charts or a table can be selected to display the data, and a CSV file can be downloaded. The refresh button must be clicked to refresh the data.
Click on the widget title to go the underlying query object and view the particular events for that investigation.
Improved functionality
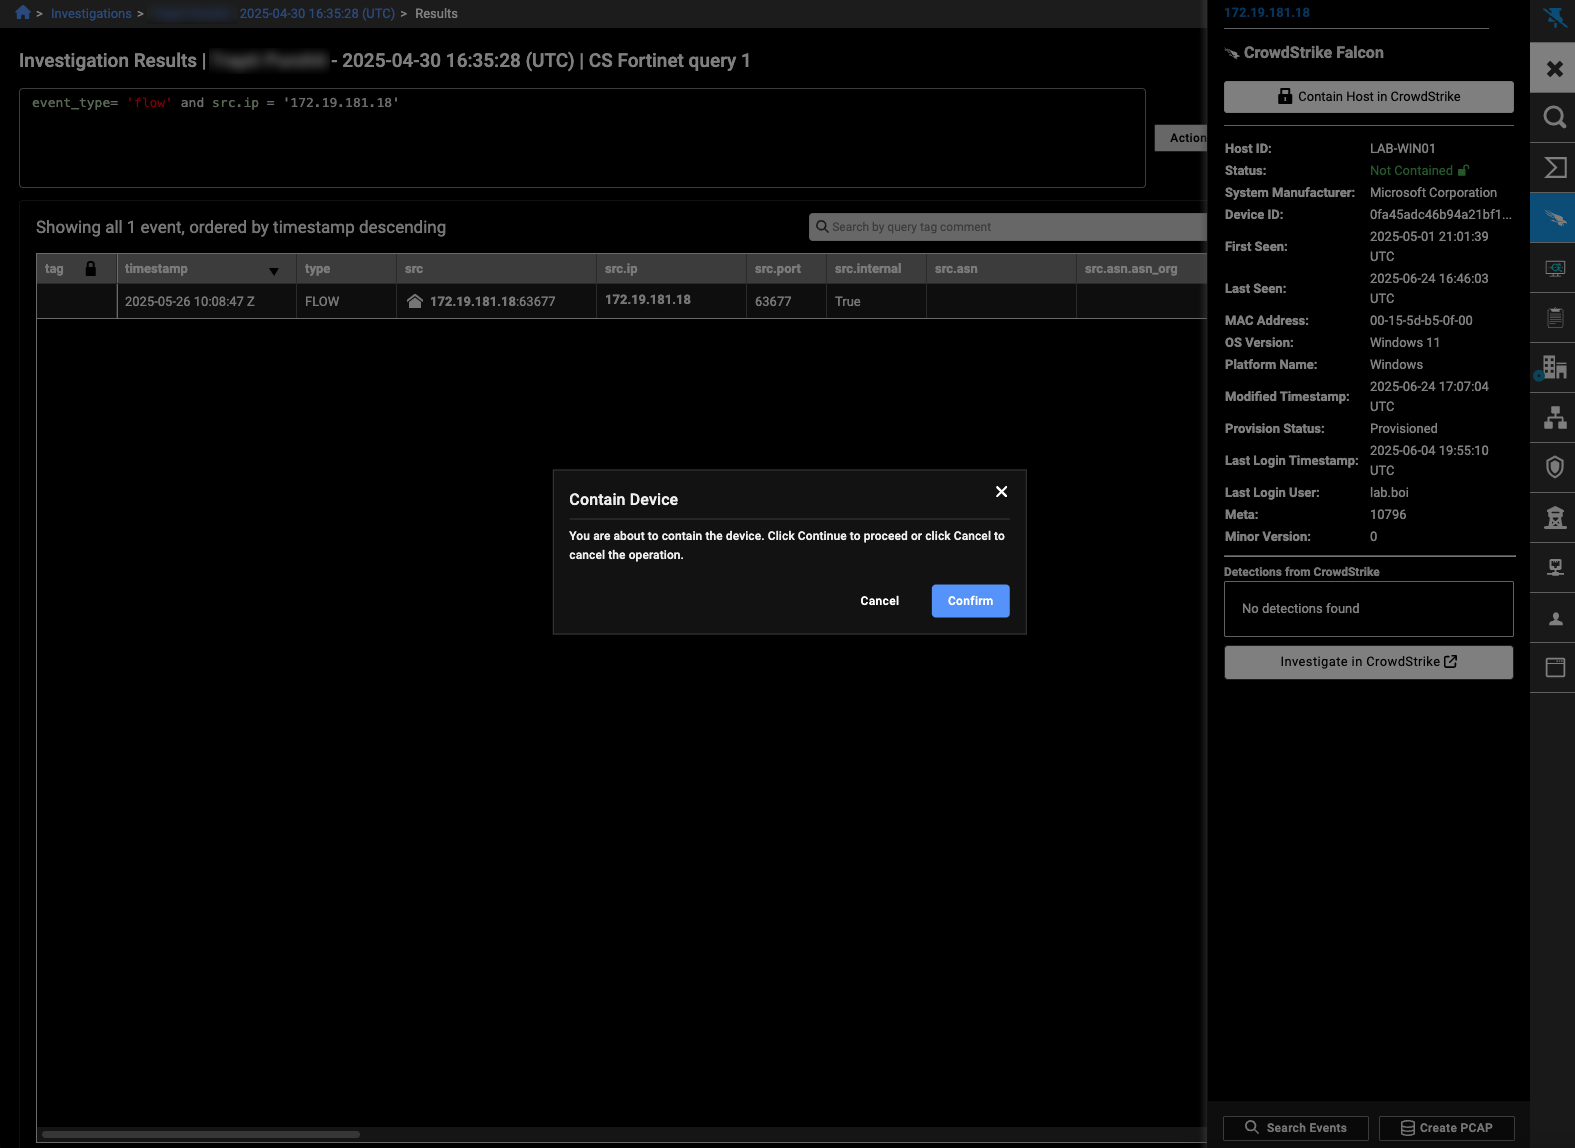
Manage endpoints in the Entity Panel
The entity panel shows the current status of the device, and includes a button to contain, isolate, or ban the endpoint.
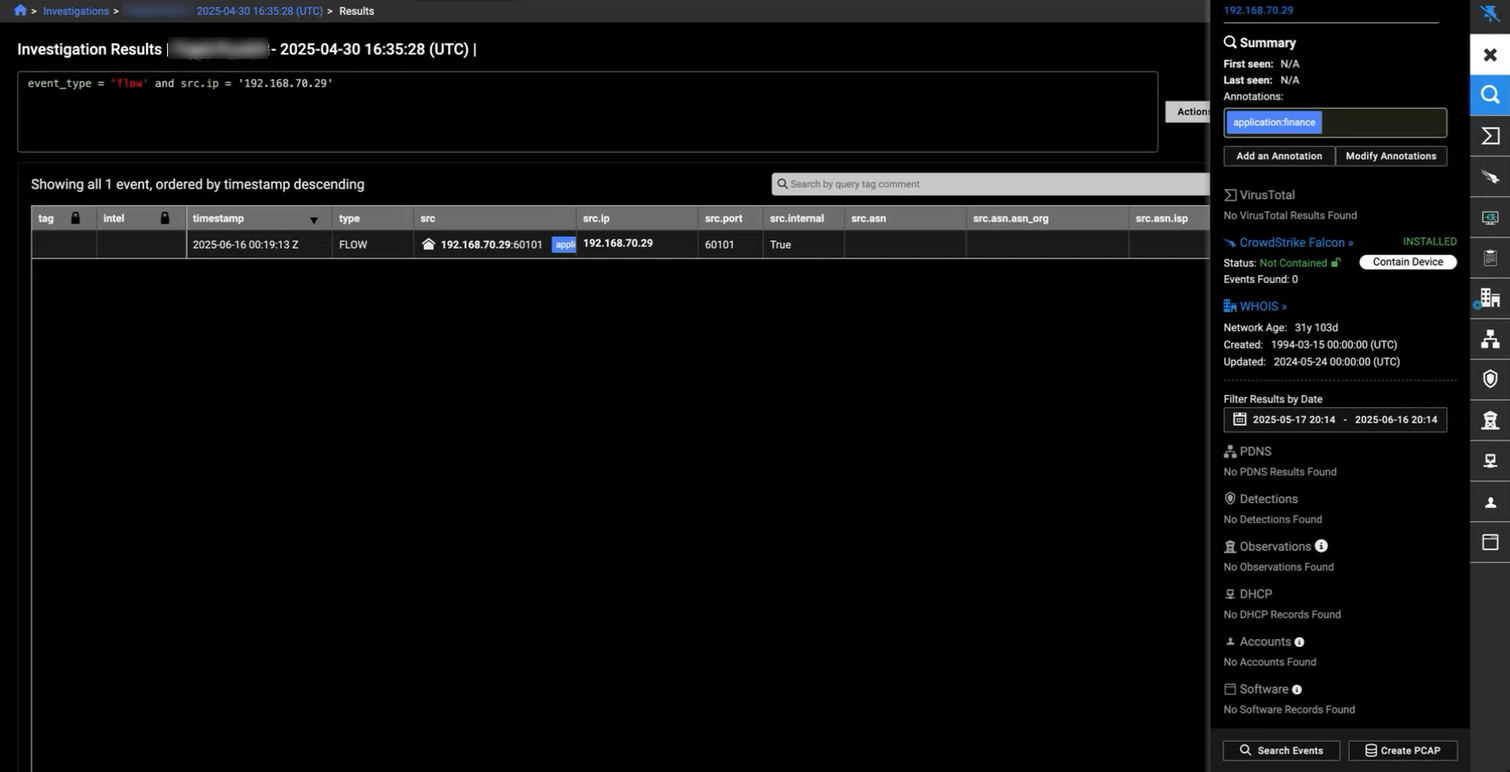
The button on the device panel is also moved to the top of the panel, and a confirmation box is shown when containing, isolating, or banning the endpoint.
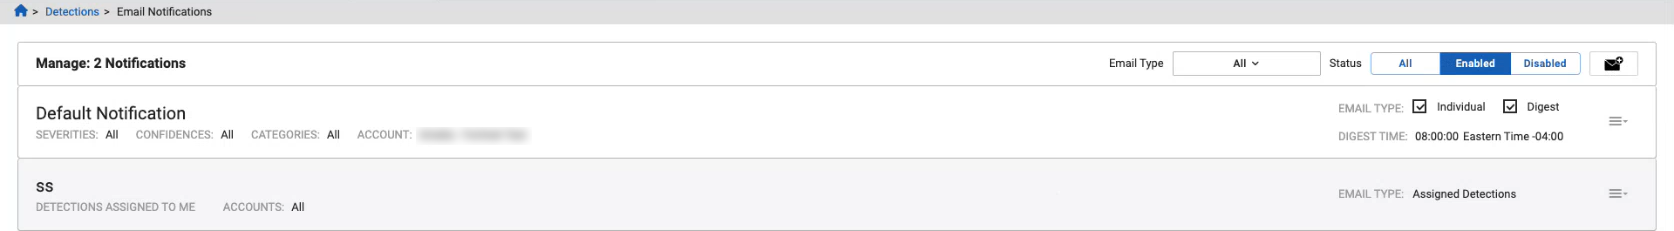
Assigned detections notifications
The Detections > Email Notifications page is a single, scrollable list, without the need to select how many rows are shown.
When adding a new notification, you can choose to add a New Detections or Assigned Detections.
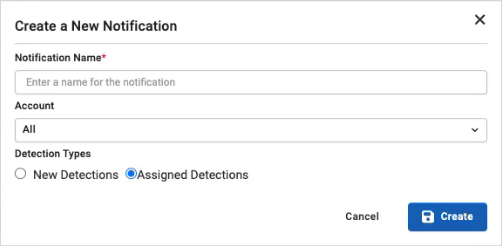
New Detections is the current functionality. When Assigned Detections is selected, an email notification will be sent to the user that it is assigned to and they will see the detection as Assigned to me.
When a detection is assigned to you, or you assign one to yourself, you receive an email to let you know that the detection has been assigned.
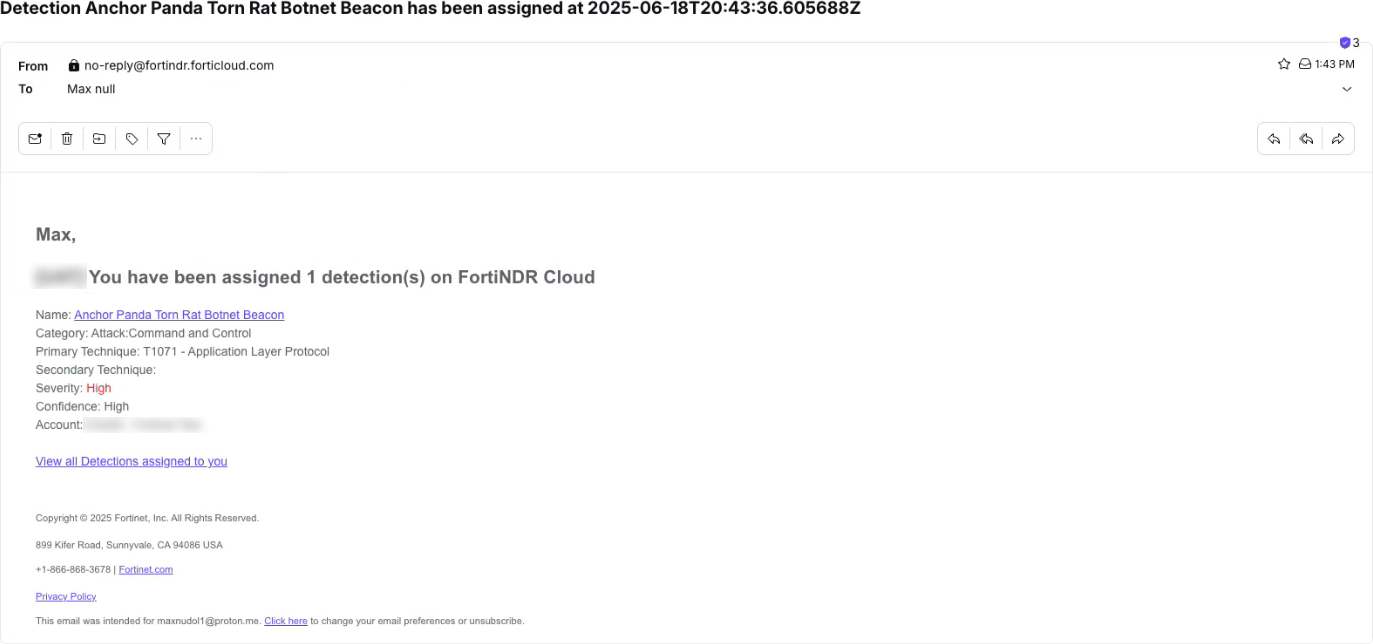
Clicking the detector name link in the email takes you to that detector's page.
Clicking the View all Detections assigned to you link in the email will takes you to the Detections Table page, showing all of the detections that you have been assigned.
Other improvements
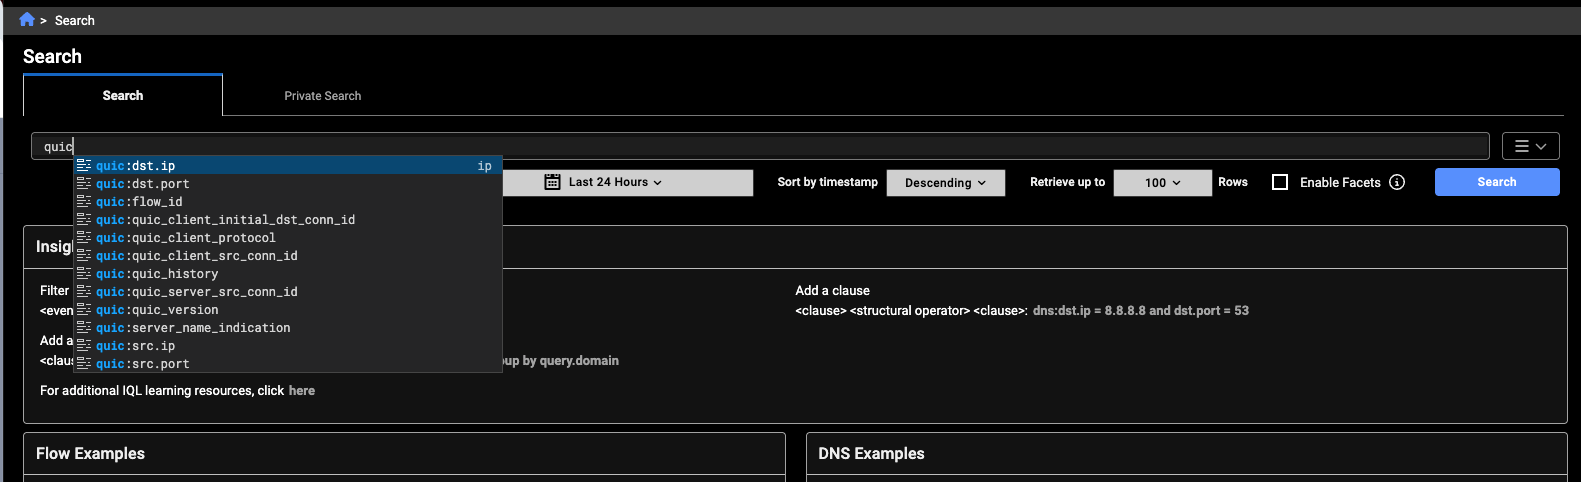
Event fields
You can now query QUIC events.
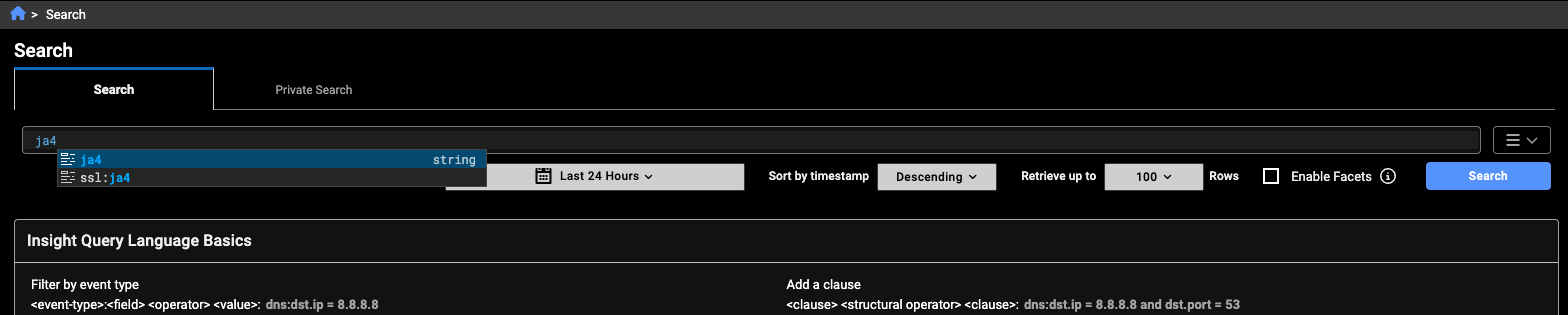
The ja4 field has been added to SSL events.
Scrollable Account list
On the Account Management page, the account list is shown as a single, scrollable list, without the need to select how many rows that are shown.
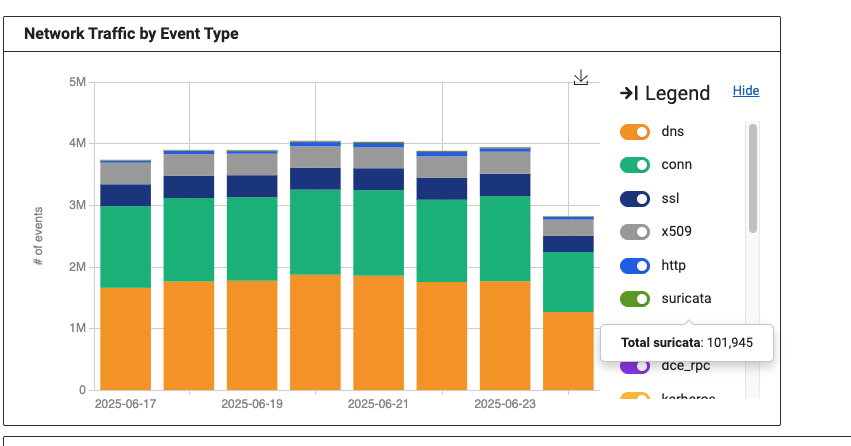
Network Traffic by Event Type widget improvements
The Network Traffic by Event Type widget includes a selectable legend with multiple colors to make it easy to differentiate between the event types.
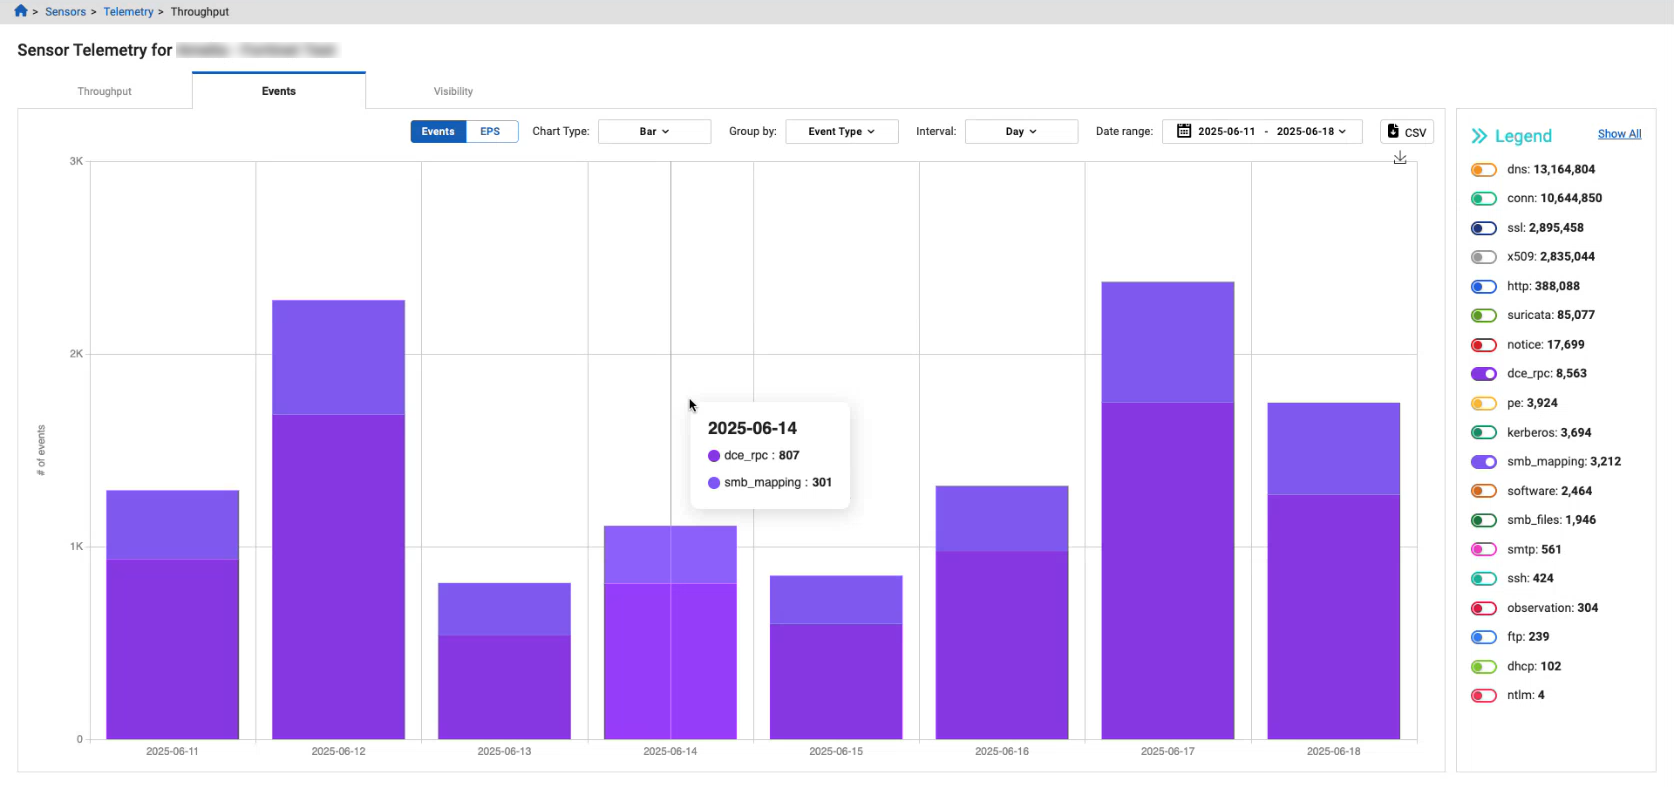
Sensor telemetry legend
The legend has multiple colors to make it easy to differentiate between the event types, and the event types stay in the same order when switching between Events and EPS views.
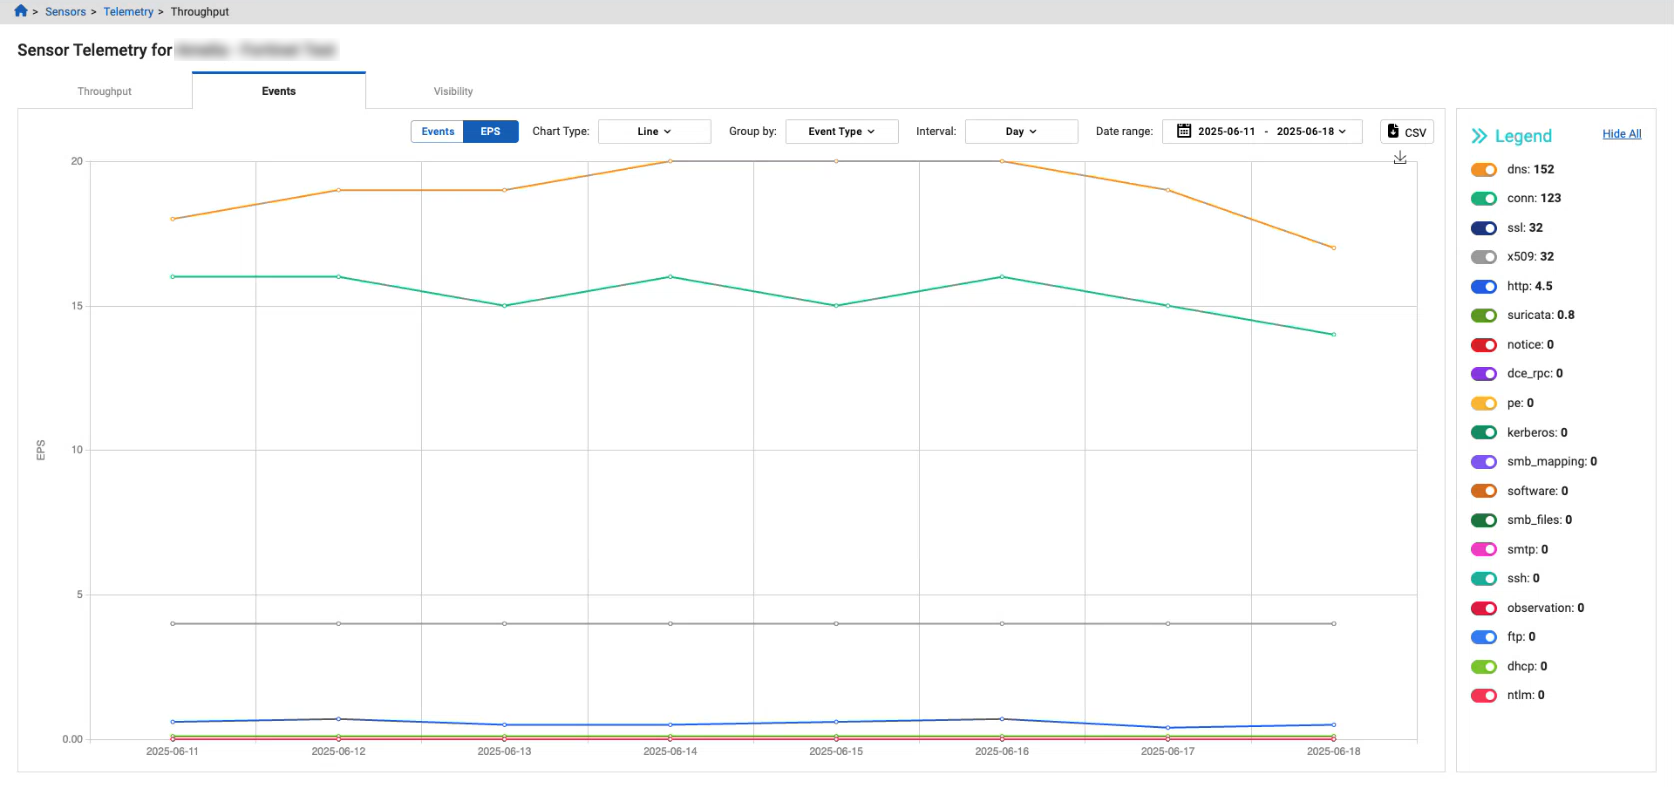
Sensor telemetry
You can now download the data in the Sensors detail page as a CSV file. The CSV file will download everything in the graph. You can use the legend to select the sensor data that you want to download.
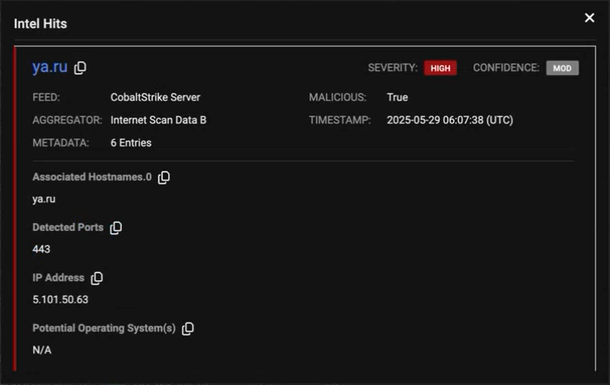
Intel hits dialog
The general fields and additional information are separated into two sections. Clicking the indicator in the title will open the Entity Panel.
Group Detections by sensor
A new filter is added to the Detections page, allowing multiple sensors to be selected.
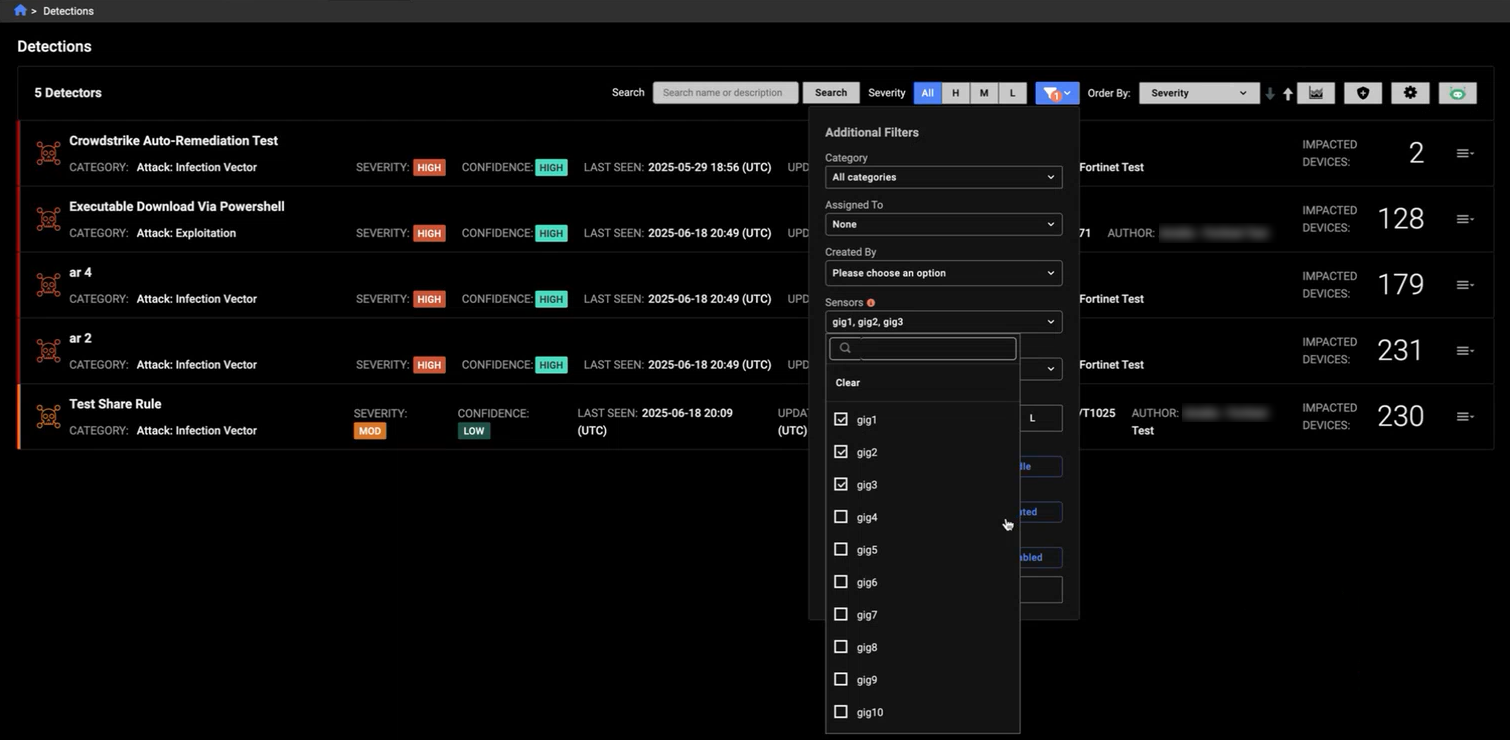
The new filter is also added to the Triage Detections and Detections Table pages.
Note that observations will only identify a single sensor even if activity from multiple sensors was taken into account in producing the observation.