Observation details
The Observation Details page provides detailed information about a selected observation. It includes a graph showing the frequency of occurrences and a table listing up to 1,000 recent instances.
- Use the date picker to view behavioral observations for any 90-day period within the past year.
- To view observation details for a device, enter the IP in the Device to search field.
- To filter the page by Confidence, select All, H, M, or L (Low, Moderate, or High).
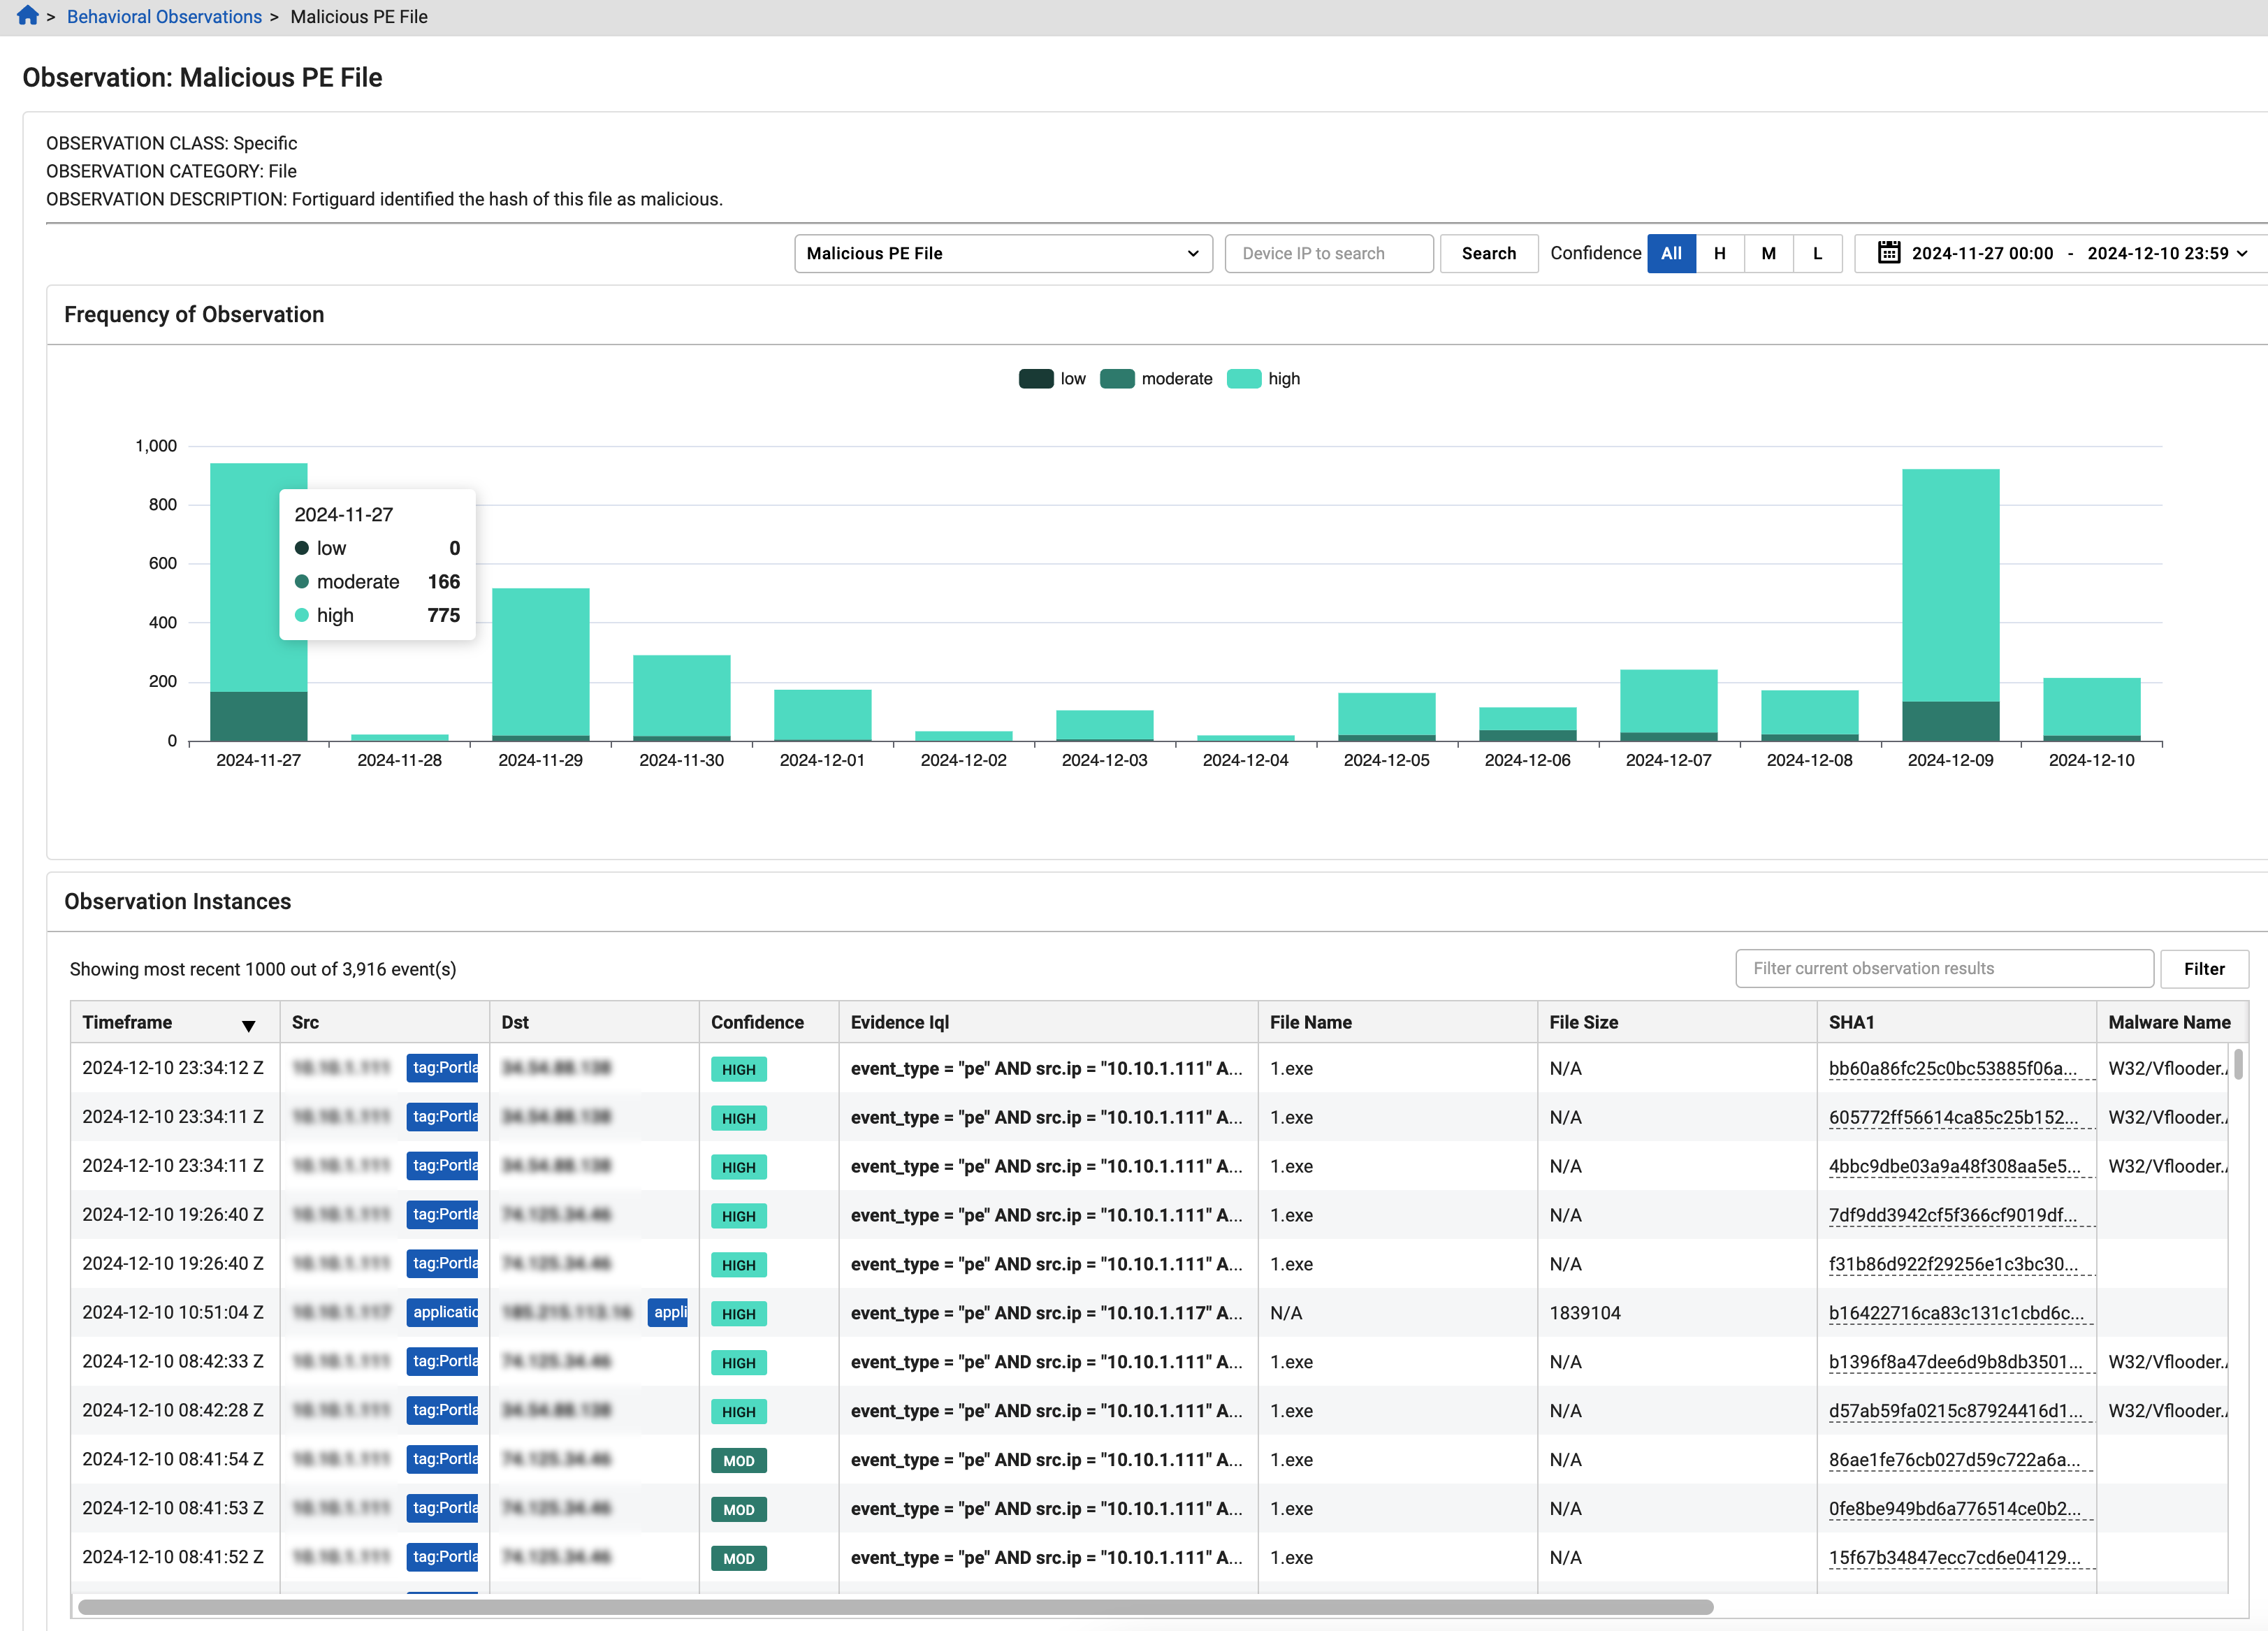
Frequency of observation graph
The Frequency of Observation graph shows how often a specific observation has occurred over time, categorized by confidence level.
- Hover over the graph to view the number of instances by confidence level.
- To filter the table, click a confidence level (Low, Moderate, or High).
- Click on a bar in the graph to apply its time range and confidence filter to the page.
- Hover over a confidence level at the top of the graph to isolate it.
Observation instances table
The Observation Instances table displays the most recent instances for the selected observation, up to 1,000 entries.
- Click any column header to sort the table by that column.
- To refine the table, enter a search term in the Filter current observation results field and click Filter.
Observation selector
Use the observation selector at the top-center of the page to switch between different observations available for your account.