
Version 25.4.a
New functionality
Natural Language Queries
Natural Language (NL) Queries allow you to use simple statements for investigations and private searches as an alternative to the Internal Query Language (IQL). You can start an NL query from the Investigations or Private Search pages. Note: NL queries currently do not support all event types. For more information, see Natural Language Queries.
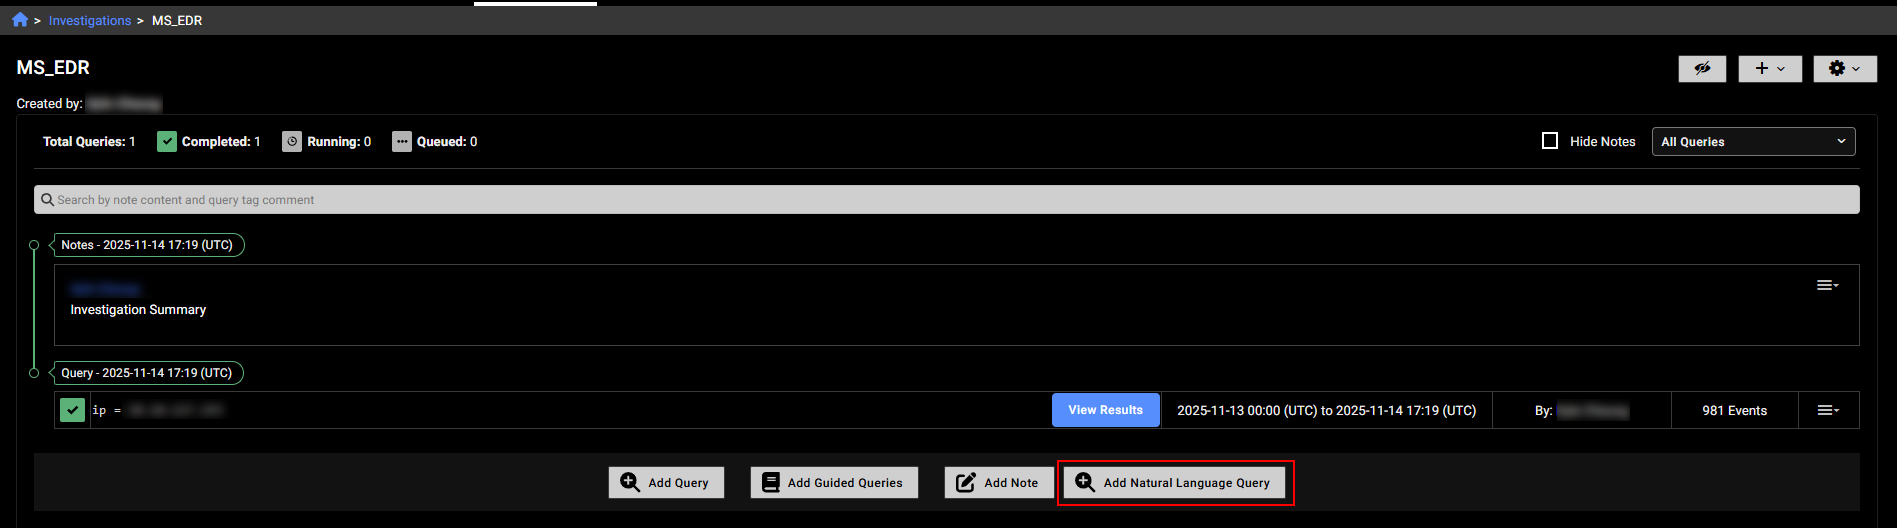
To use an NL query in an investigation, click the Add Natural language Query button the investigations details page.
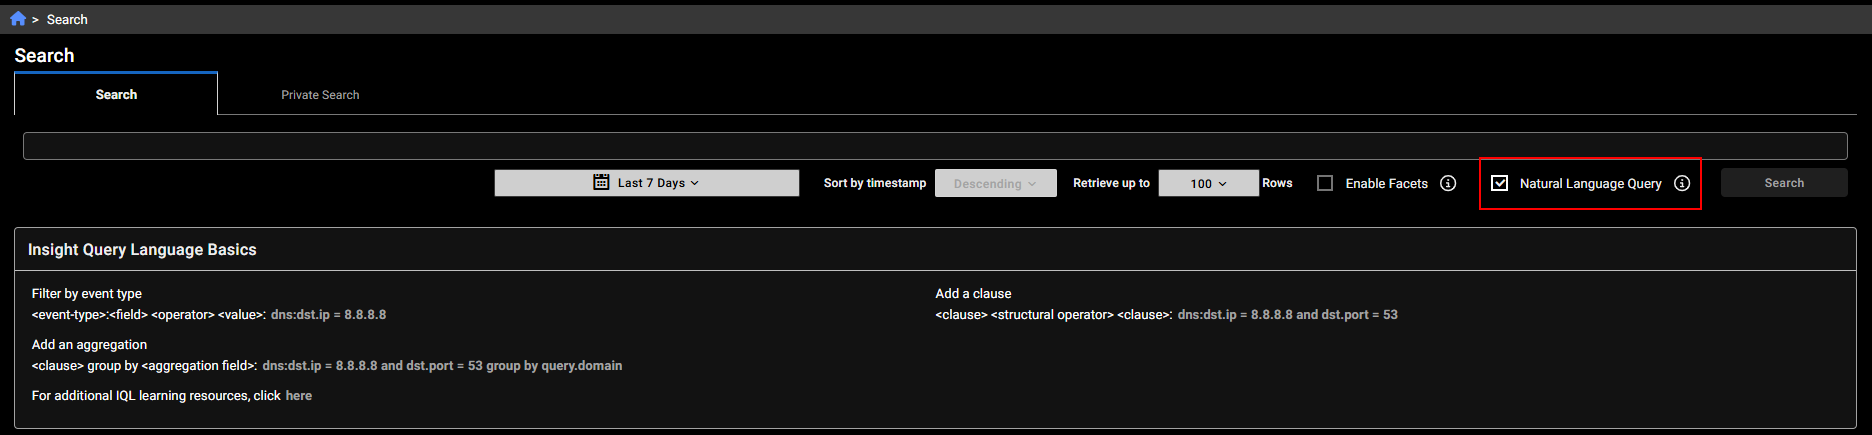
To use an NL query in Private Search, enable Natural Language Query at the top of the page.
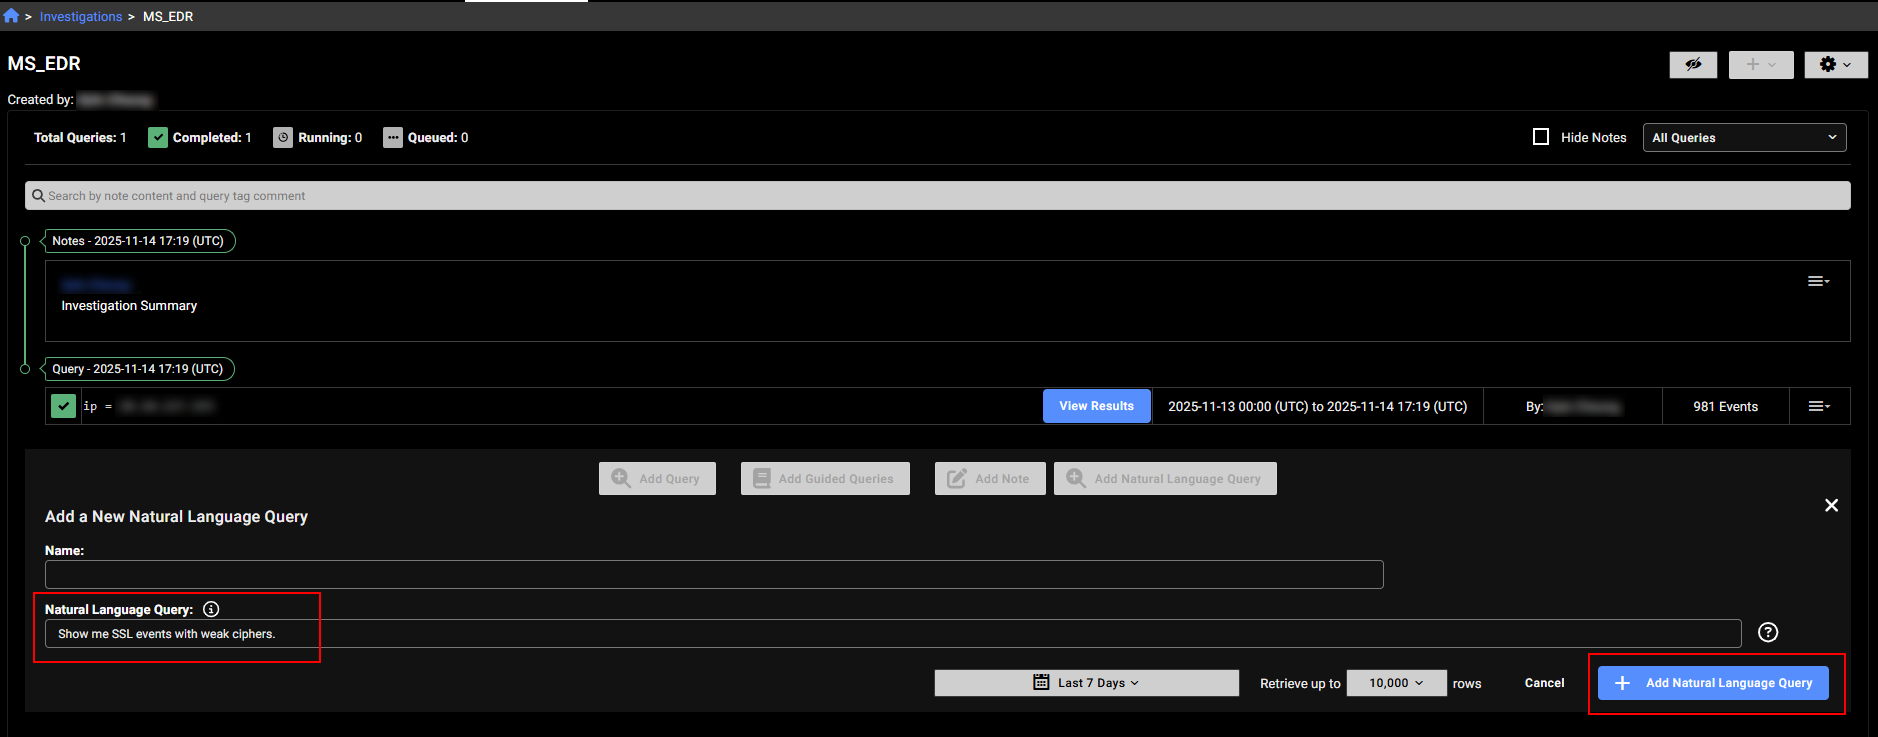
Enter a query string such as Show me SSL events with weak ciphers in the search field and click Search or Add Natural language Query depending on the page you are in.
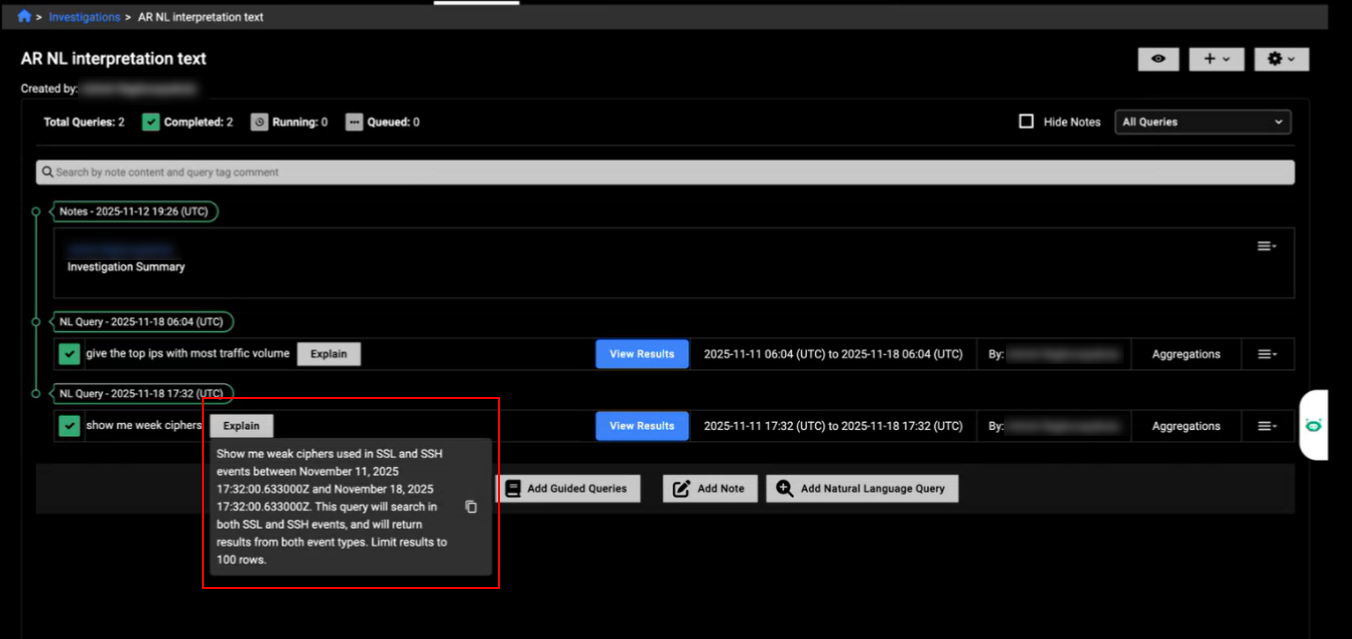
The Explain button next to the query results displays how the system interpreted your request and the queries it executed. You can copy this explanation and edit it to refine your queries. The Explain button is also available in Private Search.
FortiAI
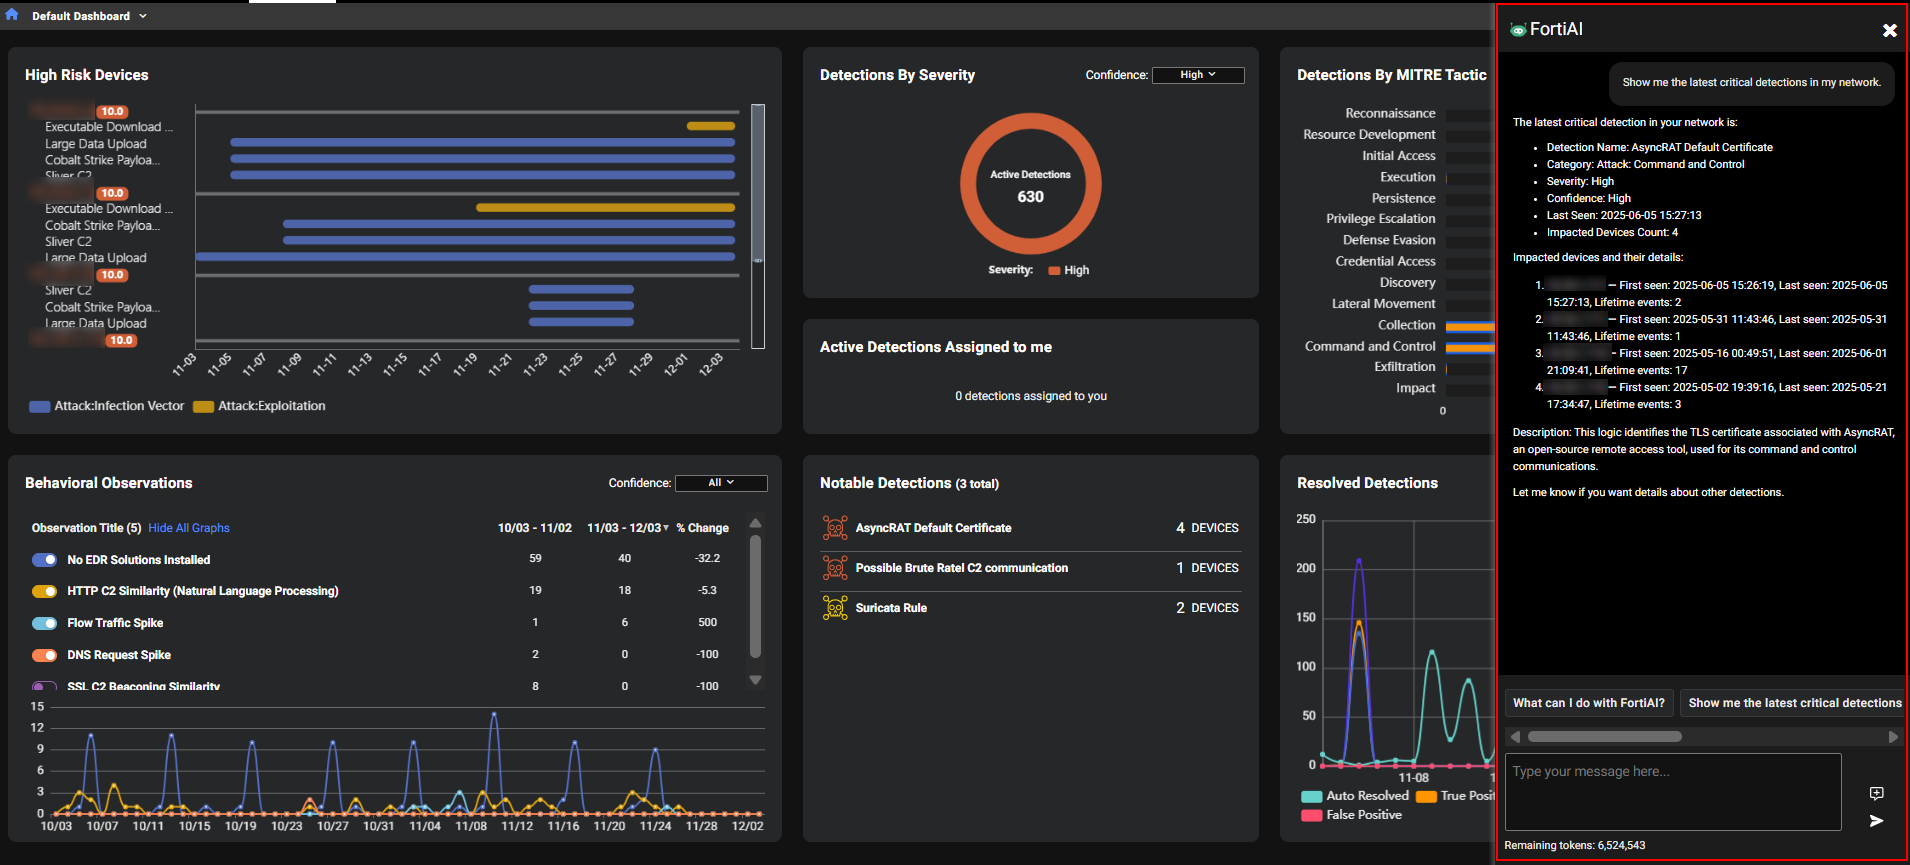
FortiAI in FortiNDR Cloud is Fortinet’s generative AI assistant designed to accelerate threat investigation and improve visibility into network activity. Integrated into the FortiNDR portal, FortiAI allows administrators to interact in natural language and receive precise, context-aware insights about detections, understand which threats and behaviors are being monitored, and generate detailed entity reports with historical context through intuitive, conversational queries.
FortiAI requires a valid license and operates on a token-based entitlement system, where each query consumes tokens based on complexity and response length.
Fortinet requires customers to opt in to use FortAI features. Once enabled, administrators must assign roles to specific users who need access to FortAI. If the organization has child accounts, FortAI must be enabled individually for each child account.
For more information, see FortAI.
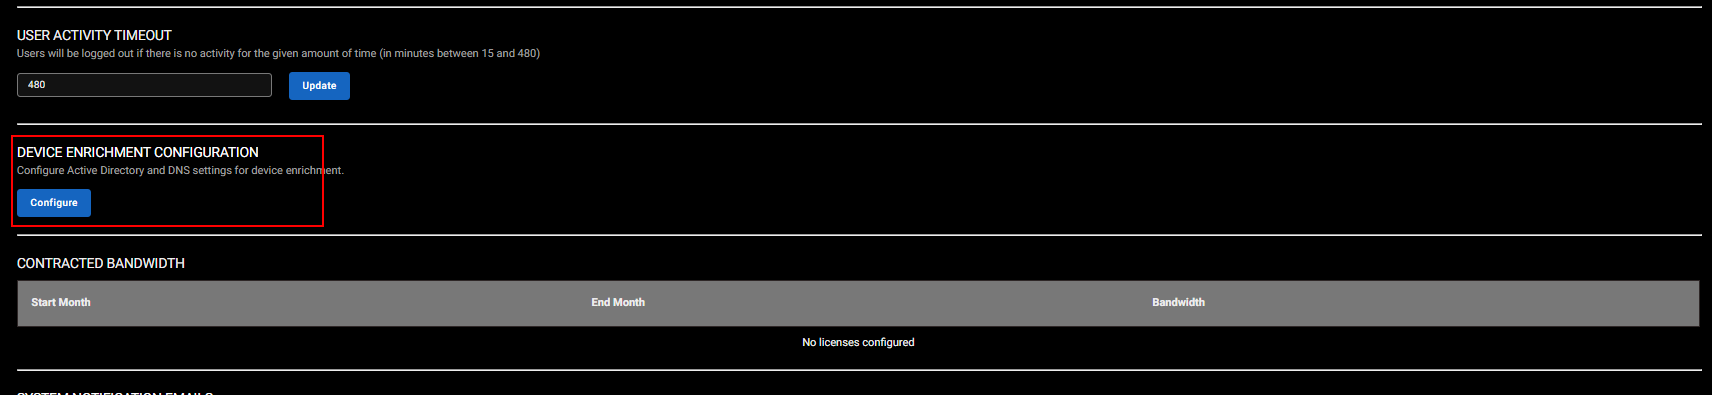
Device enrichment
You can now enhance device identification using Device Enrichment. When configured, it retrieves hostname information from Windows Active Directory (AD) and DNS servers in the target network. Once enabled, the enrichment process runs on the schedule defined in the enrichment settings.
After a cycle completes, the process schedules the next cycle based on the profile settings. If the current cycle is still running when the next scheduled cycle is due, the system skips that cycle.
Only one sensor can be used for Device Enrichment per account. Device Enrichment requires sensors running 2.4.0 or higher.
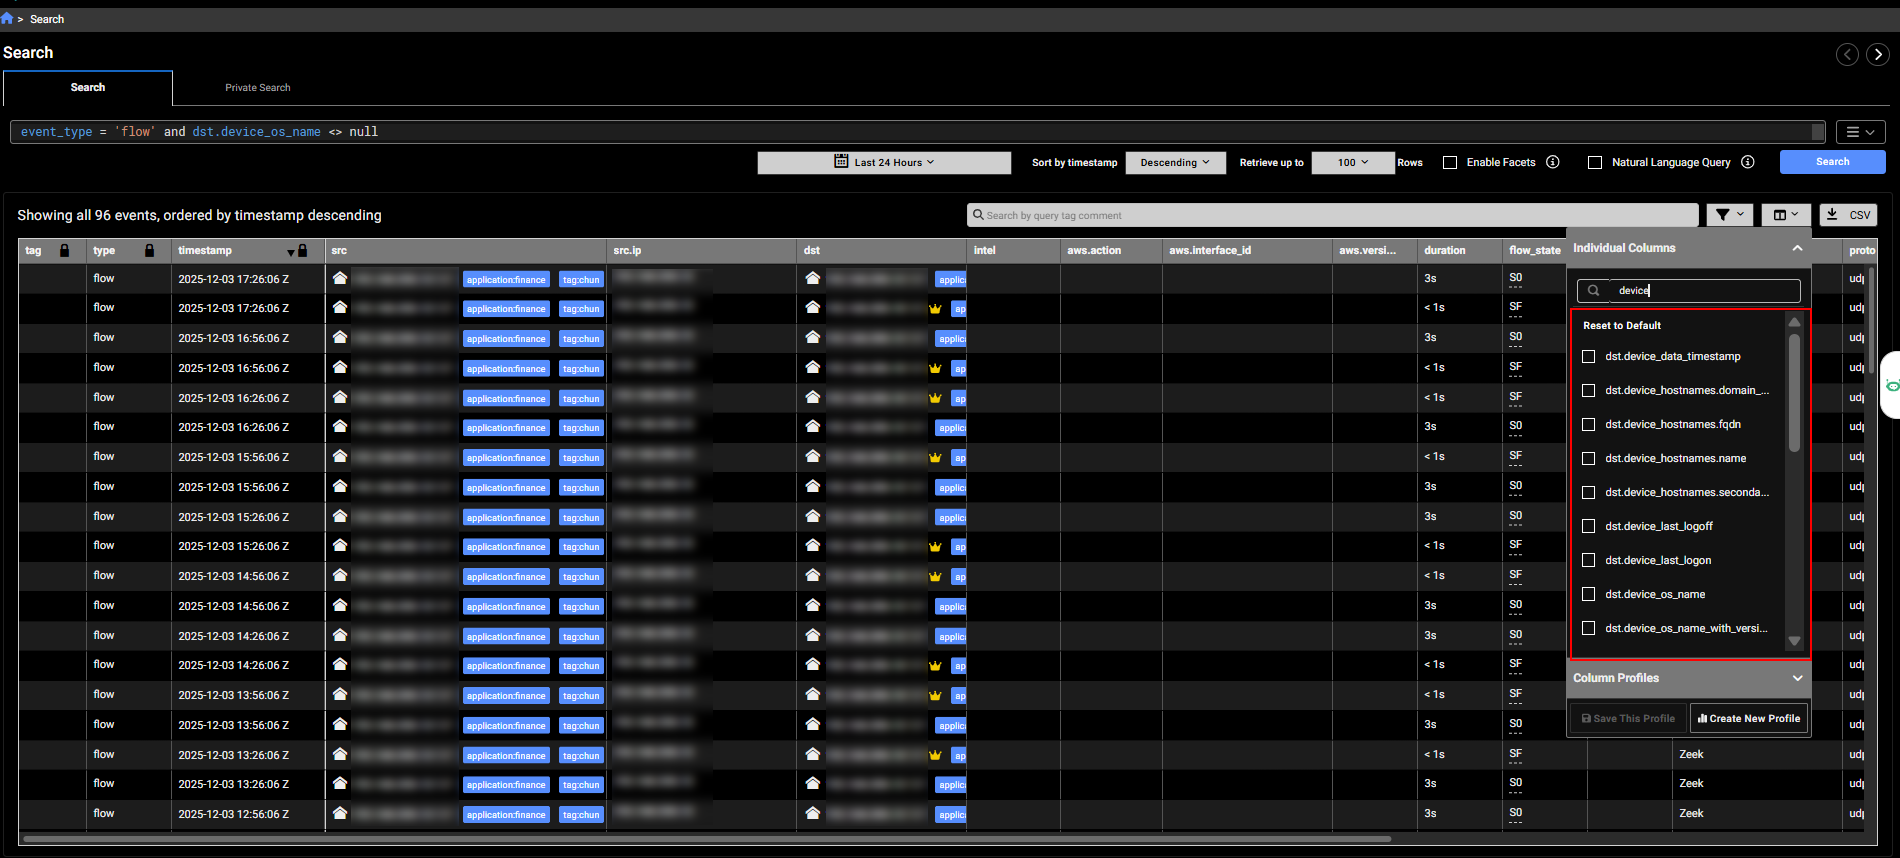
Once the profile is configured, it retrieves a list of devices and their names, performs DNS queries to resolve corresponding IP addresses, and sends detailed information for each device, including its name, IP address, operating system, and other attributes.
The fields related to the new newly added by Active Directory injection enrichment start with device underscore.
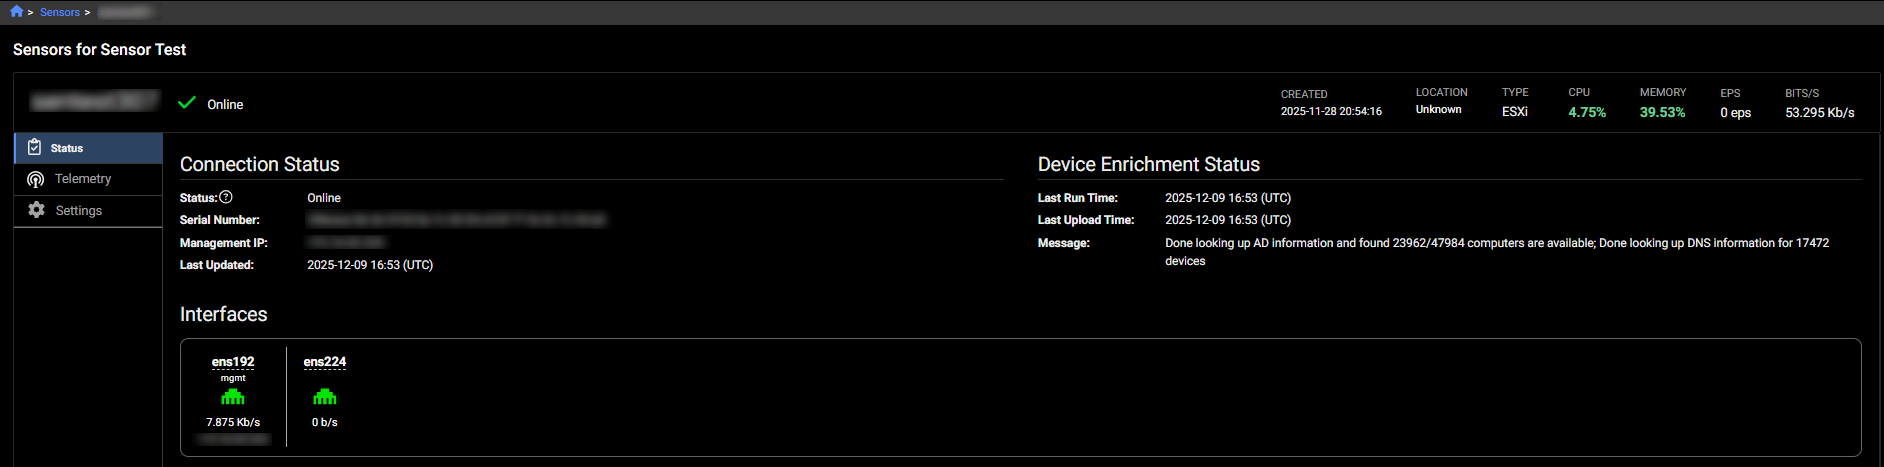
The sensor's details page displays the Device Enrichment Status.
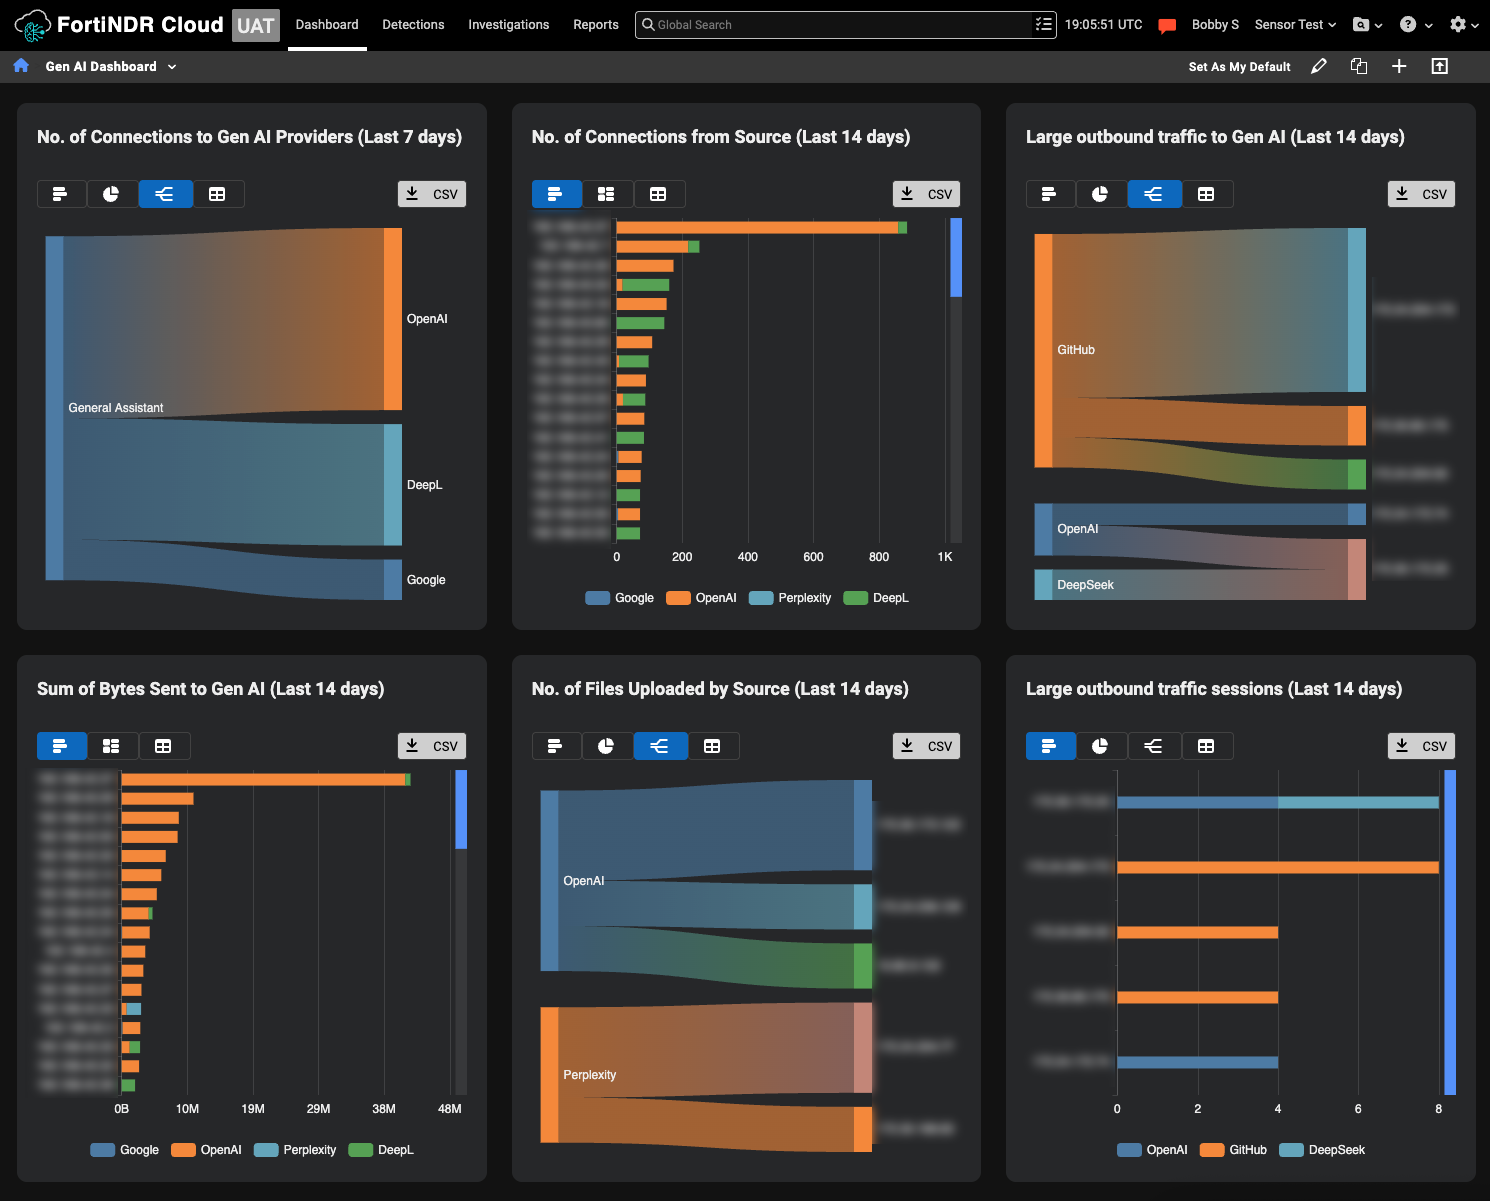
Gen AI Dashboard
The Gen AI Dashboard provides a centralized view of generative AI usage within your organization, helping analysts identify unauthorized activity, detect potential data exfiltration, investigate anomalies with full device and detection context, and align AI activity with the organization's security policies.
The widgets consolidate all observation details from FortiNDR Cloud into a single view, giving analysts visibility into AI usage across the organization. This unified perspective is useful for identifying patterns and anomalies by turning raw observations into actionable insights, enabling faster, more informed investigations.
You can use the widgets in this dashboard to track which AI providers are accessed and by which devices and identify large uploads and frequent connections that may indicate risky behavior.
The dashboard contains the following widgets:
|
Widget |
Description |
|---|---|
|
No. of Connections to Gen AI Providers |
Tracks the number of connections and provider type for the last 14 days. The widget also identifies which generative AI is a General Assistant and a Coding Assistant. |
|
No. of Connections from Source |
Shows which IPs connect to which providers and the number of connections to AI providers for the last 14 days. Click on the IP address to open the Entity Panel. Hovering over the bar opens a tooltip that connects to the Observation Details and Detection Context. |
|
Large outbound traffic to Gen AI |
Displays size of large outbound transfers for the last 14 days. Click the IP to open the Entity Panel. Hover over the lines in the chart to see details about the upload. |
|
Sum of Bytes Sent to Gen AI |
Aggregates data volume per IP and provider for the last 14 days. The data is sorted highest to lowest to identify top uploader IP address. Hovering over the bar opens a tooltip that connects to the Observation Details and Detection Context. |
|
No. of Files Uploaded by Source |
Counts files sent to AI services for the last 14 days. |
|
Large outbound traffic sessions |
Monitors connection frequency of large outbound connections. Hovering over the bar opens a tooltip that connects to the Observation Details and Detection Context. |
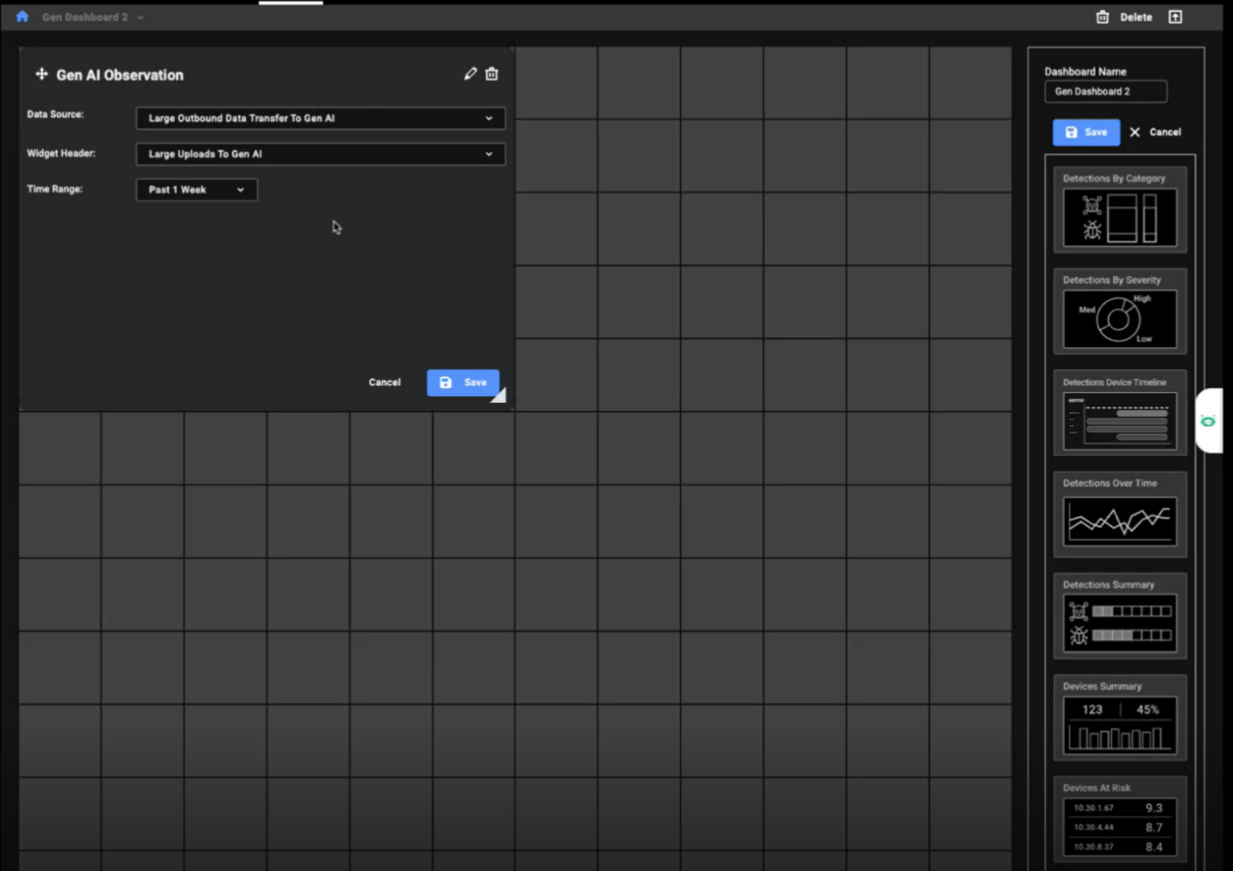
You can also create a custom dashboard based on the Gen AI widgets.
Improved functionality
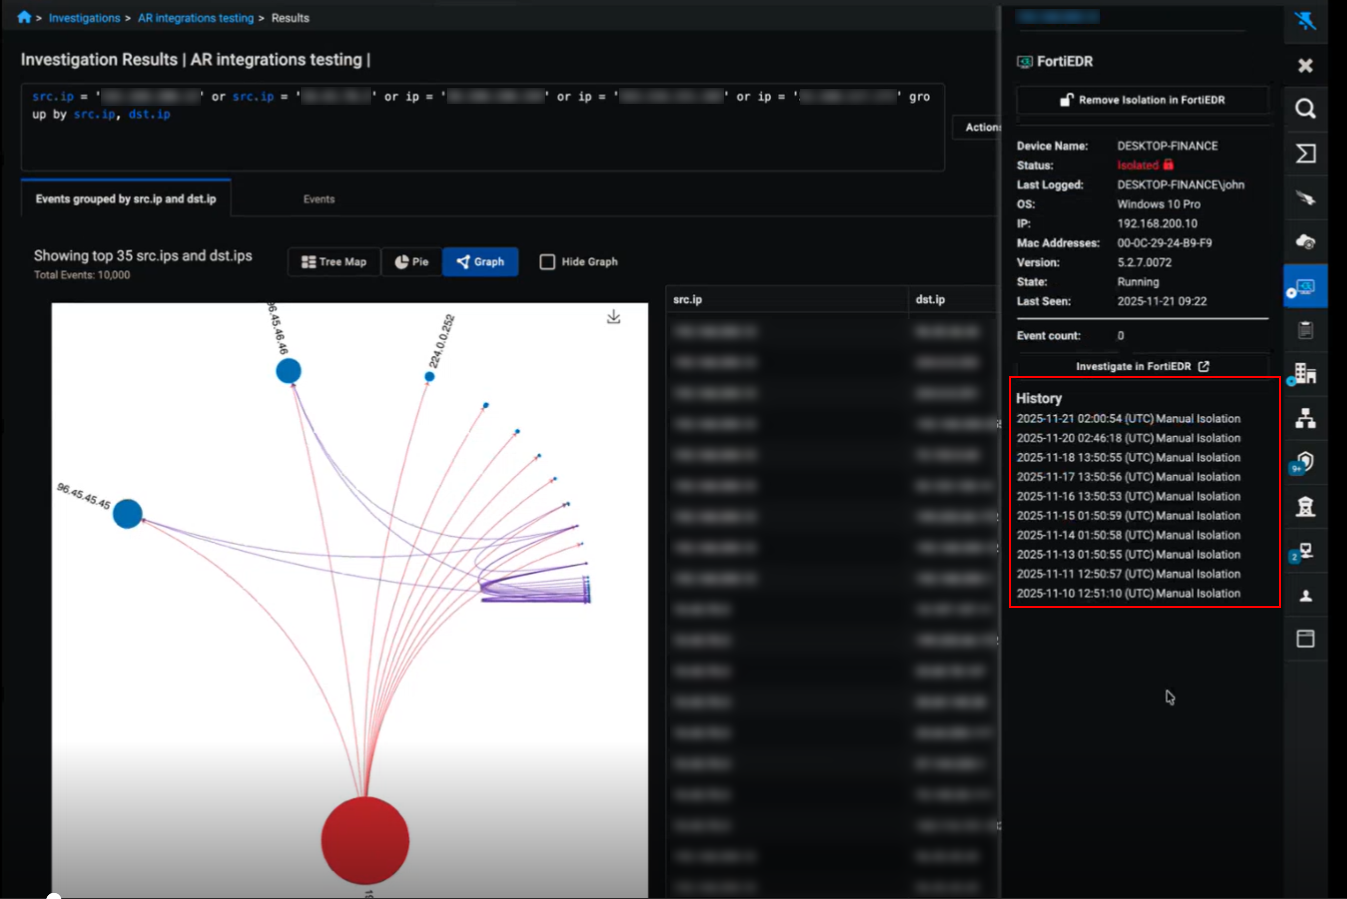
Entity panel
The Entity Panel now displays the history of actions performed on a device for CrowdStrike, EDR, and FortiManager integrations. These actions include manual isolation, automatic isolation, and removal of isolation. The list shows up to 50 of the most recent actions. Actions triggered by the Fortinet Automation Service appear in the Fortinet Automation Service tab.
Sensors page
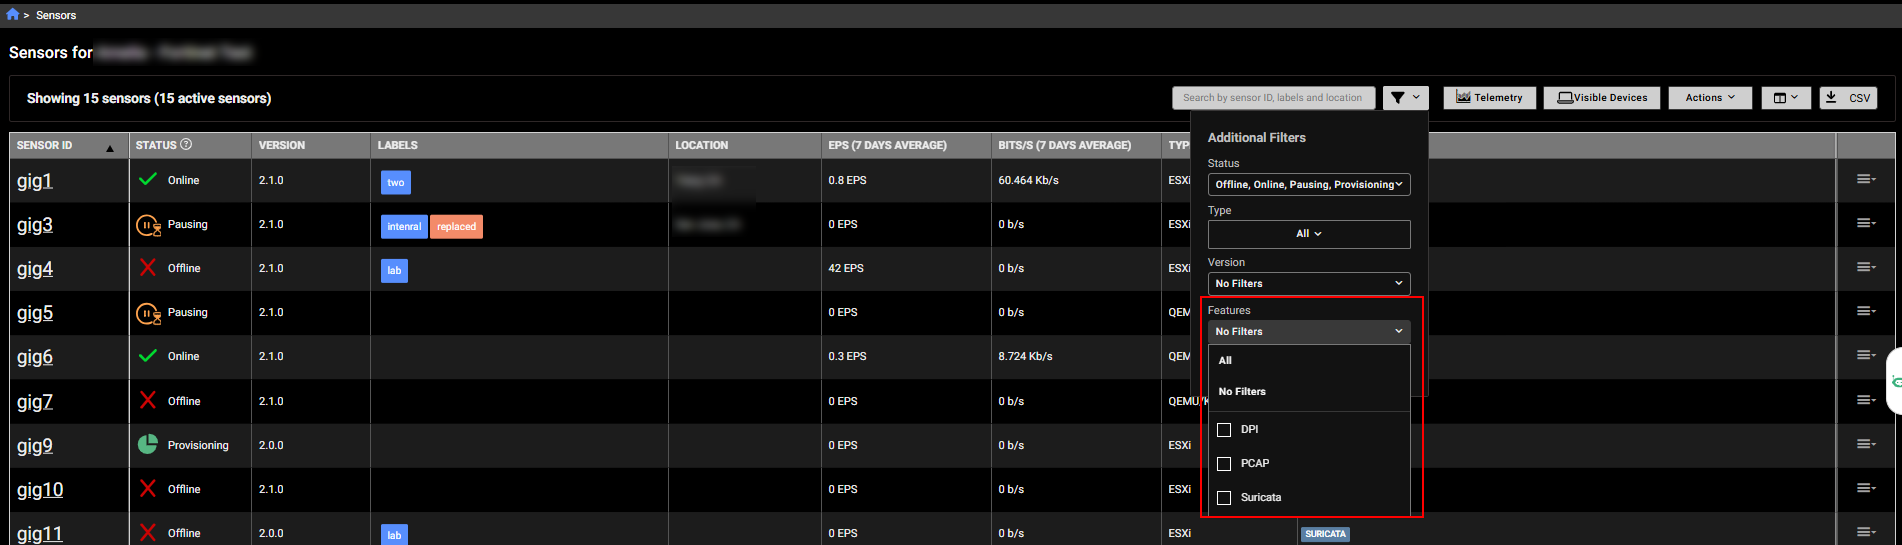
The Sensors page now includes a Features column that lists the enabled tools used to analyze network traffic and detect anomalies, such as Suricata, PCAP or DPI.
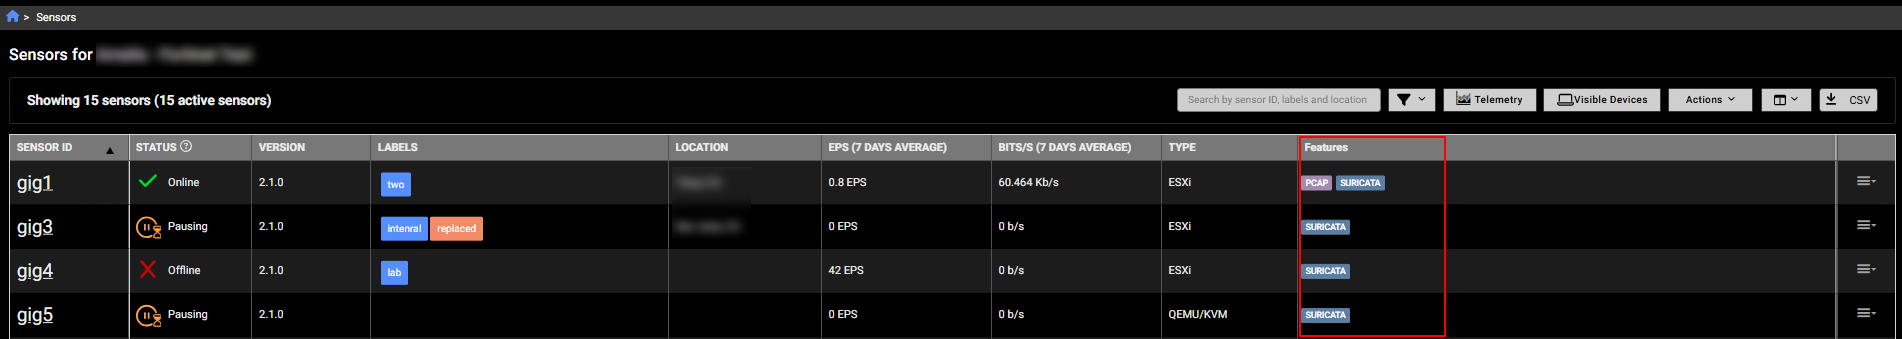
A corresponding Features filter was also added to the page.
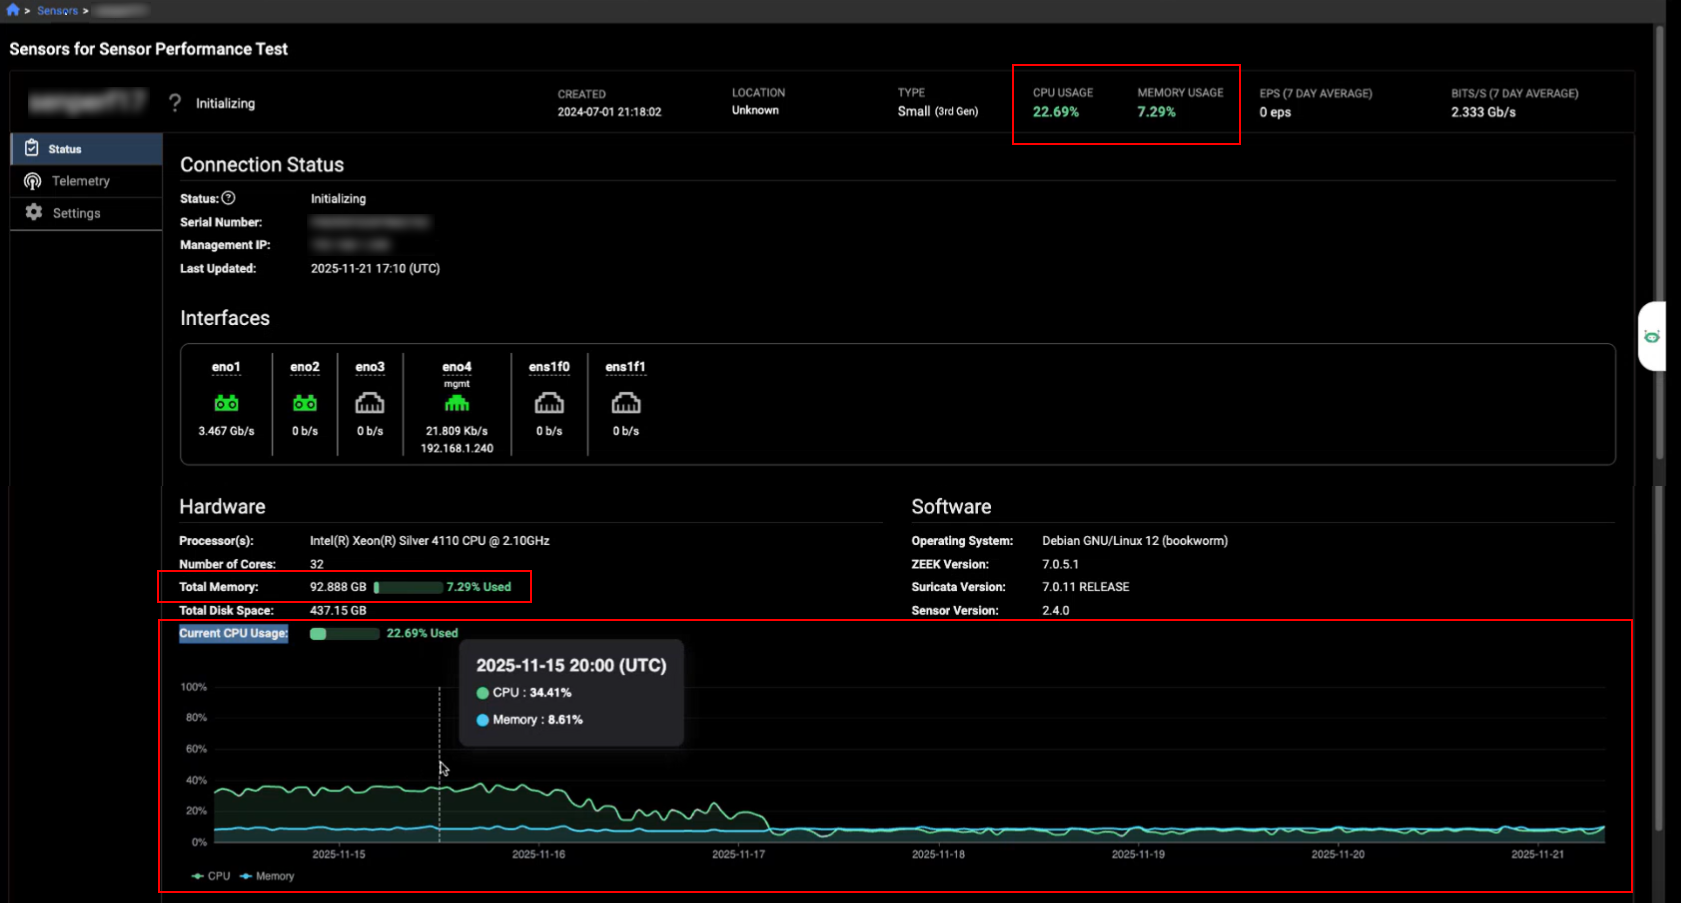
Sensor metrics
The Sensor Details page now displays the current CPU and memory usage for the sensor at the top of the page and as a bar charts in the Hardware section. The usage values are color-coded:
- Green if usage is 0-59%
- Yellow if usage exceeds 60%
- Red if usage exceeds 90%
A graph has been added to the Hardware section to track CPU and memory usage over the last 24 hours. You can hover over the graph to view usage at a specific point in time. This graph was also added to a to the Telemetry tab; to view it click CPU &Memory Usage.
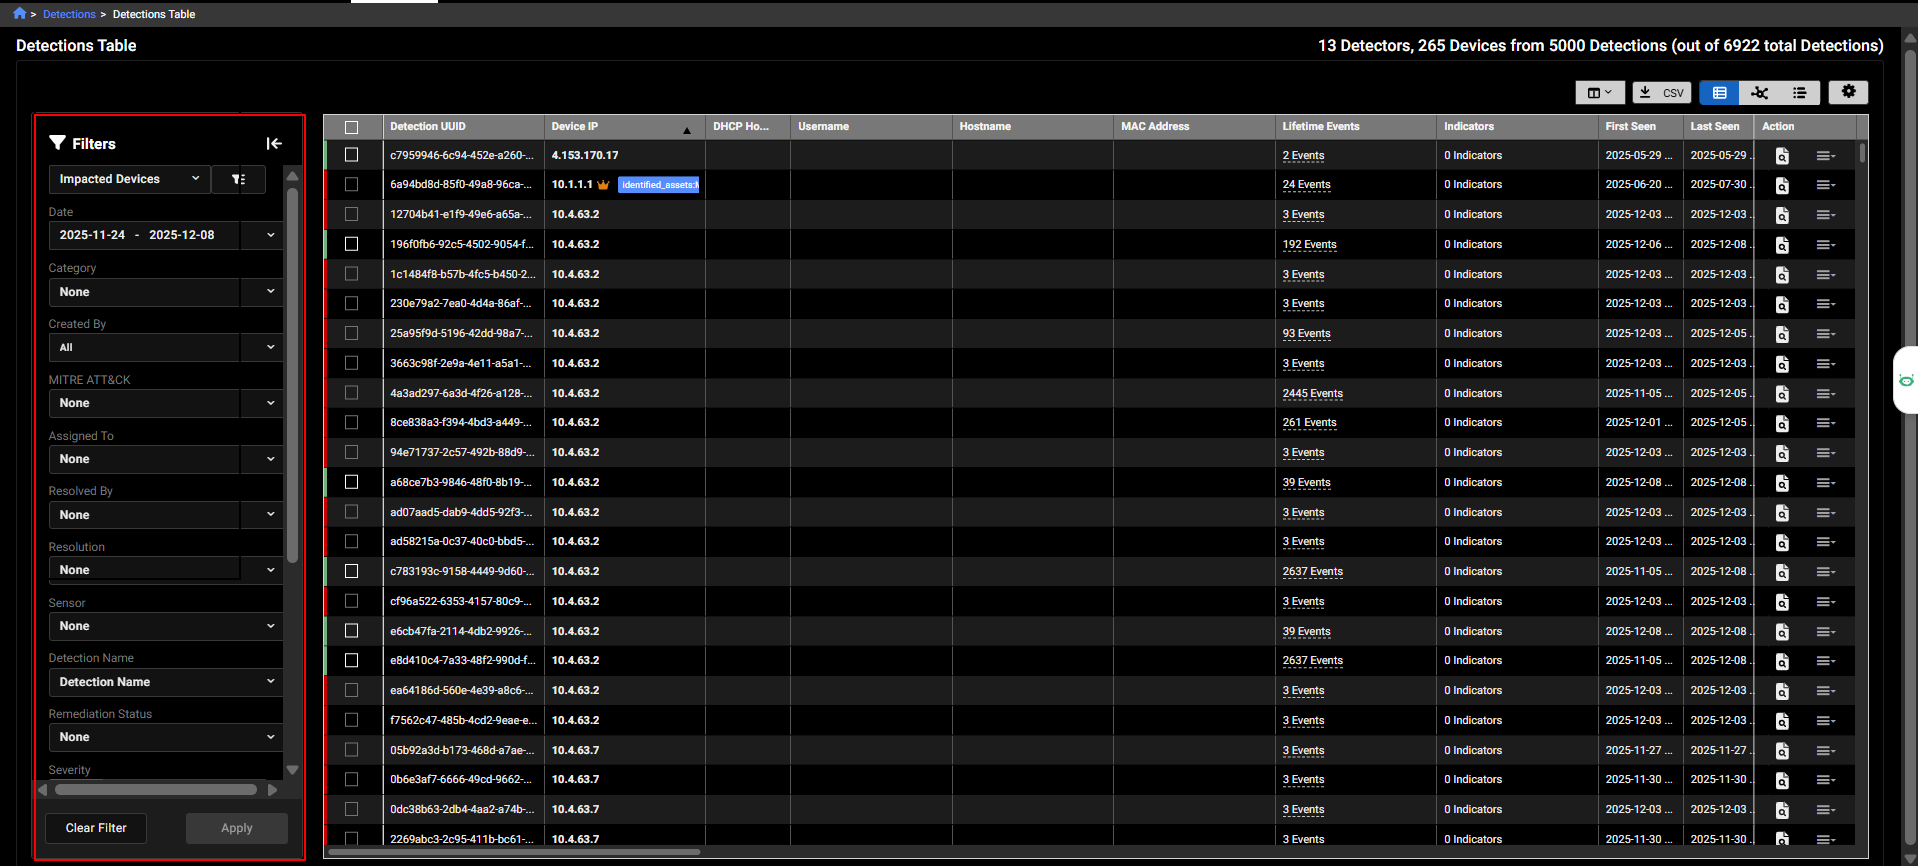
Detections table
The filters in the Detections Table have been redesigned as a collapsible pane on the left side of the page. This allows you to select all filters at once before applying them, reducing the number of page refreshes. To remove all filters, simply click Clear All. This update was also applied to graph and timeline views of the table.
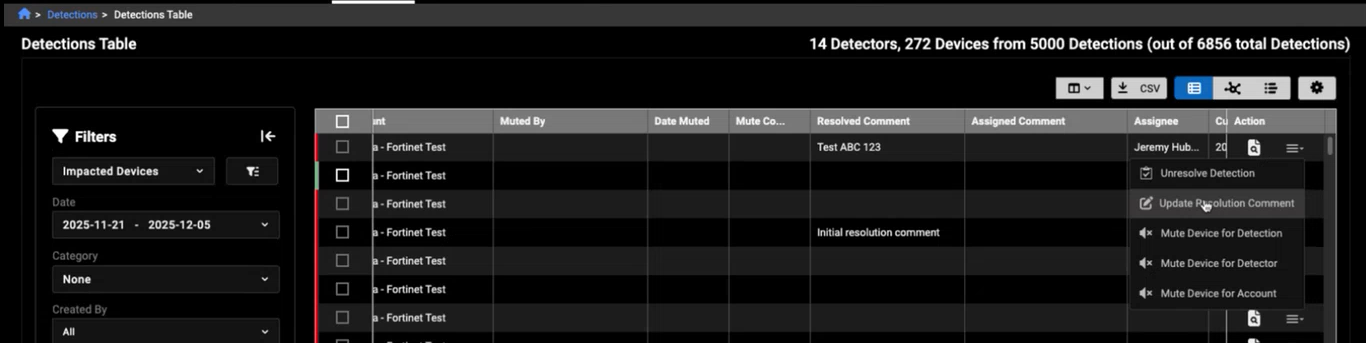
Detection resolution comments
We have also added the ability to update the resolution comment directly from the Actions menu.
Investigation results
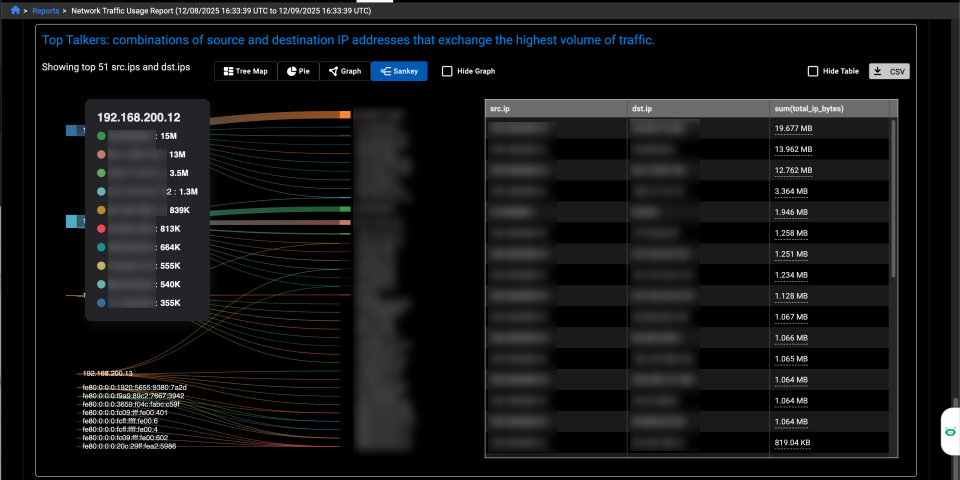
A new Sankey chart has been added to the investigation results and the Network Traffic Usage report. It is available for aggregations where Group By includes two IP fields or when there are two dimensions and a measure. The Sankey chart type appears only when there are 50 or fewer dimensions.
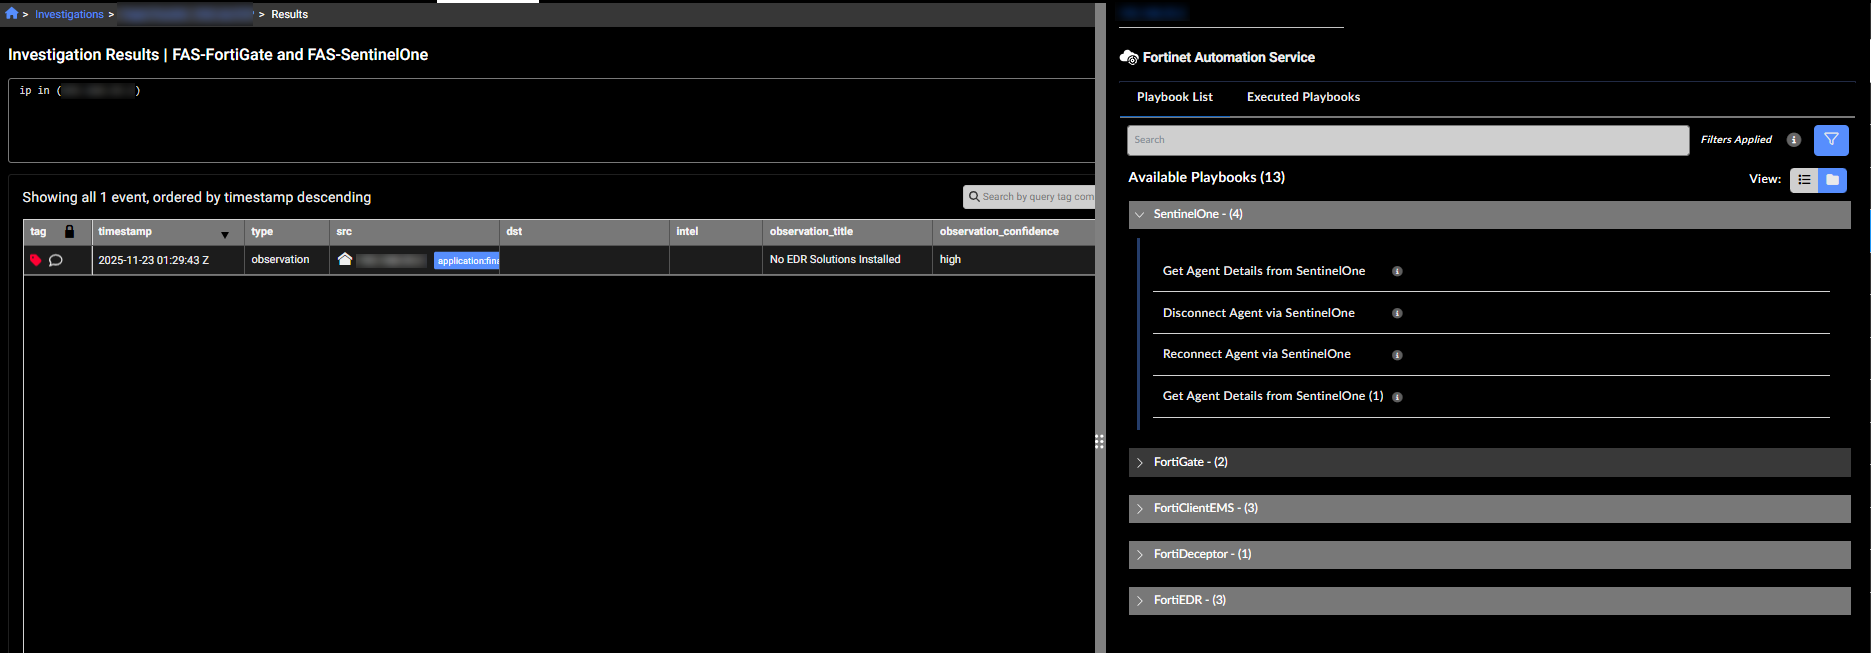
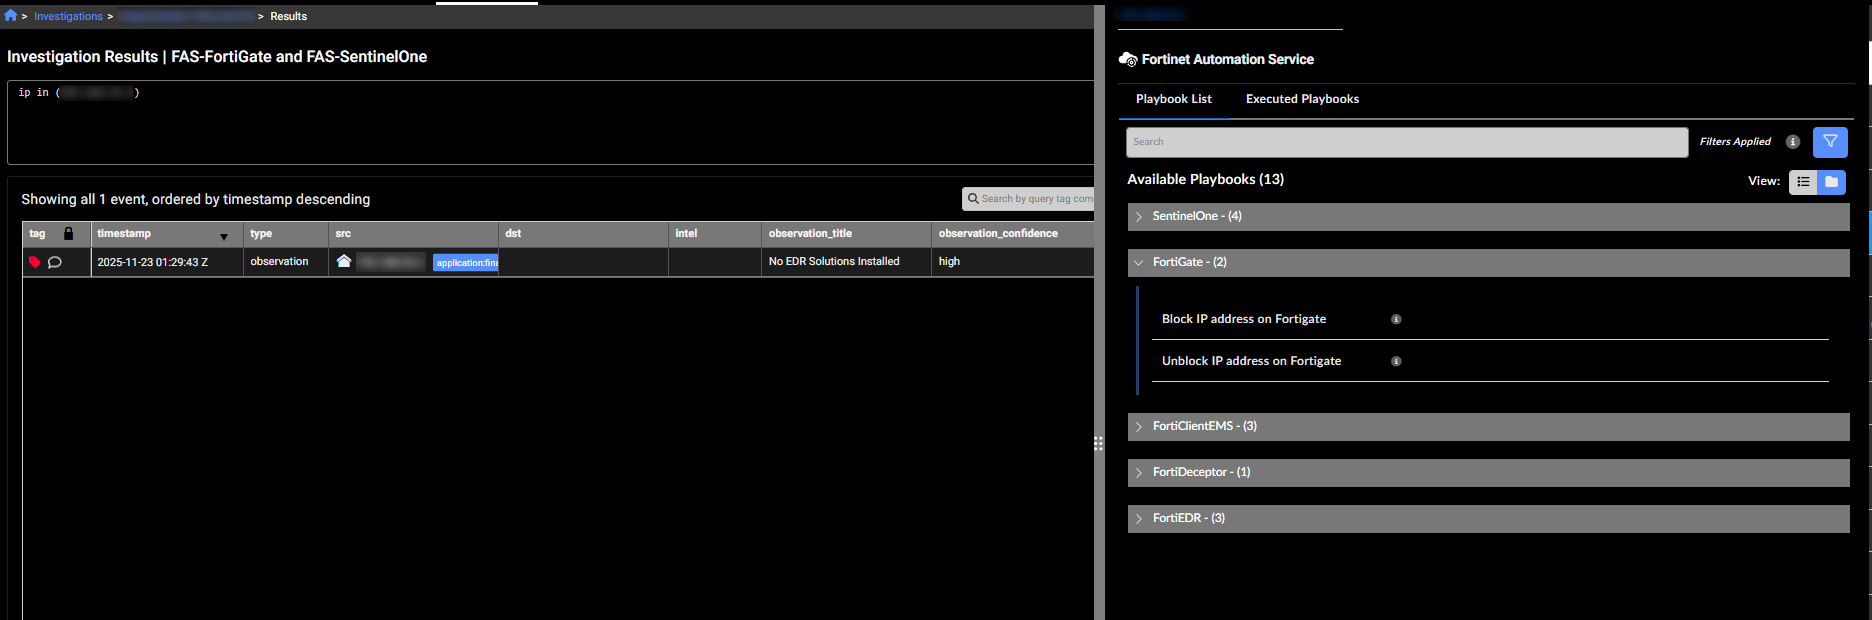
FortiNDR Essentials Solution Pack v1.0.1
The FortiNDR Essentials Solution Pack version 1.0.1 contains connectors and playbooks for FortiGate and Sentinel One.
Other improvements
- You can now download the data in the Behavioral Observations page as a CSV file.
- The Client Secret is masked when you configure an integration.
-
Updated Security Posture queries to include checks for outdated web browsers and end-of-life operating systems.