
Version 25.2.0
New functionality
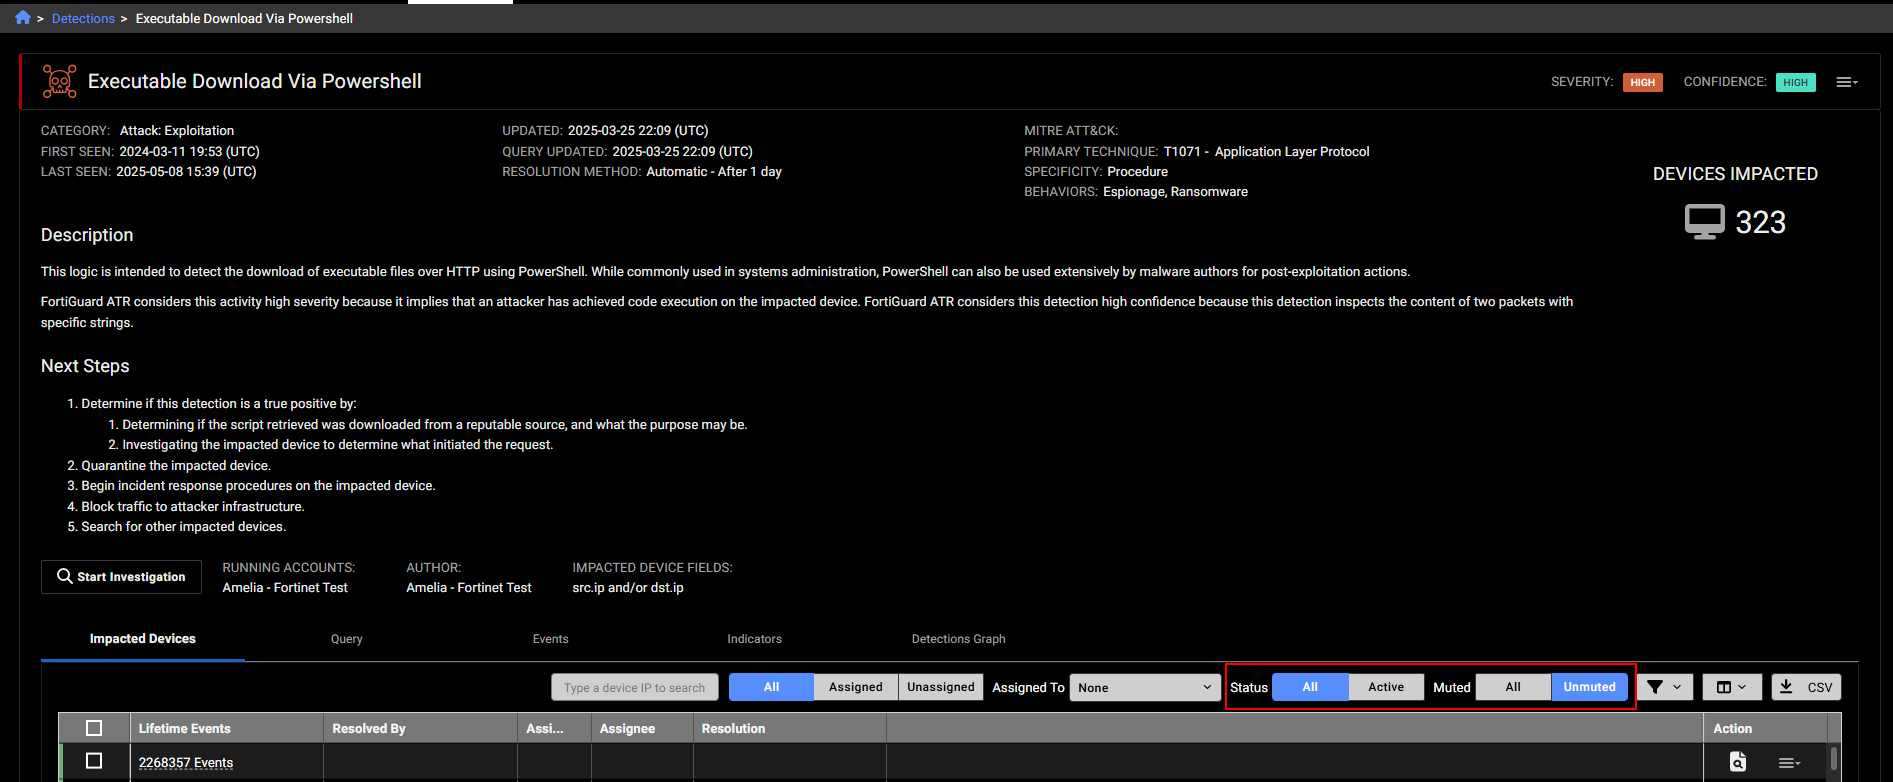
Detections table
Detection context
You can now view all the device detections that fall within a time range. In the Detections table, do one of the following:
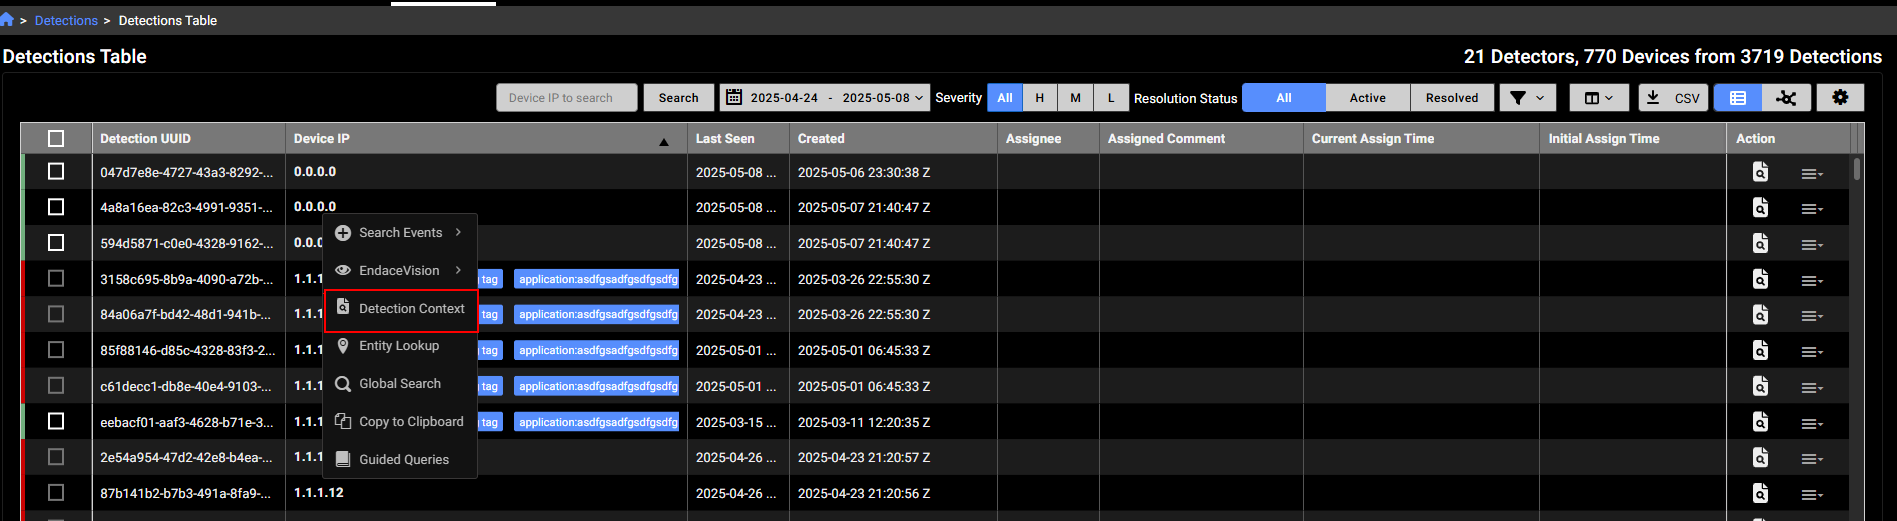
- Right-click an IP that was last seen is within the last year and select Detections Context.
- Click the Detections Context icon in the Actions column.
- Click the Actions menu in the Entity Panel and select Detections Context.
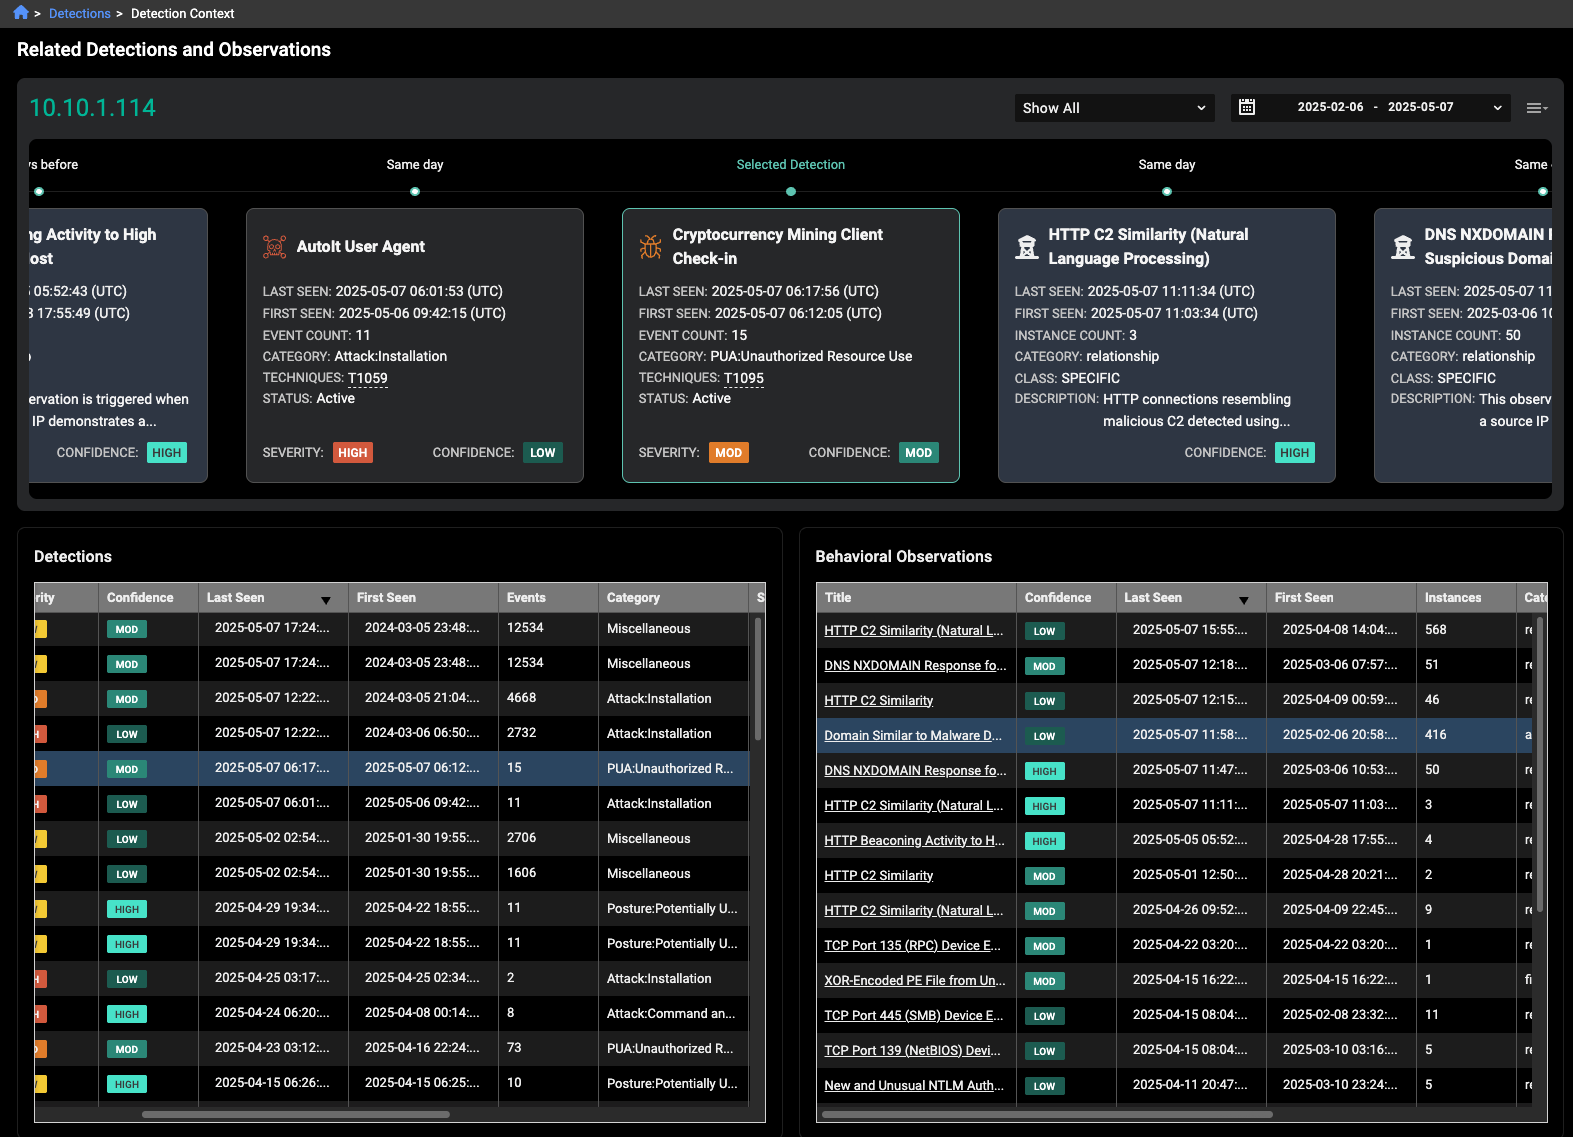
The Detection Context page displays the detections and observations timeline, as well as Detections and Behavioral Observations tables. The tables are sorted by Last Seen in descending order.
The detection you pivoted from in the Detections table will appear as the Selected Detection in the center of the timeline and display details about the detection. The timeline is sorted by Last Seen in ascending order. To change the Selected Detection, click a row in the Detections table. To change the selection to an observation, click a row in the Behavioral Observations table. You can also use the scroll bar below the timeline to move back and forth.
To pivot to the Detections or Behavioral Observations pages, click the Detection Name or observation Title in the table, or click a tile in the timeline.
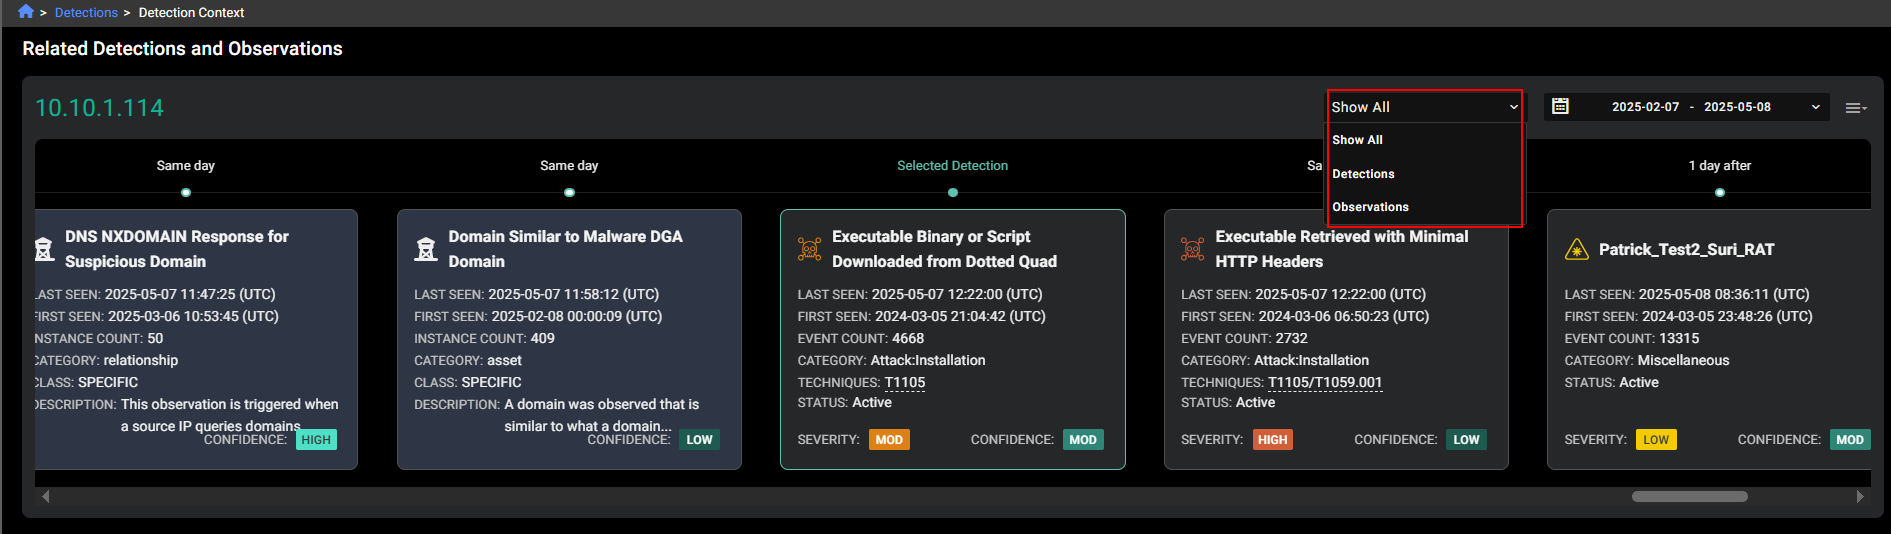
You can filter the Detection Context page by Detections and Observations.
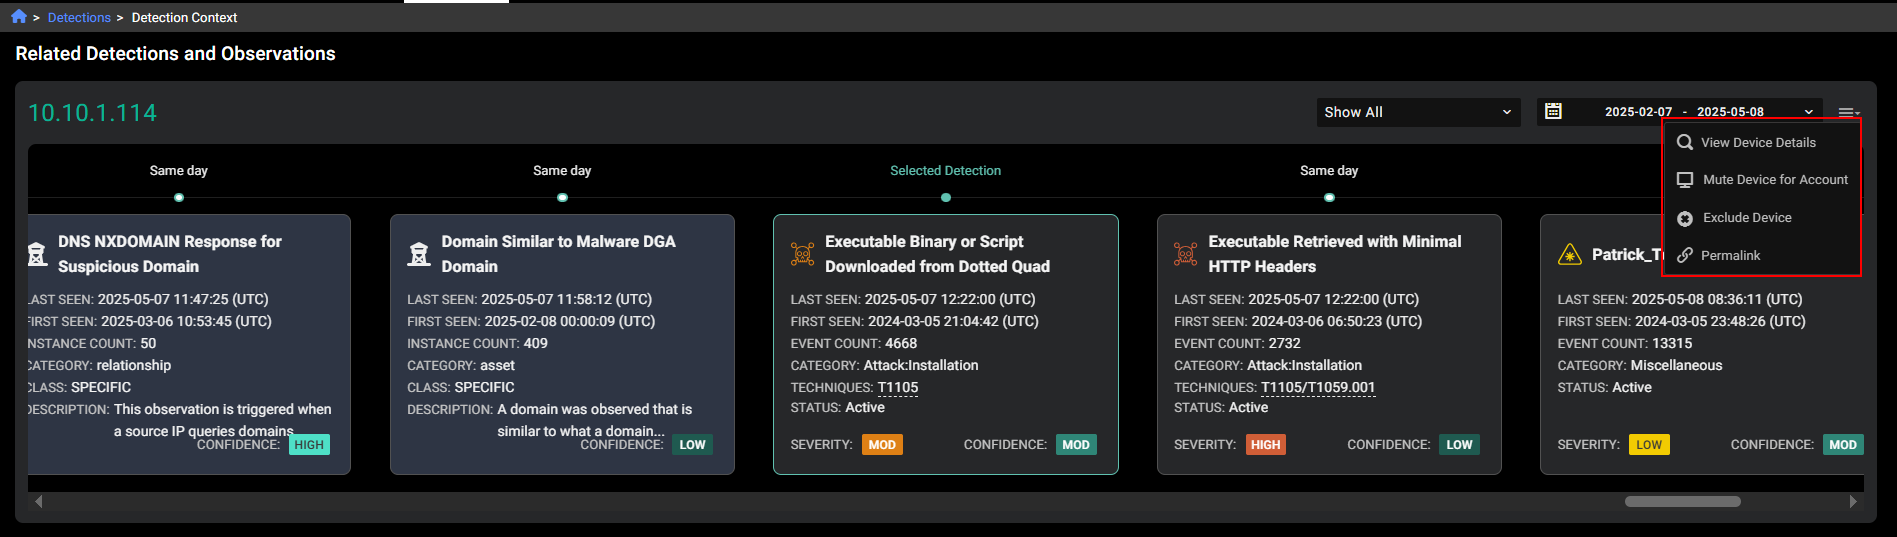
You can use the Detection Context page to view the device details, mute or exclude the device.
When you click a detection in the timeline, you are pivoted the Triage Detections details page. This page has been updated to include the Status and Muted filters. By default, the page shows All detections and Unmuted detections.
Improved functionality
Sensor telemetry
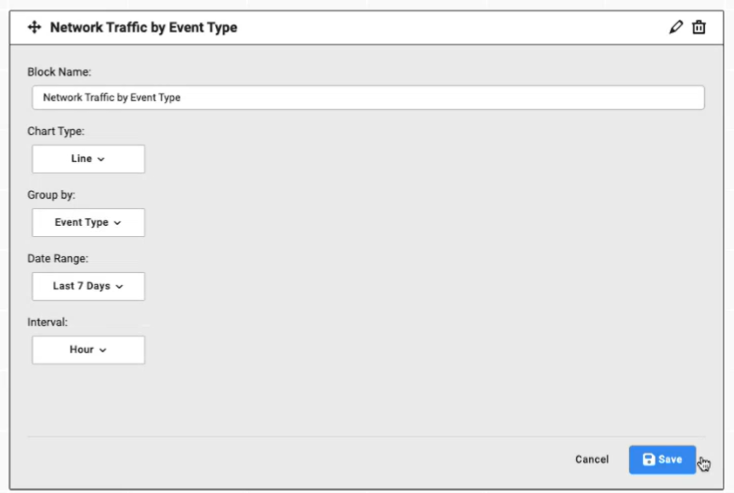
Traffic by event type widget
You can now click the header in the Traffic by Event Type dashboard widget to pivot to the Sensor Telemetry page.
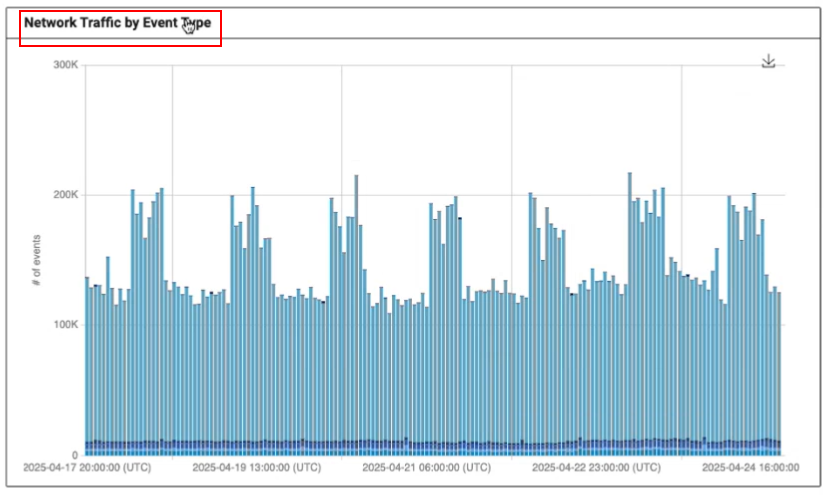
All the filters applied to the widget will be transferred to the Sensor Telemetry page.
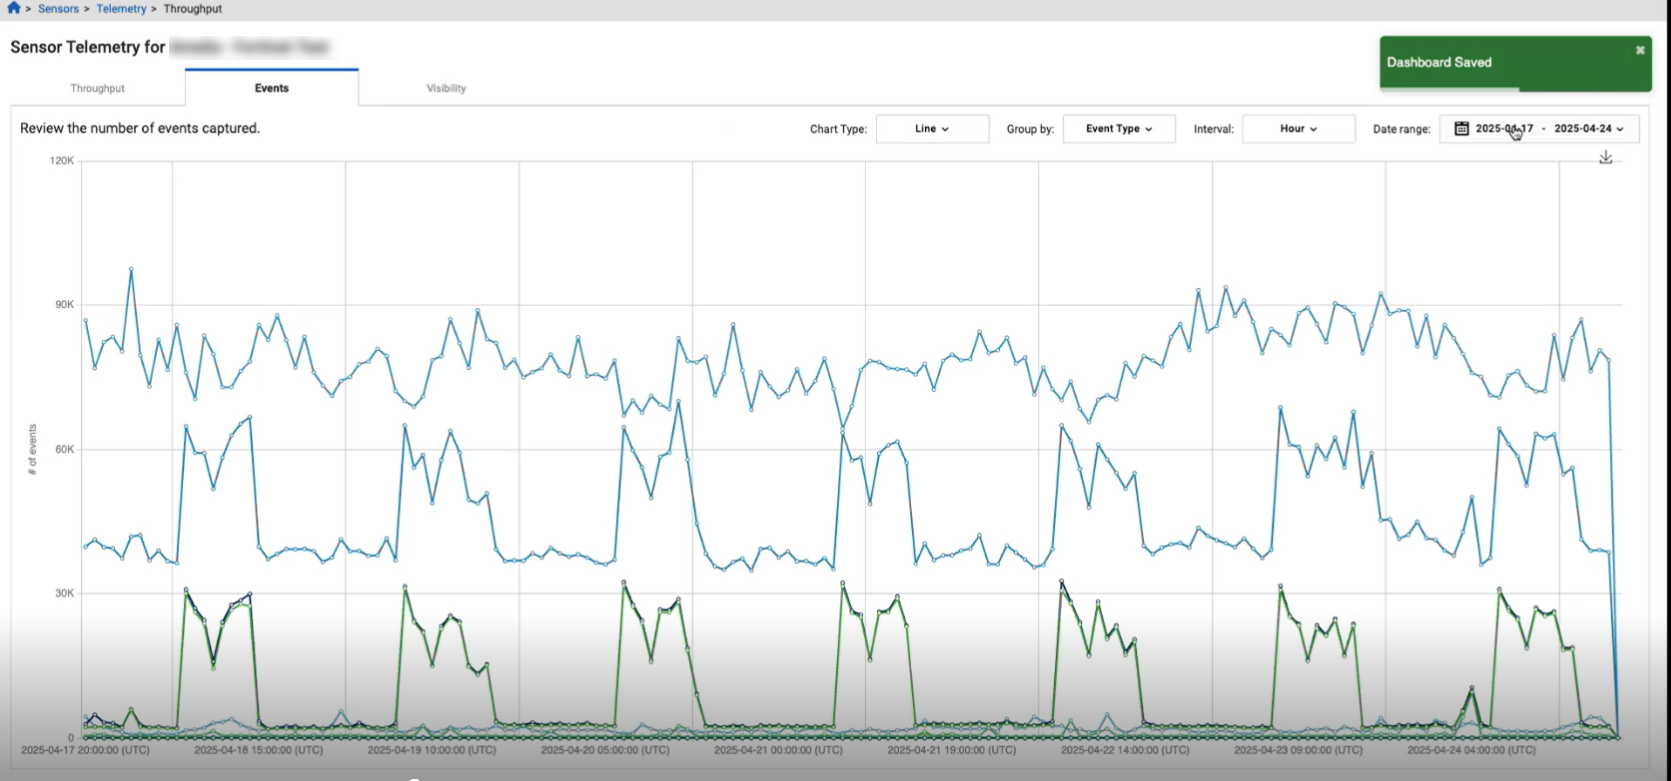
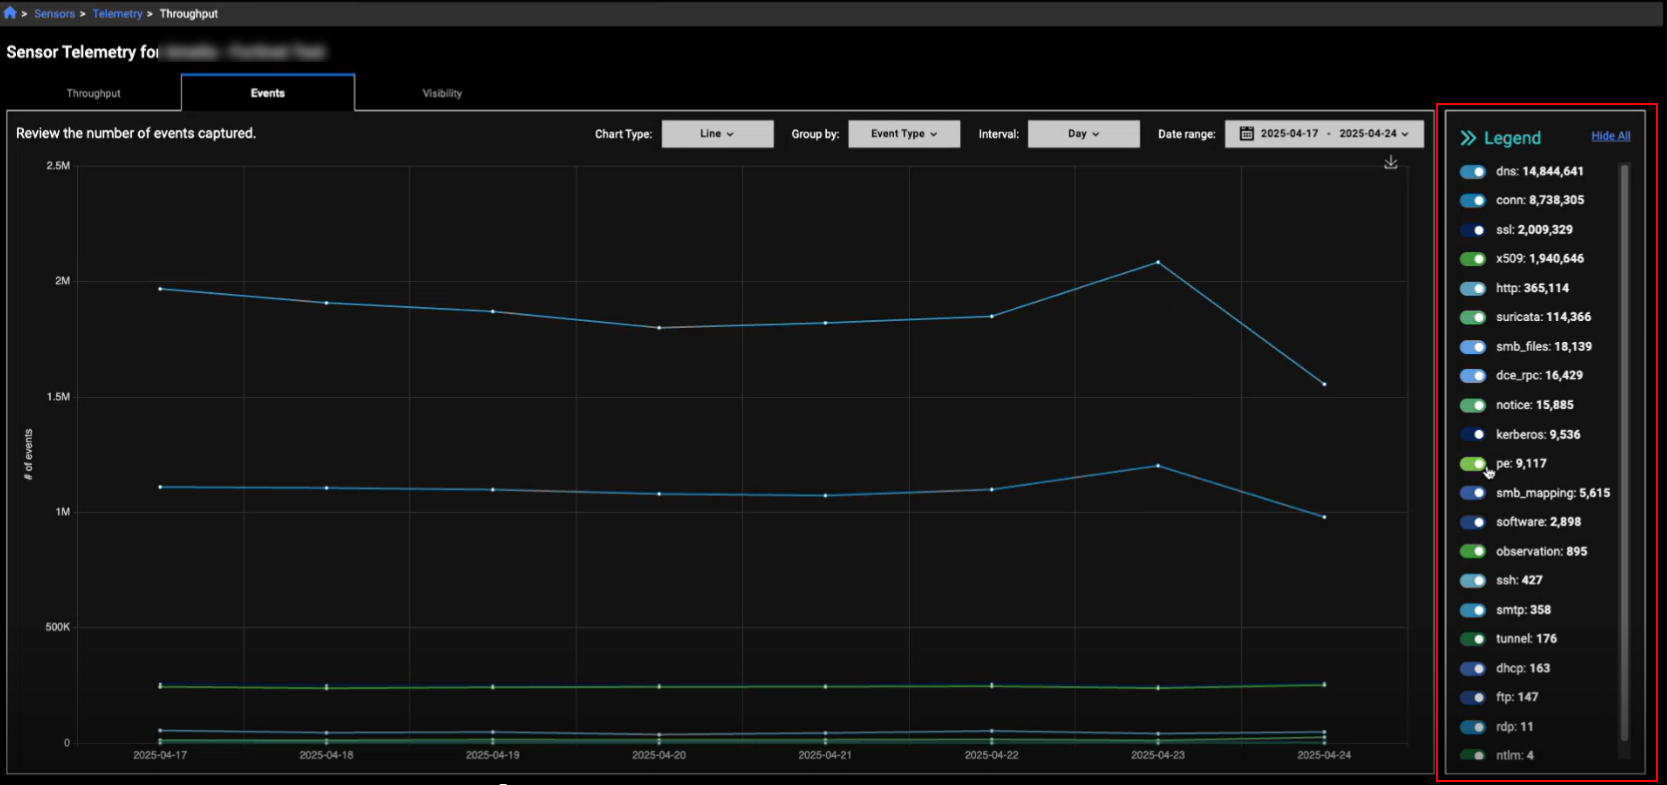
Sensor telemetry page
We have added a legend to the Sensor Telemetry page. This is useful when you want to isolate entries on the page. The legend displays the entries in descending order from highest to lowest. You can use the toggles in the legend to show or hide a line in the graph. You also have the option of showing or hiding all entries.
IQL queries
ldap and ldap_search
We have added the following event fields to the IQL search:
|
ldap |
argument, diagnostic_message, message_id, object, opcode, result, version |
|
ldap_search |
attributes, base_object, deref_aliases, diagnostic_message, filter, message_id, result, result_count, scope |
Other improvements
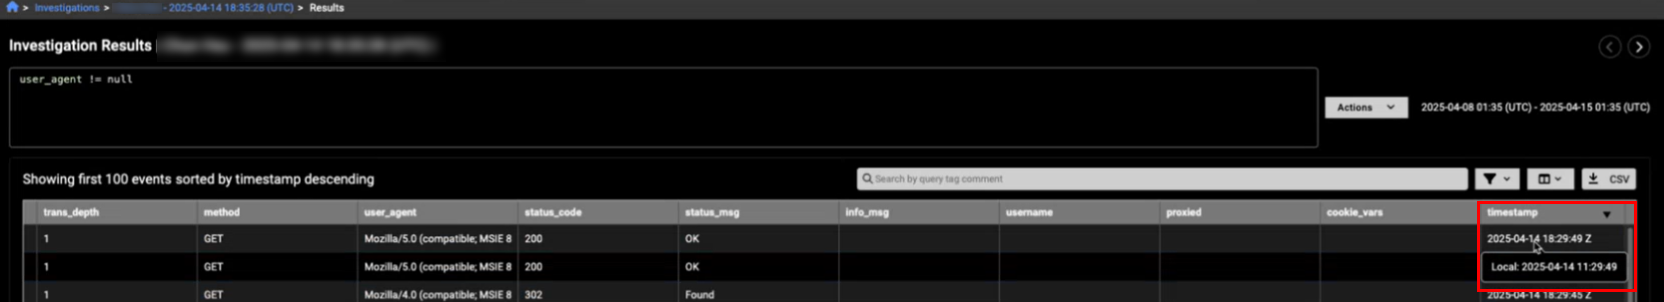
Local time
We have added the local time to the timestamps throughout the portal. To view the local time, hover over the UTC timestamp.
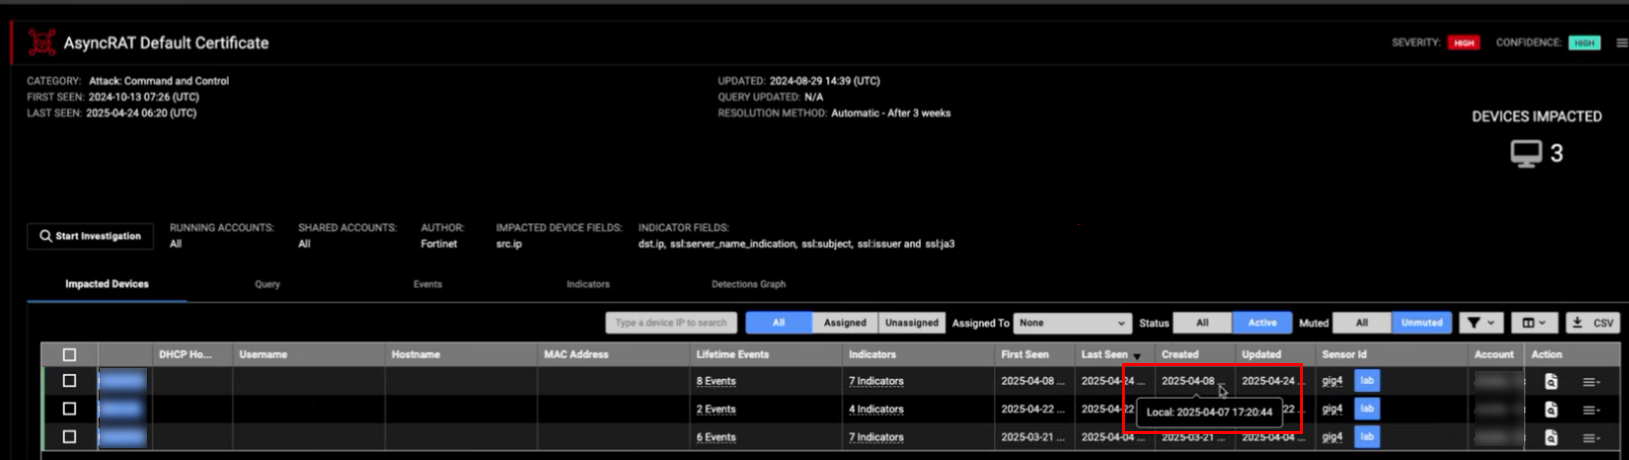
Note that in the Events Table, you need to click the timestamp to view the local time.
Performance improvements
- The CrowdStrike integration has been updated to ensure continued functionality after the deprecation of the old API.
- Email alerts for individual detections now include the detection name in the subject field.
-
The API now allows you to retrieve all detections that have been updated after a specified date.