
Version 25.2.b
Improved functionality
Sensors
Telemetry
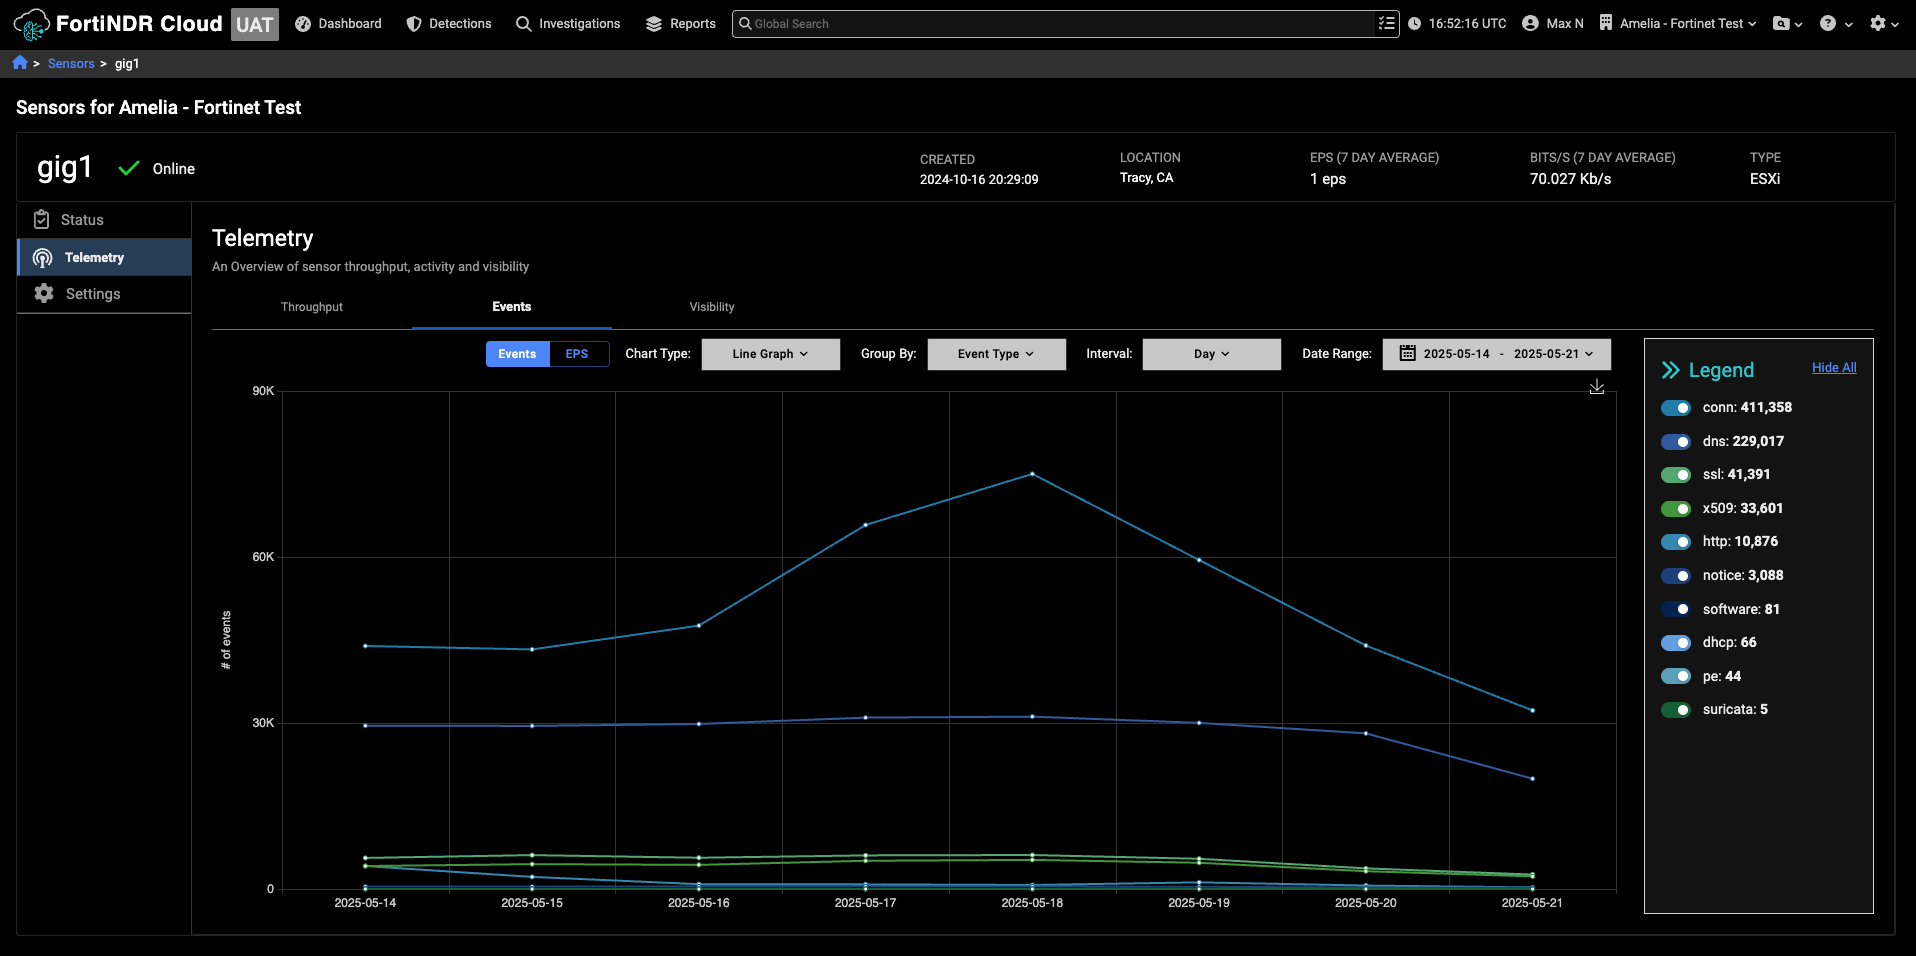
We have improved the performance and responsiveness in the Telemetry page. The Telemetry Details page now includes a legend that displays the total throughput count for each individual sensor.
Throughput
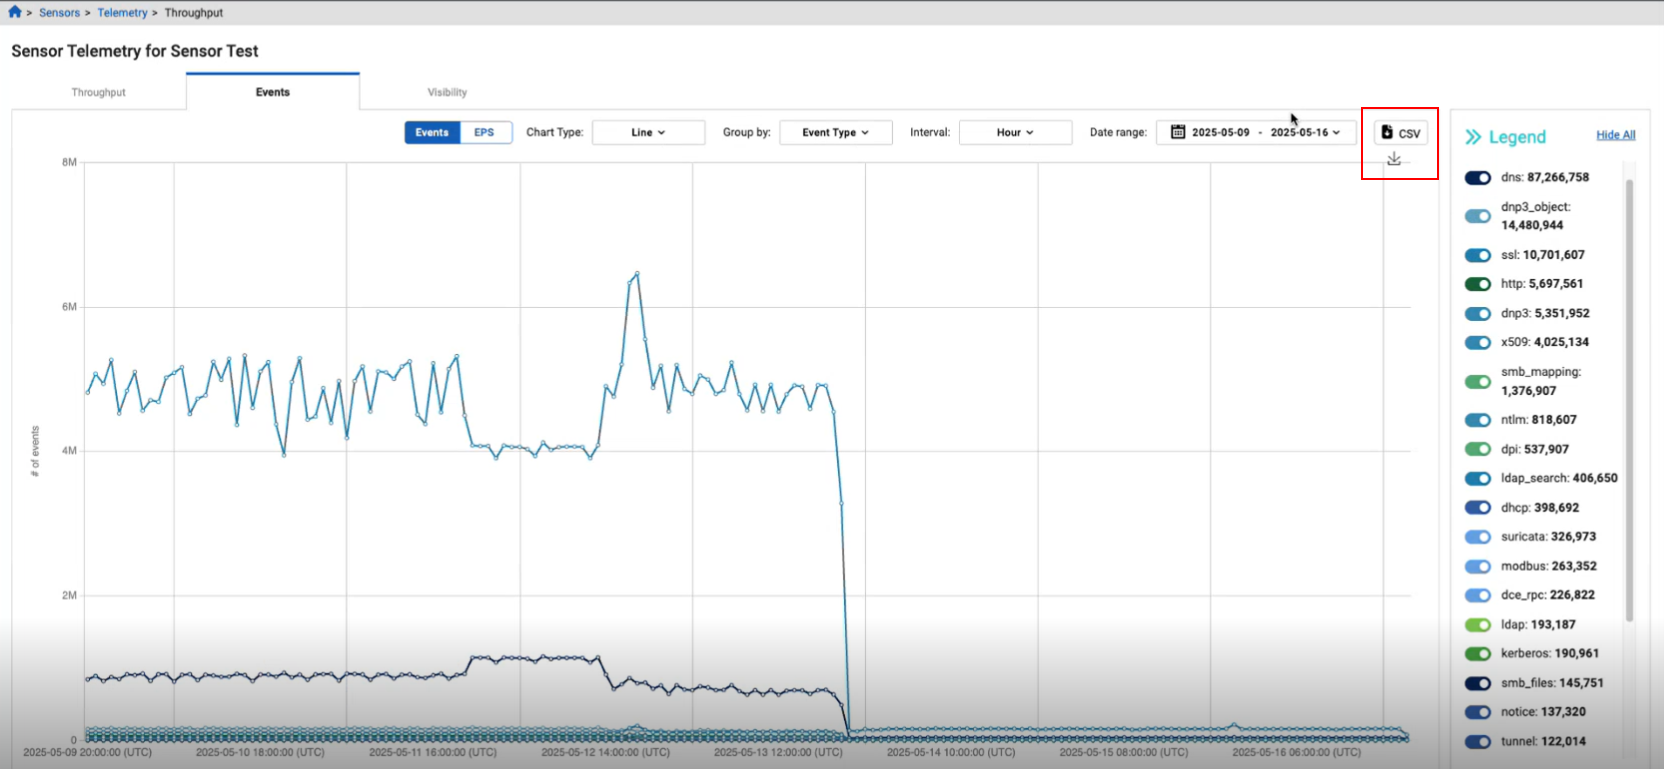
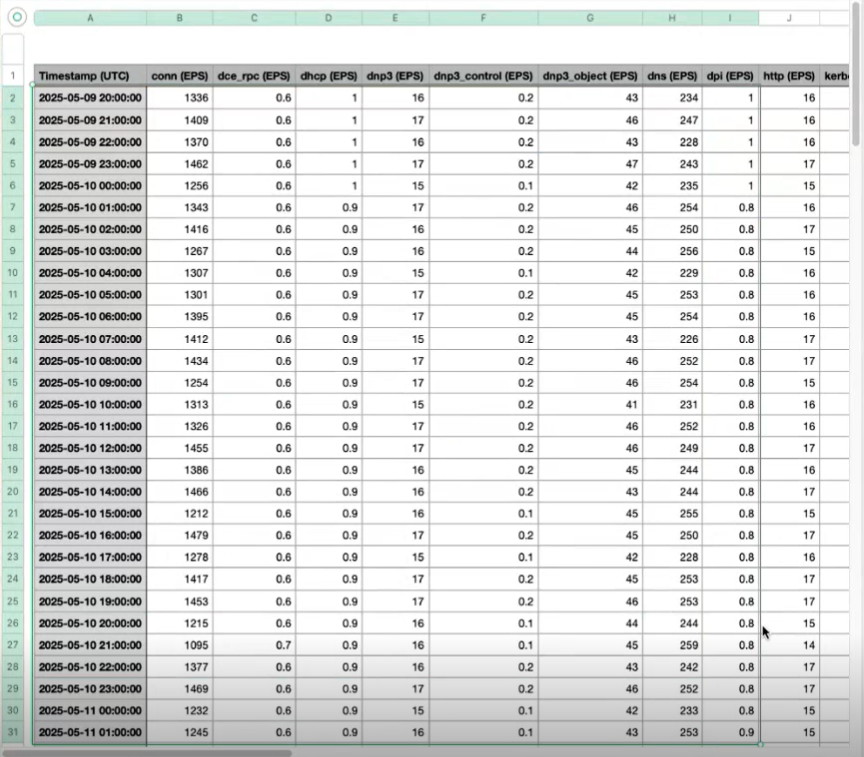
You can now download the data in the Sensors > Telemetry > Throughput page as a CSV file. The CSV file will download everything in the graph. You can use the legend to select the sensor data you want to download.
Detection context
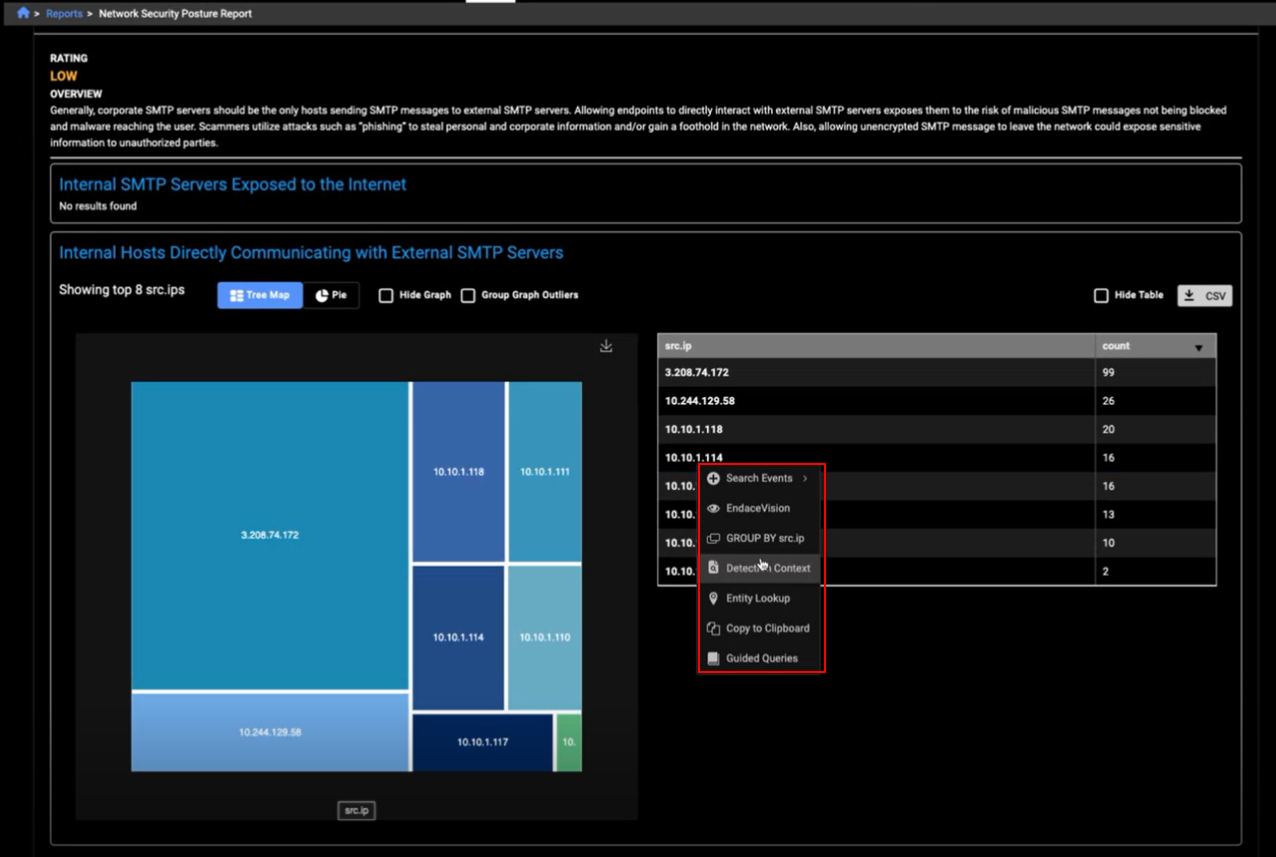
You can now pivot to the Detection Context page from any page that displays an IP address, this includes:
- The Events table > Investigation results page. Note that the page will not display a selected detection because you are pivoting from an event.
- The Private Search page.
- The Triage Detection page > Events tab.
- Detections details > Lifetime Events column.
- The Behavioral Observations details page
- The Aggregation table including the table in a report. Note that when you pivot from the Aggregation table in a report, the Detection Context page will always show the last 90 days.
- The Entity lookup table. This includes the Entity Lookup table in Global Search results.
- The Manage Annotations page. This is limited to valid IPs for the last 90 days.
- The Entity Panel. You can pivot to the Detection Context page when the Entity Panel title is an IP address.
- Detections Table > Indicators column.
Note that the Detection Context page will display a message indicating that there are no detections or observations when none are present.
Other improvements
- We have updated some of the names of the event fields in
ldapandldap_search.