Dashboard
The Dashboard displays the overall anomalies detected by FortiNDR as well as the system status. The Dashboard contains three views: NDR Overview, Malware Overview, and System Status.
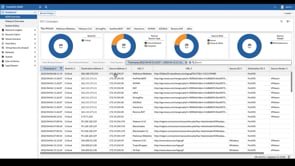
NDR Overview
The NDR Overview dashboard displays network detection and response statistics as charts and graphs. Each widget can be filtered with a time range of 1 day, 1 week, or 1 month. When you click the Network Insights widgets, such as ML Discovery and Botnet, the widget expands to full screen.

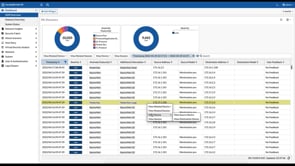
Malware Overview
The Malware Overview dashboard displays information about malware attacks and performance information as charts and graphs.

System Status
The System Status dashboard displays information about the FortiNDR device. Use this dashboard to view license information, resource usage, and the processing queue.

To add a widget to a dashboard:
- In the dashboard banner, click Add Widget. The Add Dashboard Widget window opens.
- Click the plus sign (+) next to the widget name.
- Click OK.