


Managing FortiNDR disk usage for Standalone and Sensor mode
FortiNDR analyzes files and packets "on the fly" and requires plenty of disk space to store attacks. FortiNDR-1000F comes with 2 disks with RAID and is not expandable. FortiNDR -3500F comes with eight SSD drives by default and can support up to 16 SSD in total. The more disks the better the unit performs. For better retention (for example, in center mode) managing multiple sensors fully populated with 16 disk is recommended.
By default, FortiNDR stores all detected events (network anomalies, sessions and malware detection). When the disk reaches:
|
Disc Usage |
Description |
|---|---|
|
90% |
The FortiNDR system will terminate all of its services, including logging, detection, sniffer, network share scanning, file uploading, OFTP, ICAP, and NDR. However, the graphical user interface (GUI) and command-line interface (CLI) console will remain operational in this scenario. To restore the services, the user could execute the 'exec cleanup' command. |
Tip 1: Database logs have time to live set to 264 days which is the max theoretical retention days for all models.
Tip 2: With FortiNDR 3500F, users can purchase more SSDs. Please see the data sheet and ordering guide for details.
Tip 3: You should consider using CLIs to clean up the DB:
|
execute cleanup |
This command removes all logs including all counts in Dashboard, Malware Log, NDR log, ML Discovery log, but will keep ML baseline and feedback. |
|
execute cleanup ml |
This command will clean up all ML Discovery logs. It also retrains baseline, but keeps user feedback. |
|
execute cleanup ndr |
This command removes logs including: NDR related widgets on the Dashboard, NDR log, ML Discovery log, but will keep ML baseline and feedback. This is a subset of execute cleanup. |
|
execute db restore |
This command cleans all the database data and log including what execute cleanup does and also ML baseline/feedback, Scenario AI DB and Binary Behavior DB, which is updated from FortiGuard. |
To view the disk usage:
Go to Dashboard > System Status.

To expand FortiNDR VM storage with the CLI:
execute expandspooldisk.
For more information, see the FortiNDR CLI Reference Guide.
Exporting detected malware files
You can export detected malware files with the CLI or with the GUI under Attack Scenario or Log & Report as a PDF, JSON and STIX2 file.
To export detected malware files with the CLI:
execute export file-report
For more information, see the FortiNDR CLI Reference Guide.
To export detected malware files with the GUI:
- To export detected files under Attack Scenario:
- Go to Attack Scenario and click an attack type such as Ransomware.
- Select an infected host and then in the timeline, hover over the detection name until the dialog appears.
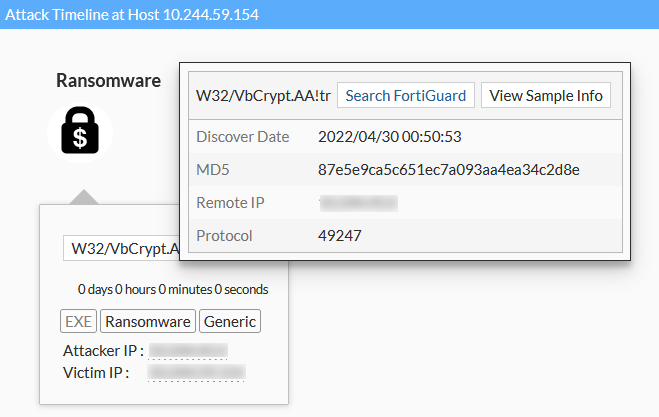
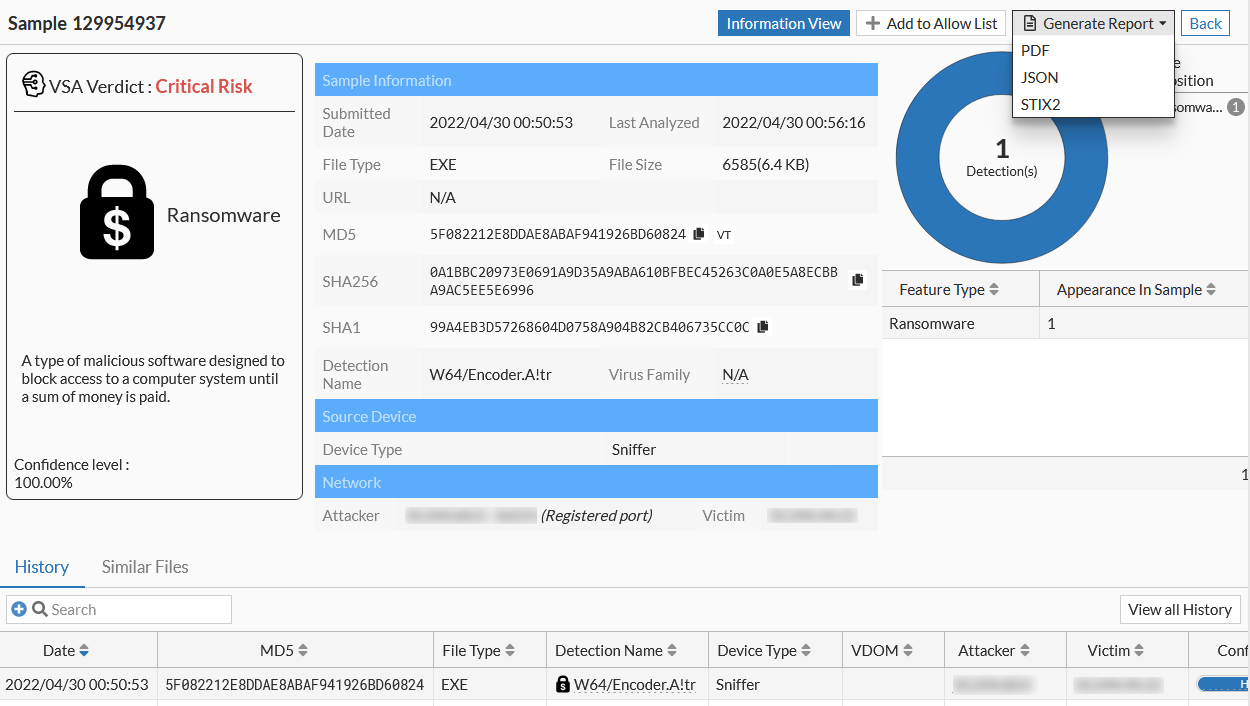
- Click View Sample Info. The sample information is displayed.
- Click Generate Report and select PDF, JSON, or STIX2 format.
- To export detected files under Log & Report :
- Go to Log & Report > Malware Log.
- Double-click a log in the list. The Details pane opens.

- Click View Detail Report. The sample information is displayed.
- Click Generate Report and select PDF, JSON, or STIX2 format.
Formatting the database
To format the database with the CLI:
execute db restore
|
|
Using Use caution when executing this command and backup detection beforehand if required. |