Updated Dashboard and FortiView
Dashboard widgets and FortiView monitors are updated with new graphs, faster performance, and other updates that improve the user experience.
FortiView
FortiView pages can be found using the global search.
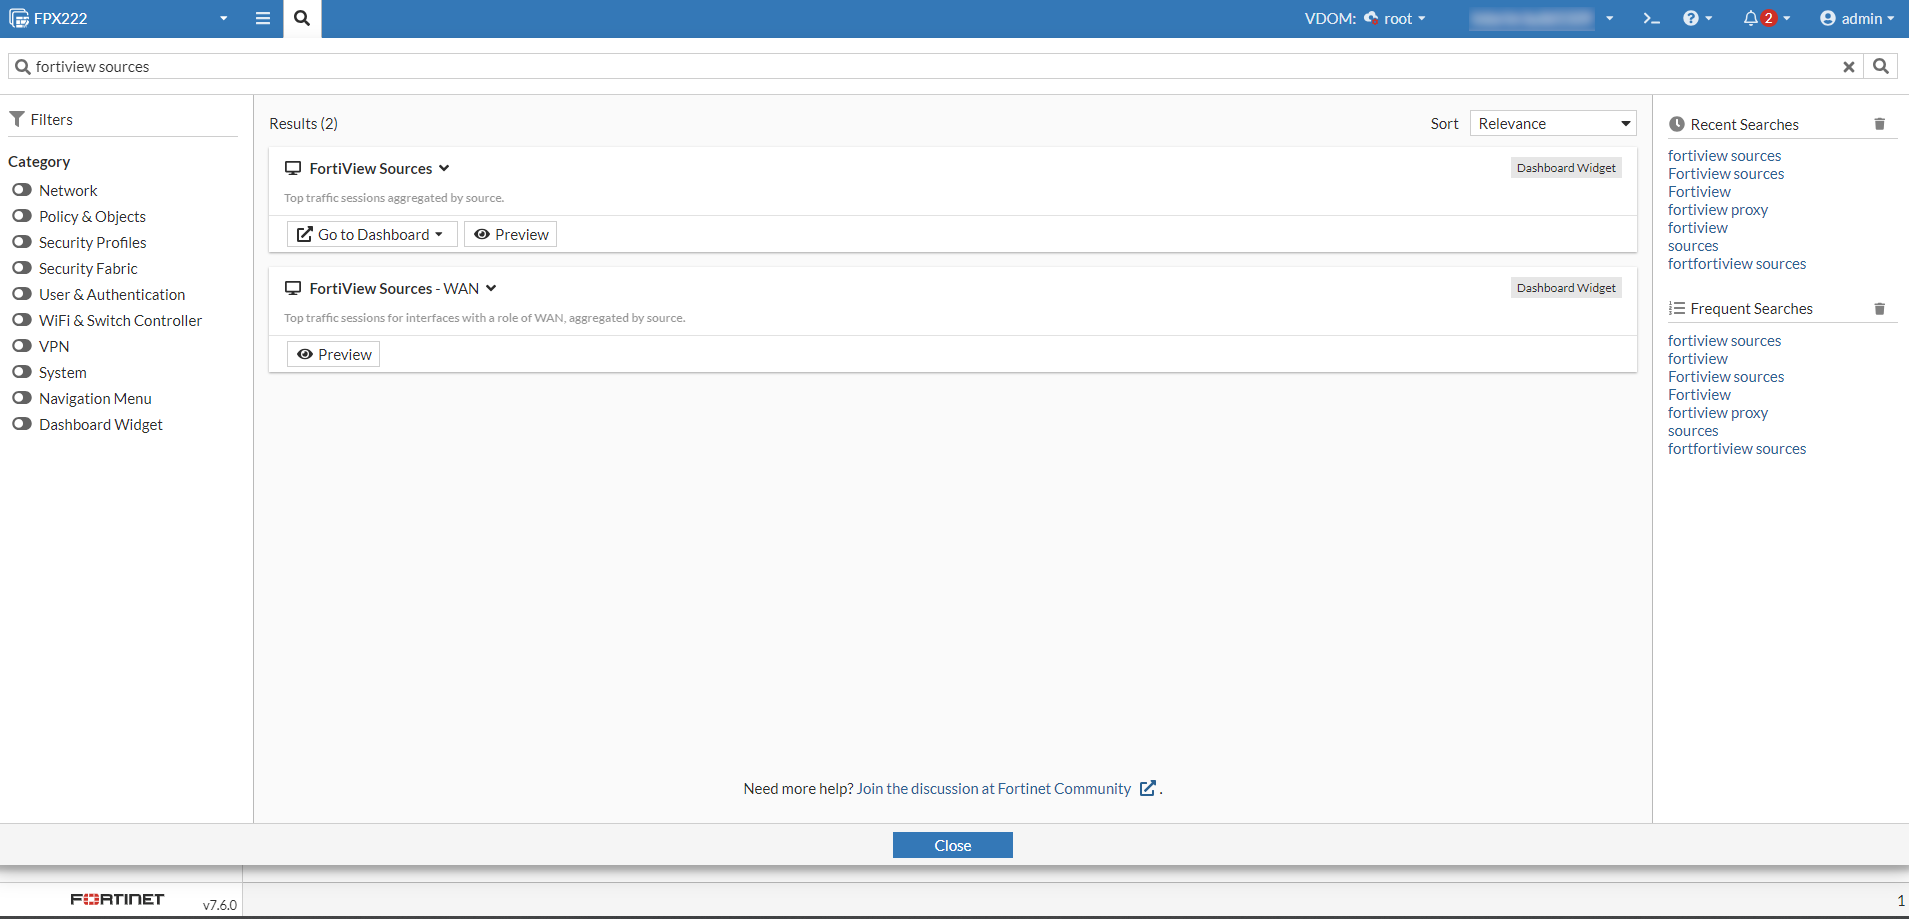
Click the Preview button to preview the page.
Click Go to Dashboard to go to that dashboard. The button is not available if that dashboard has not been added.
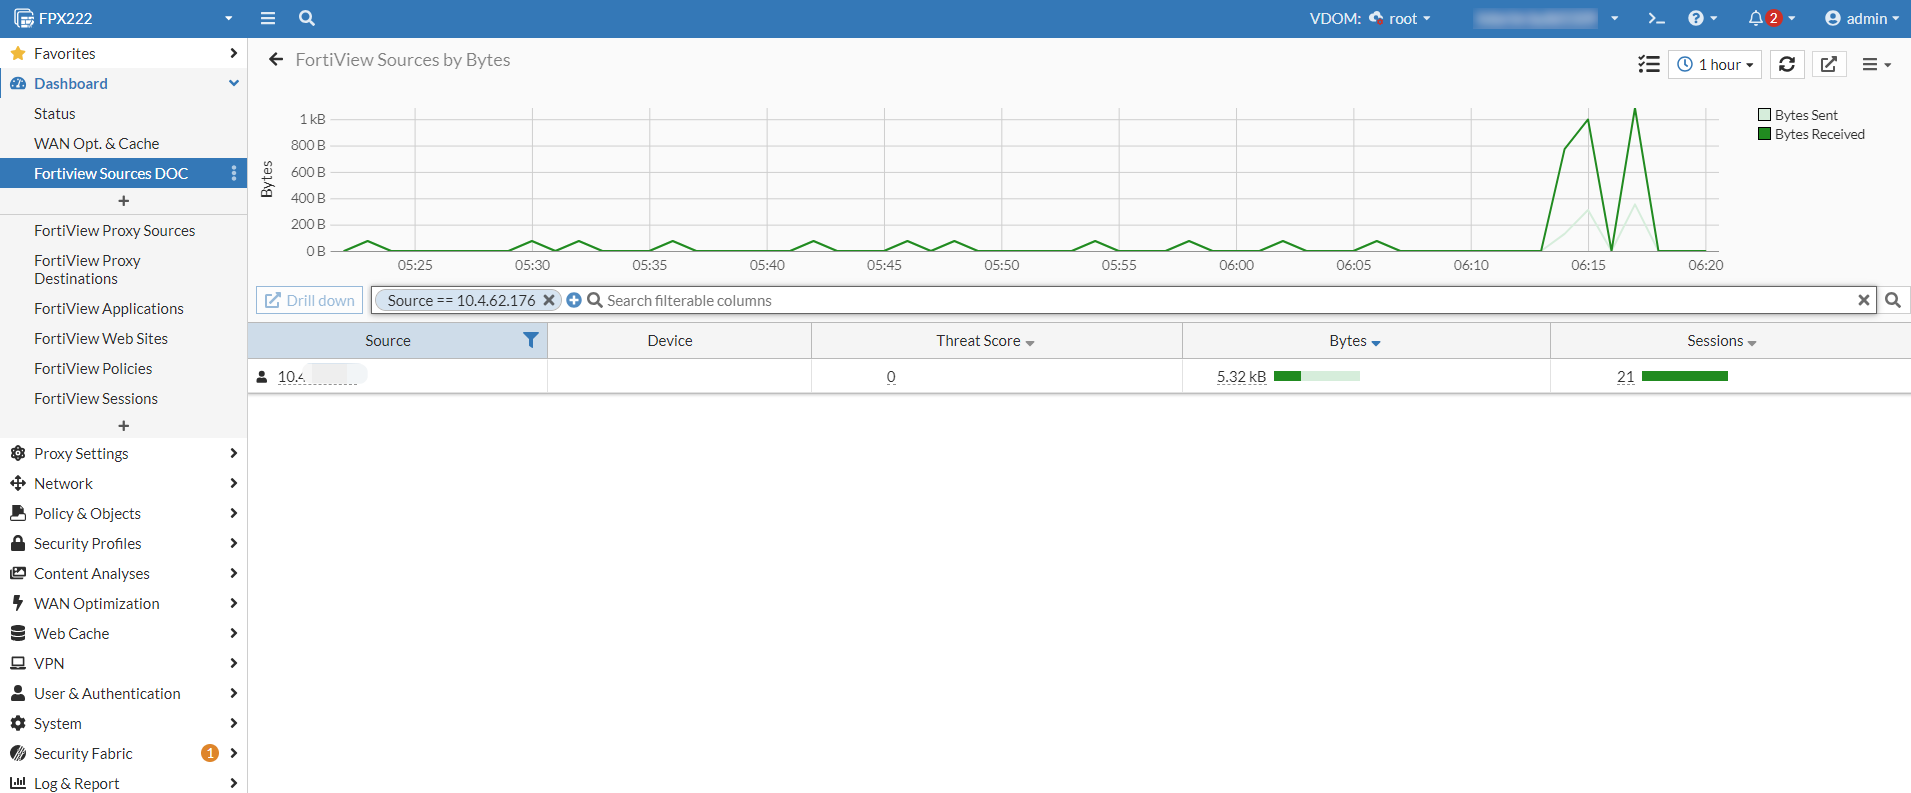
On a standalone FortiProxy, the FortiView data source can be selected from the drop down.
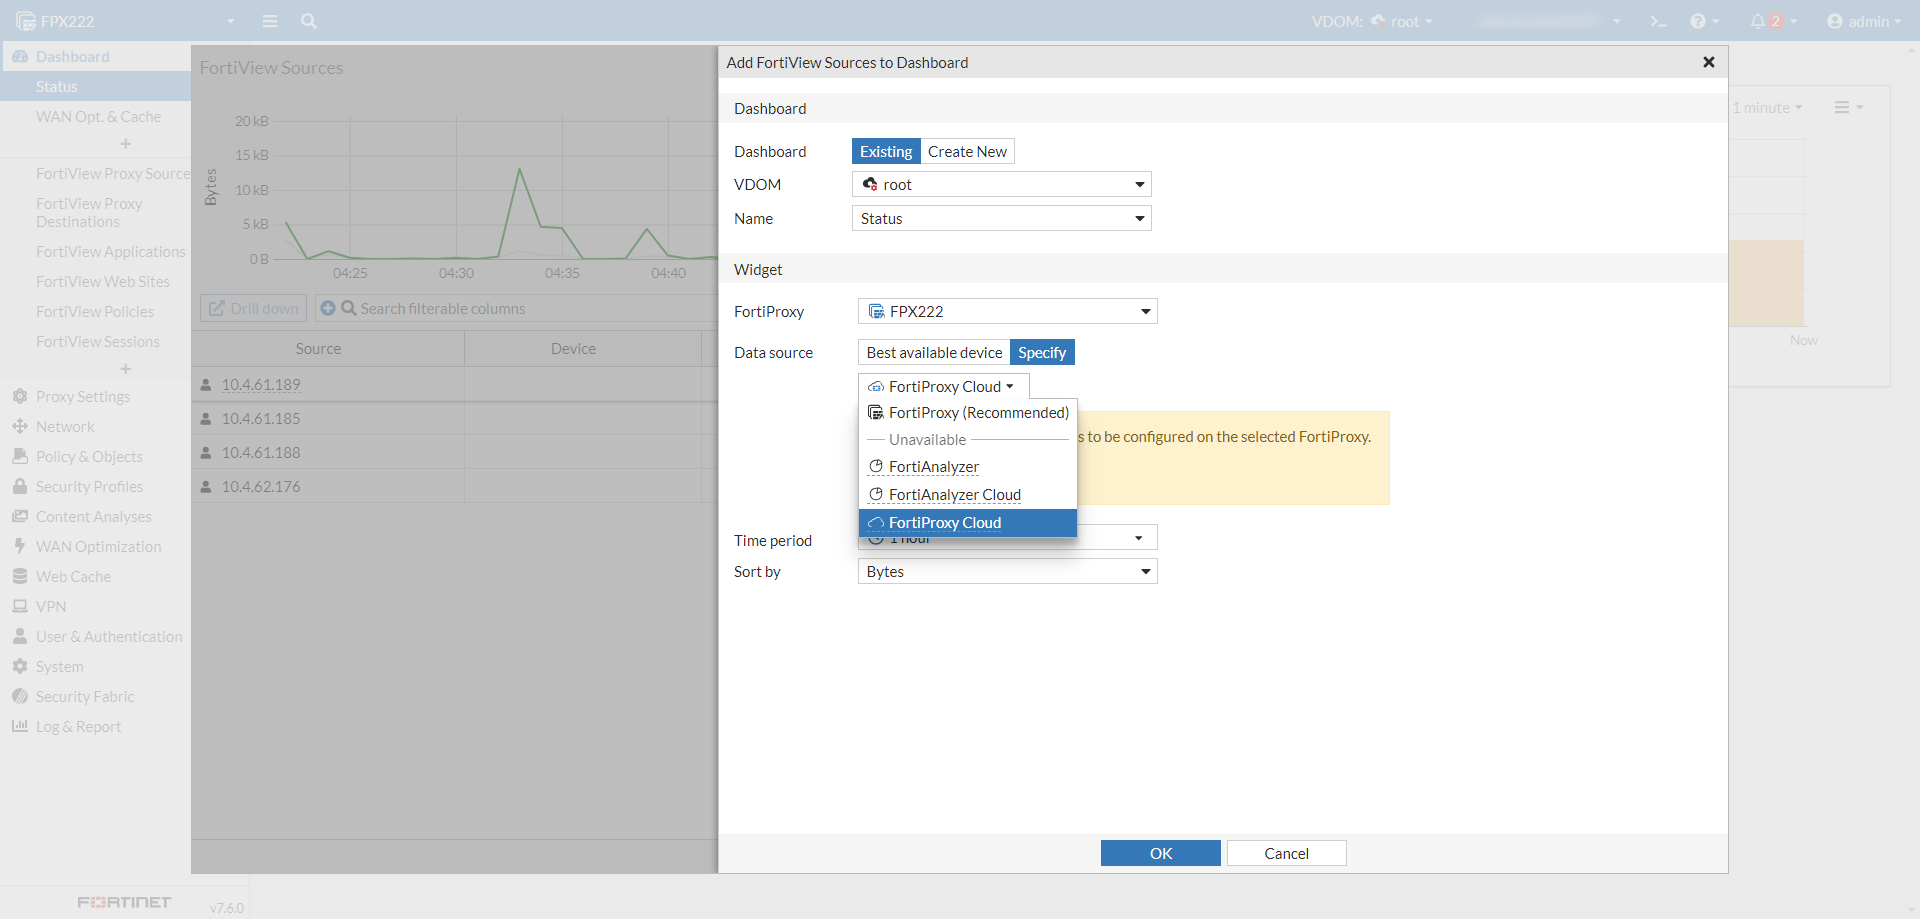
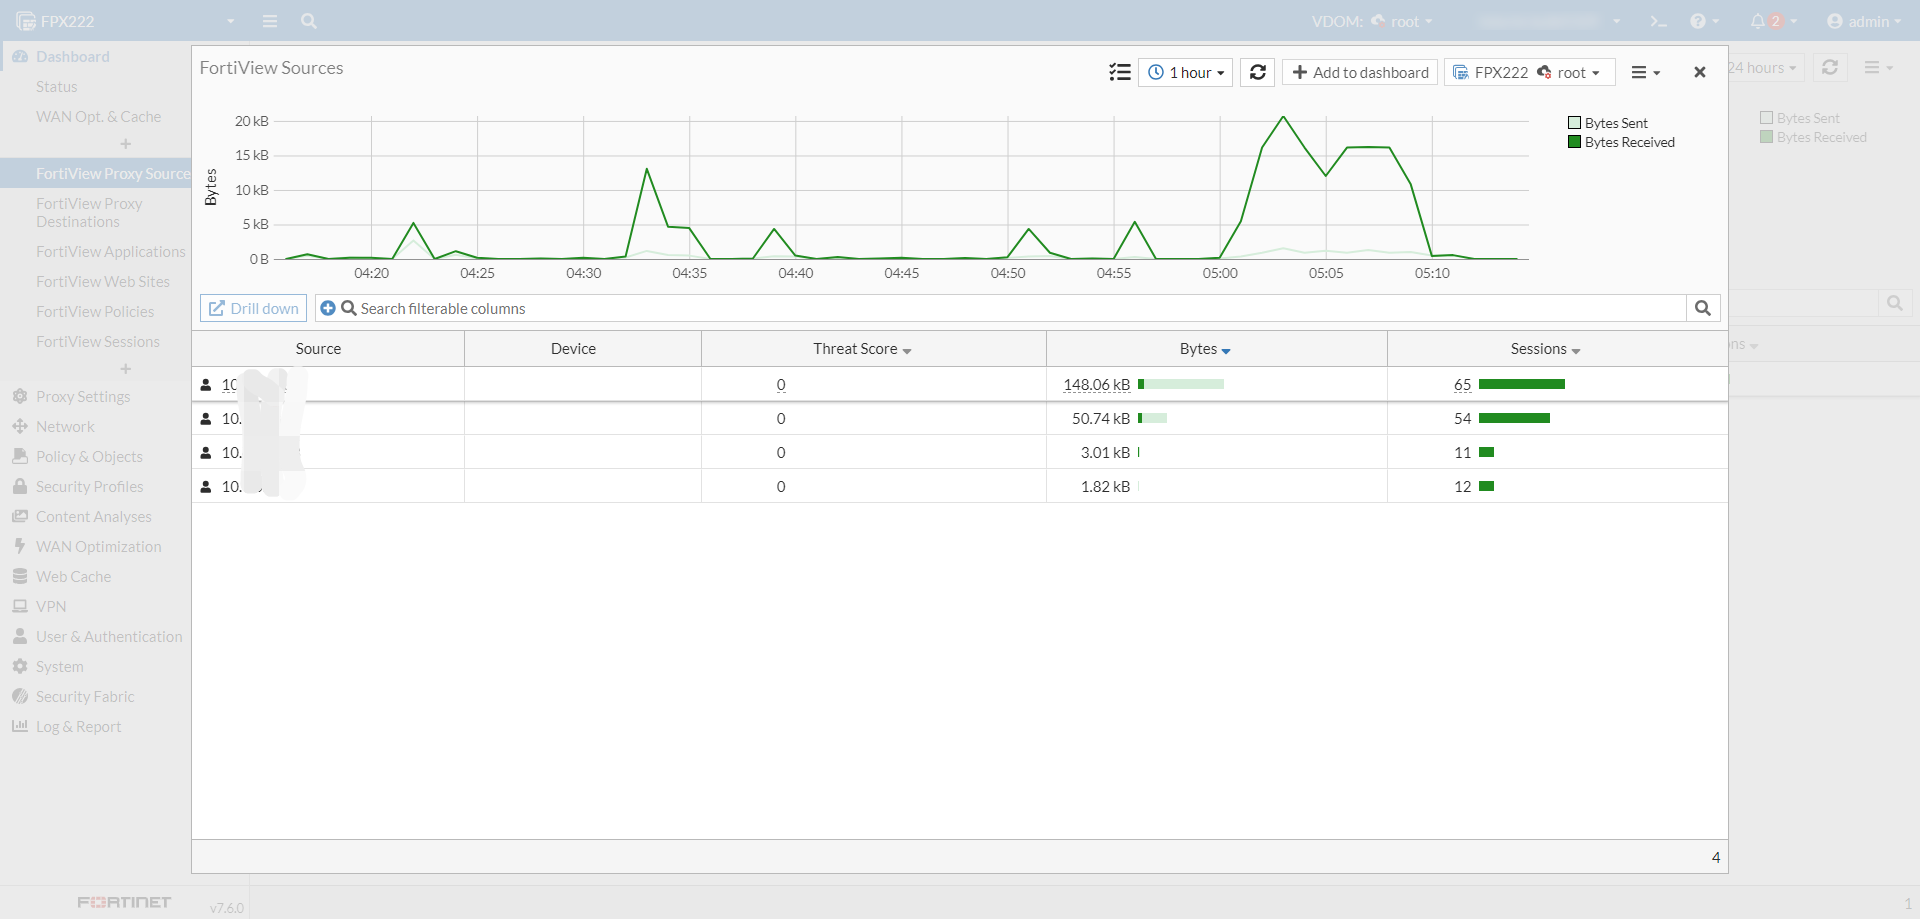
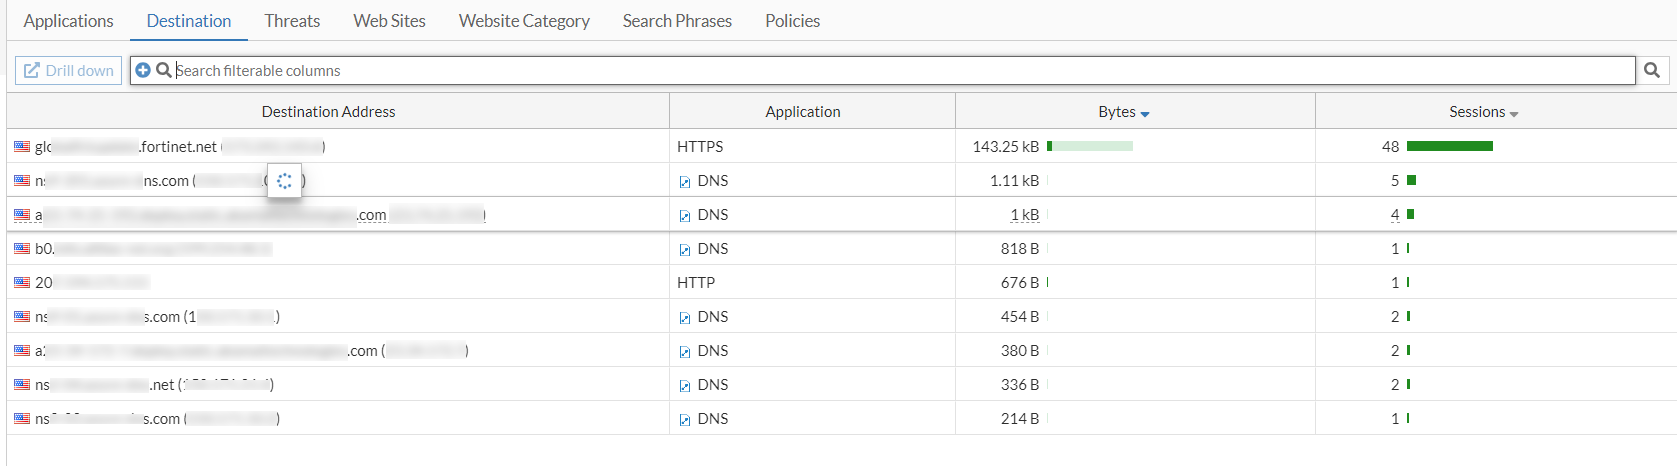
Only the table view is supported; there are no visualization settings.
Filters can be applied using the filter bar or column headings, and are not cleared after refreshing the page or logging out then back in.
![]()
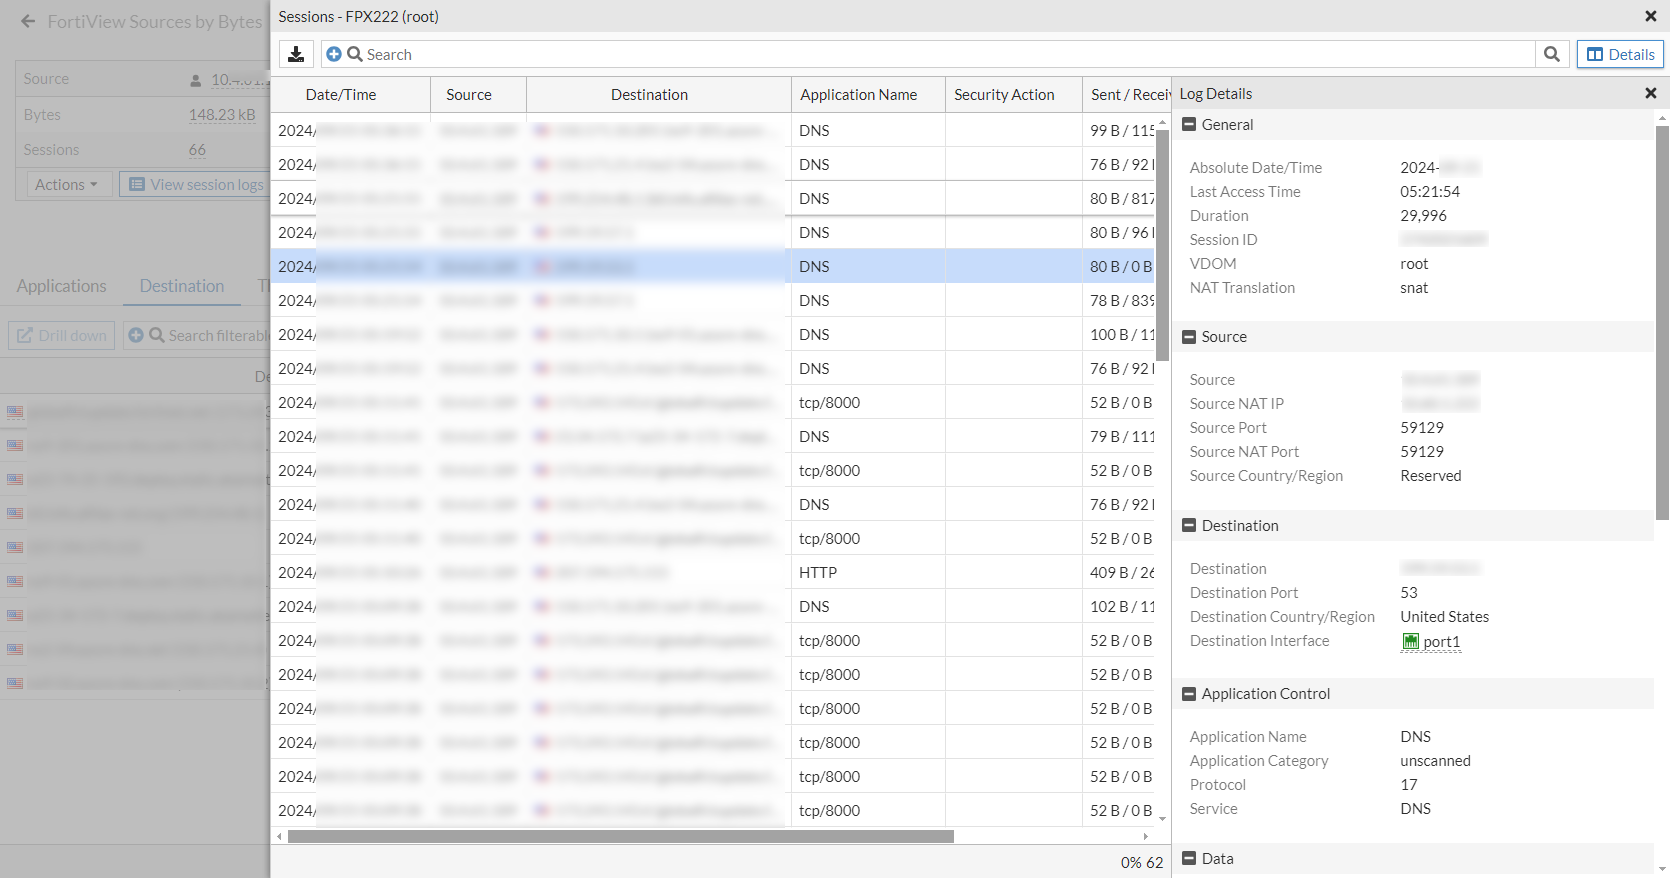
Drill down on any entry by double-clicking on it, or selecting it and clicking Drill down.
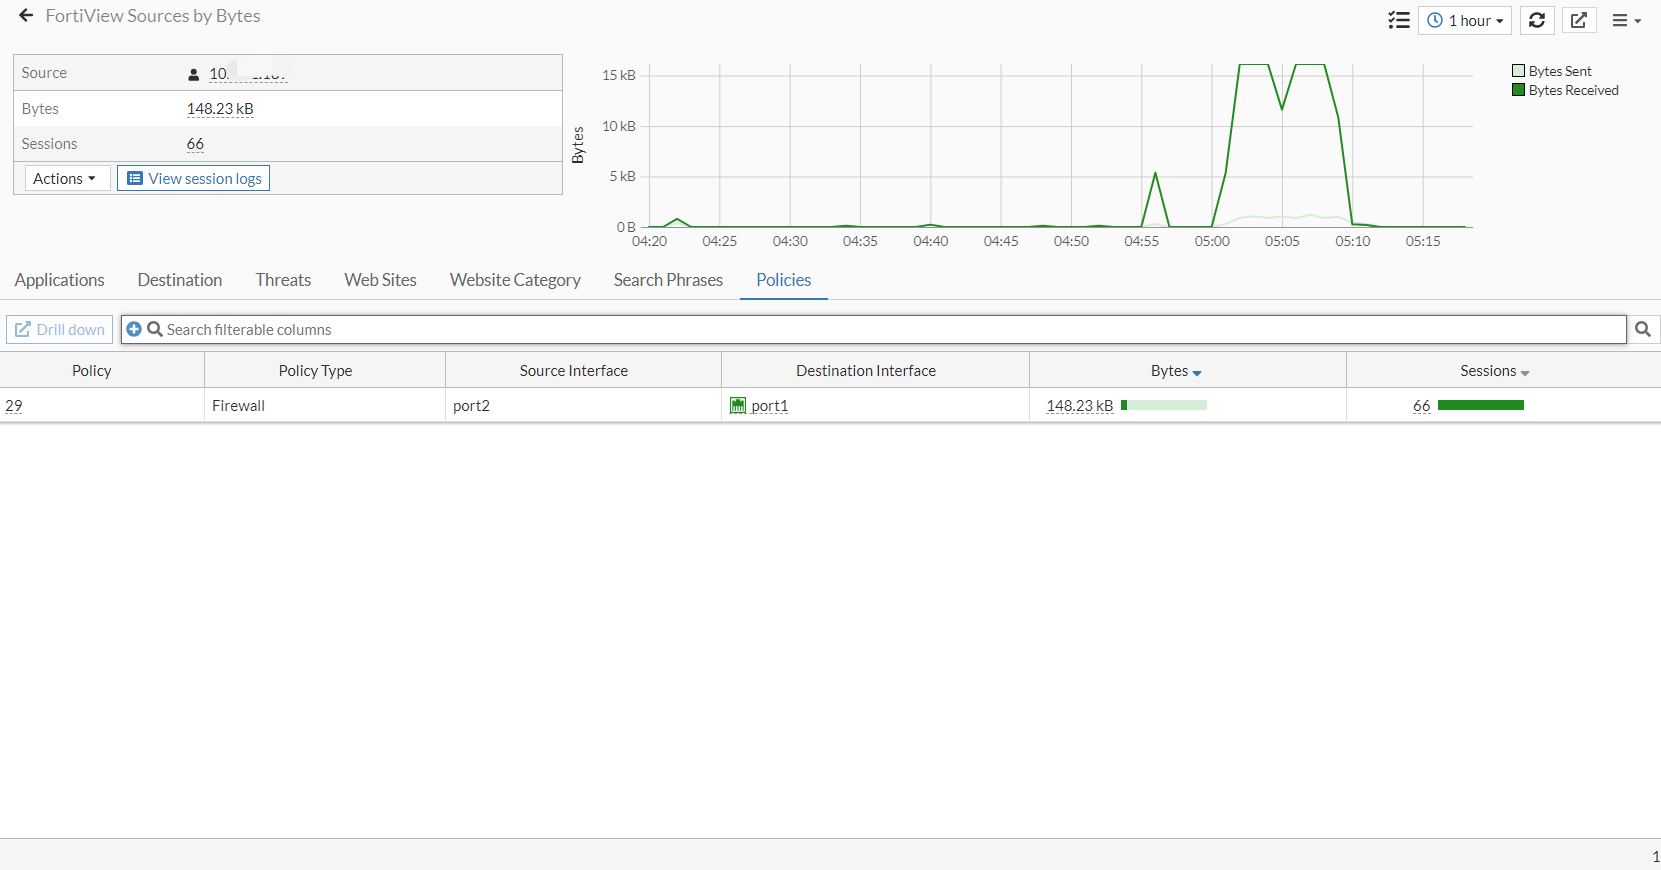
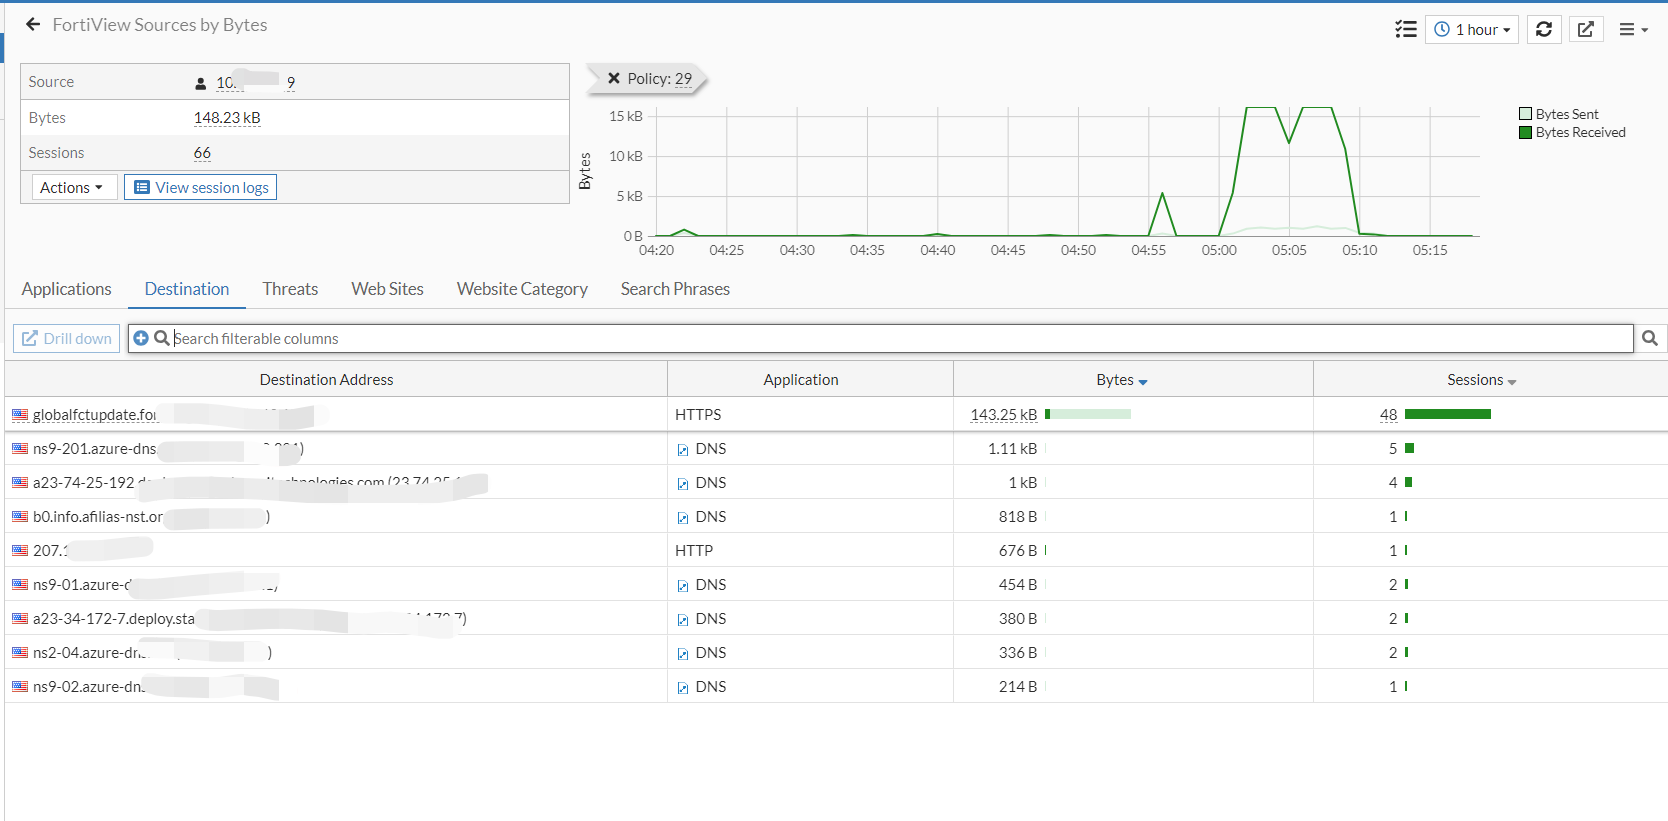
Select a tab, for example Policies, and drill down again to apply a second level filter (listed in the summary). That tab will be removed for the available tabs. Click the X to remove the filter and show that tab again.
Click View session logs to see the log list details.
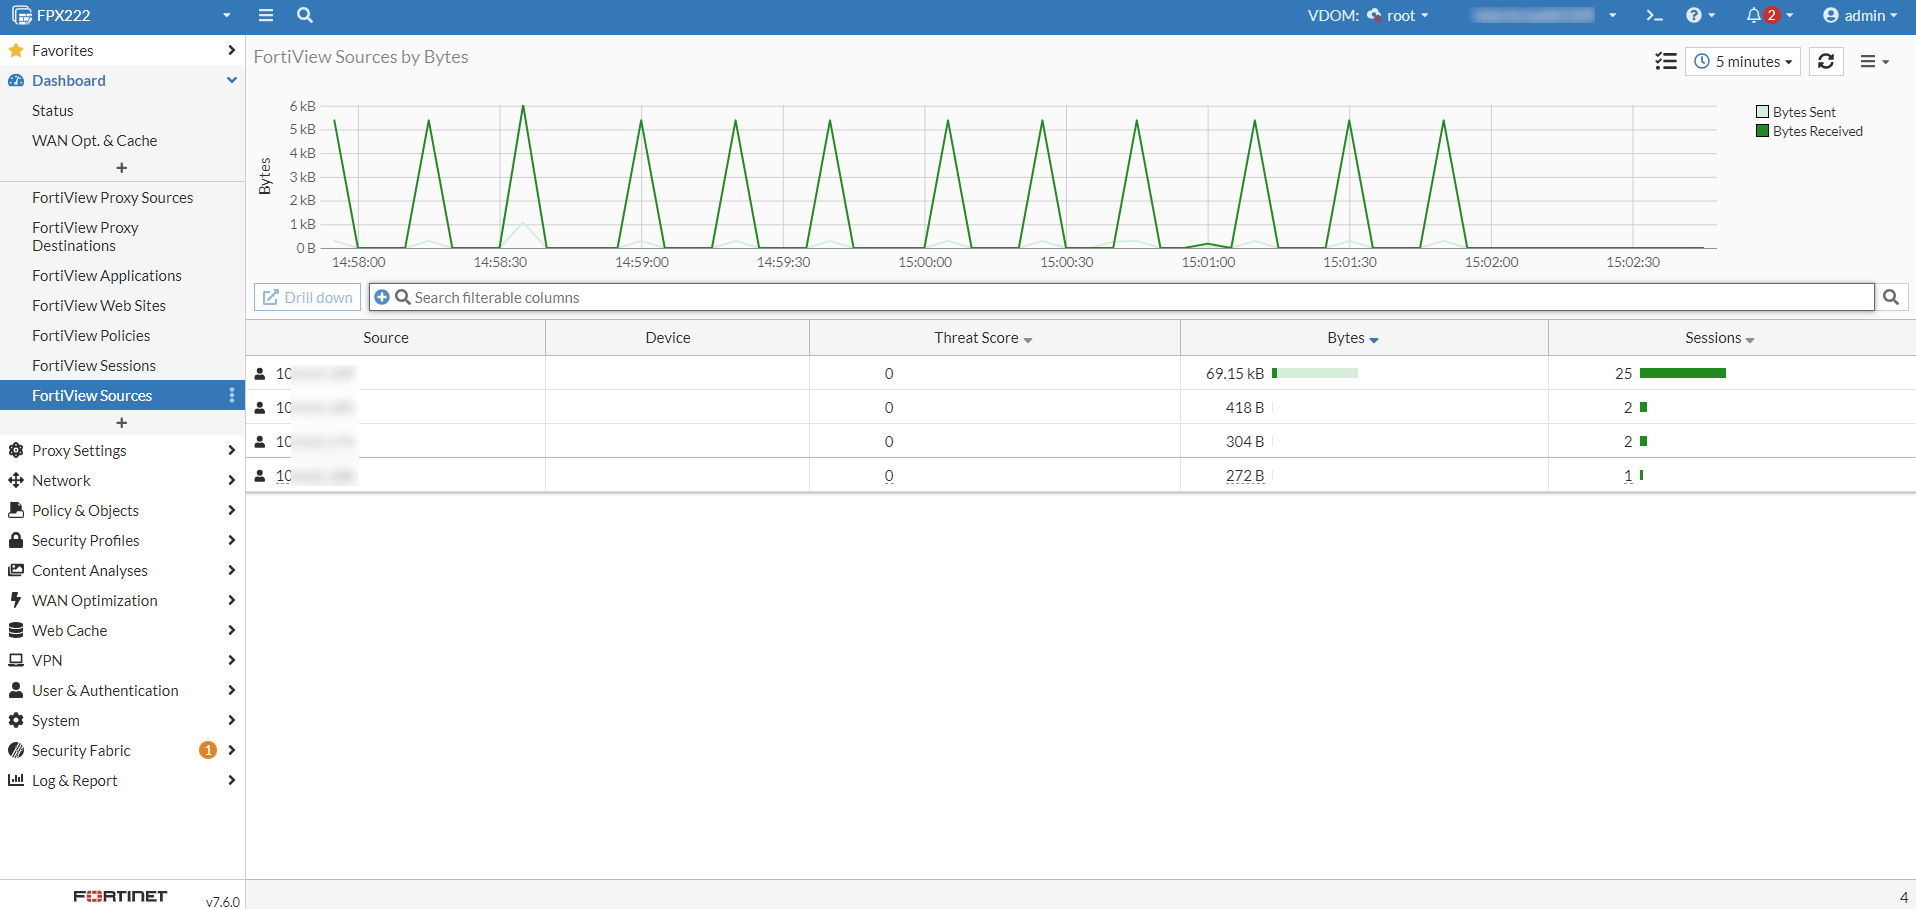
On a FortiView page with enough entries, the graph in the historical view automatically hides when you scroll down the page.
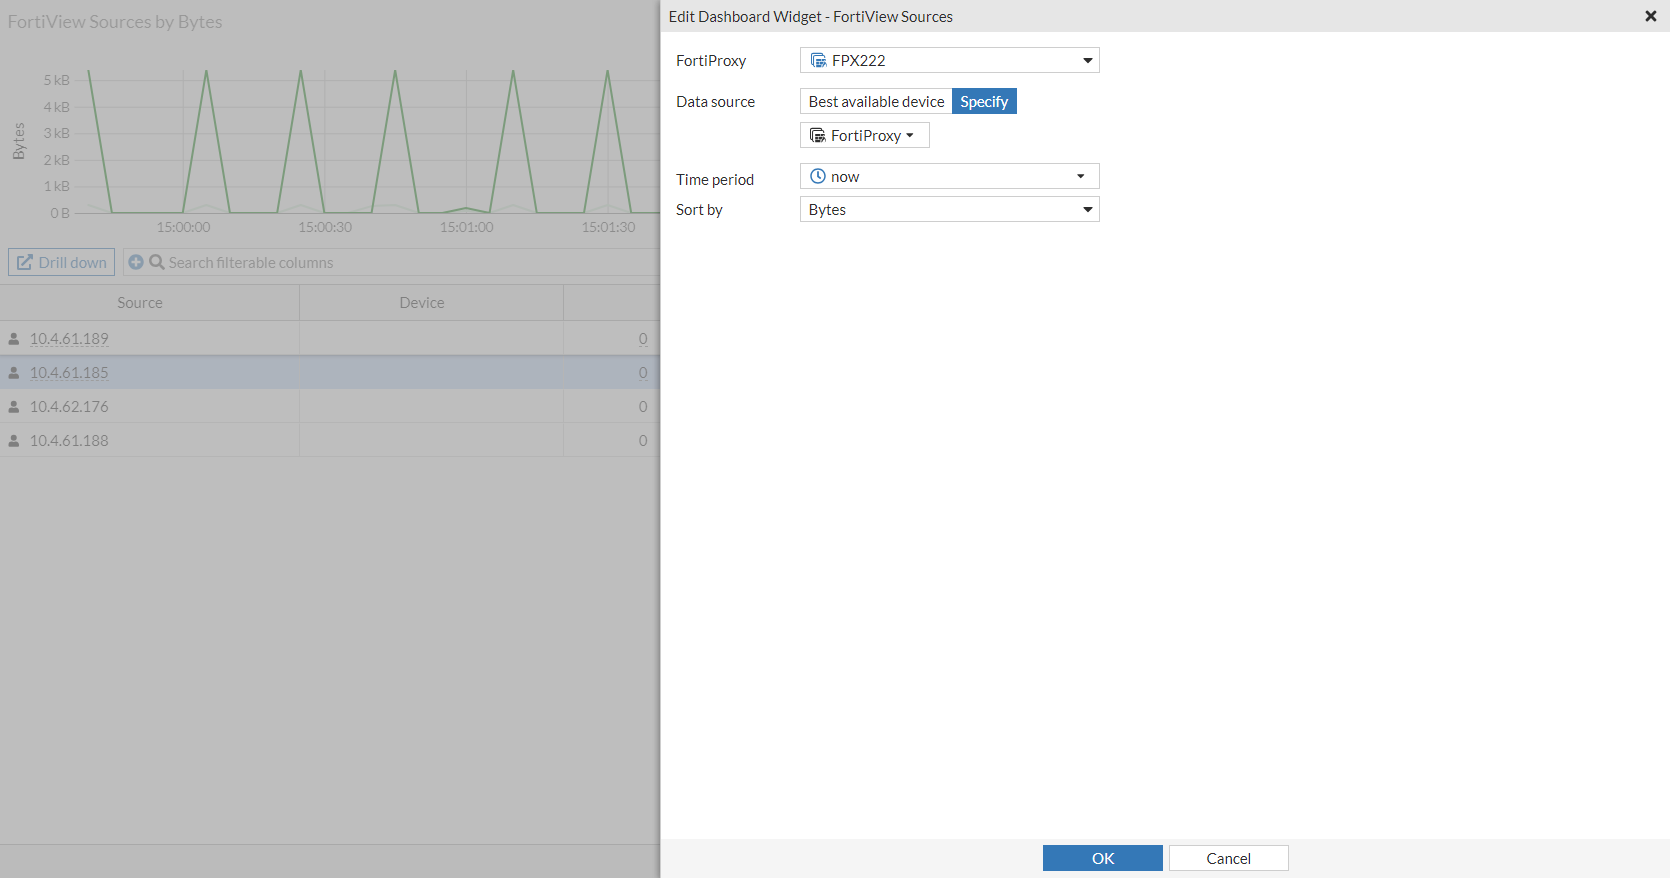
FortiView widgets can be added to custom dashboards. Filters that are applied to the expanded widgets will remain after refreshing the browser.
Status dashboard
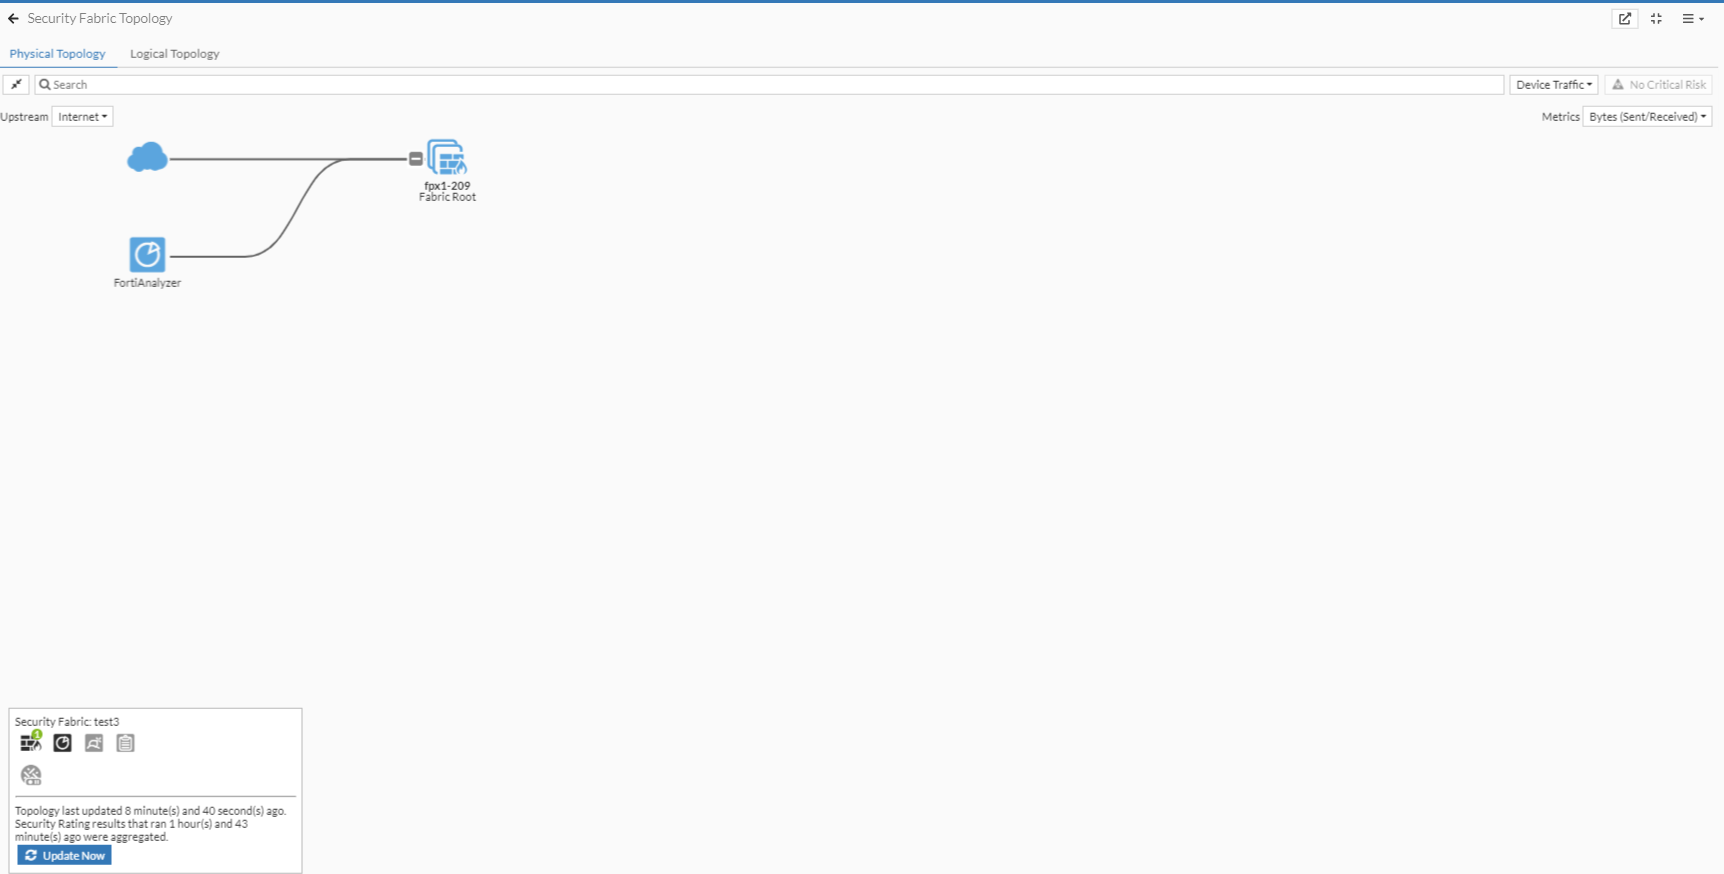
The Licenses and Security Fabric widgets are updated.
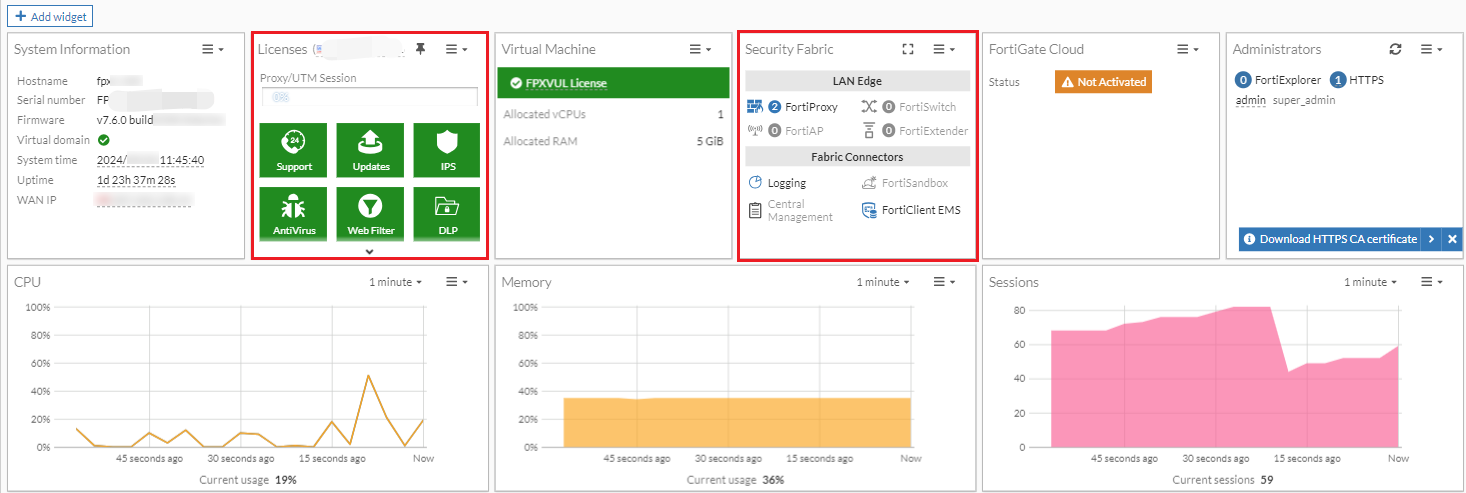
Expand the Security Fabric widget to see the Physical Topology.
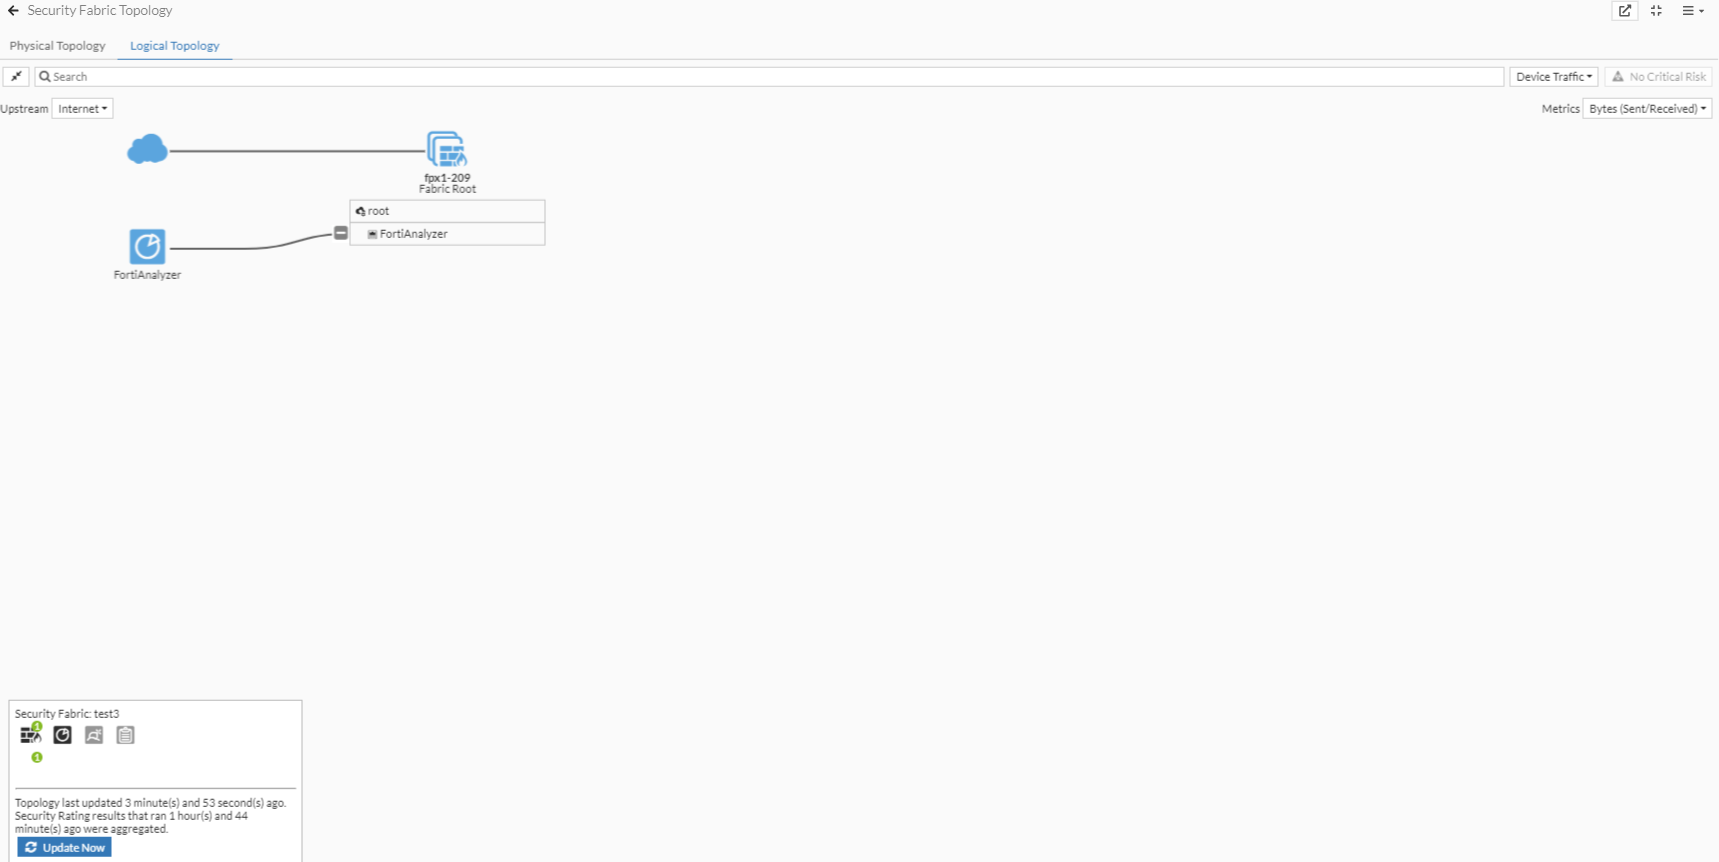
Click the Logical Topology tab to see the logical topology.
Click the Save as Monitor button,  , to save the topology as a dashboard monitor.
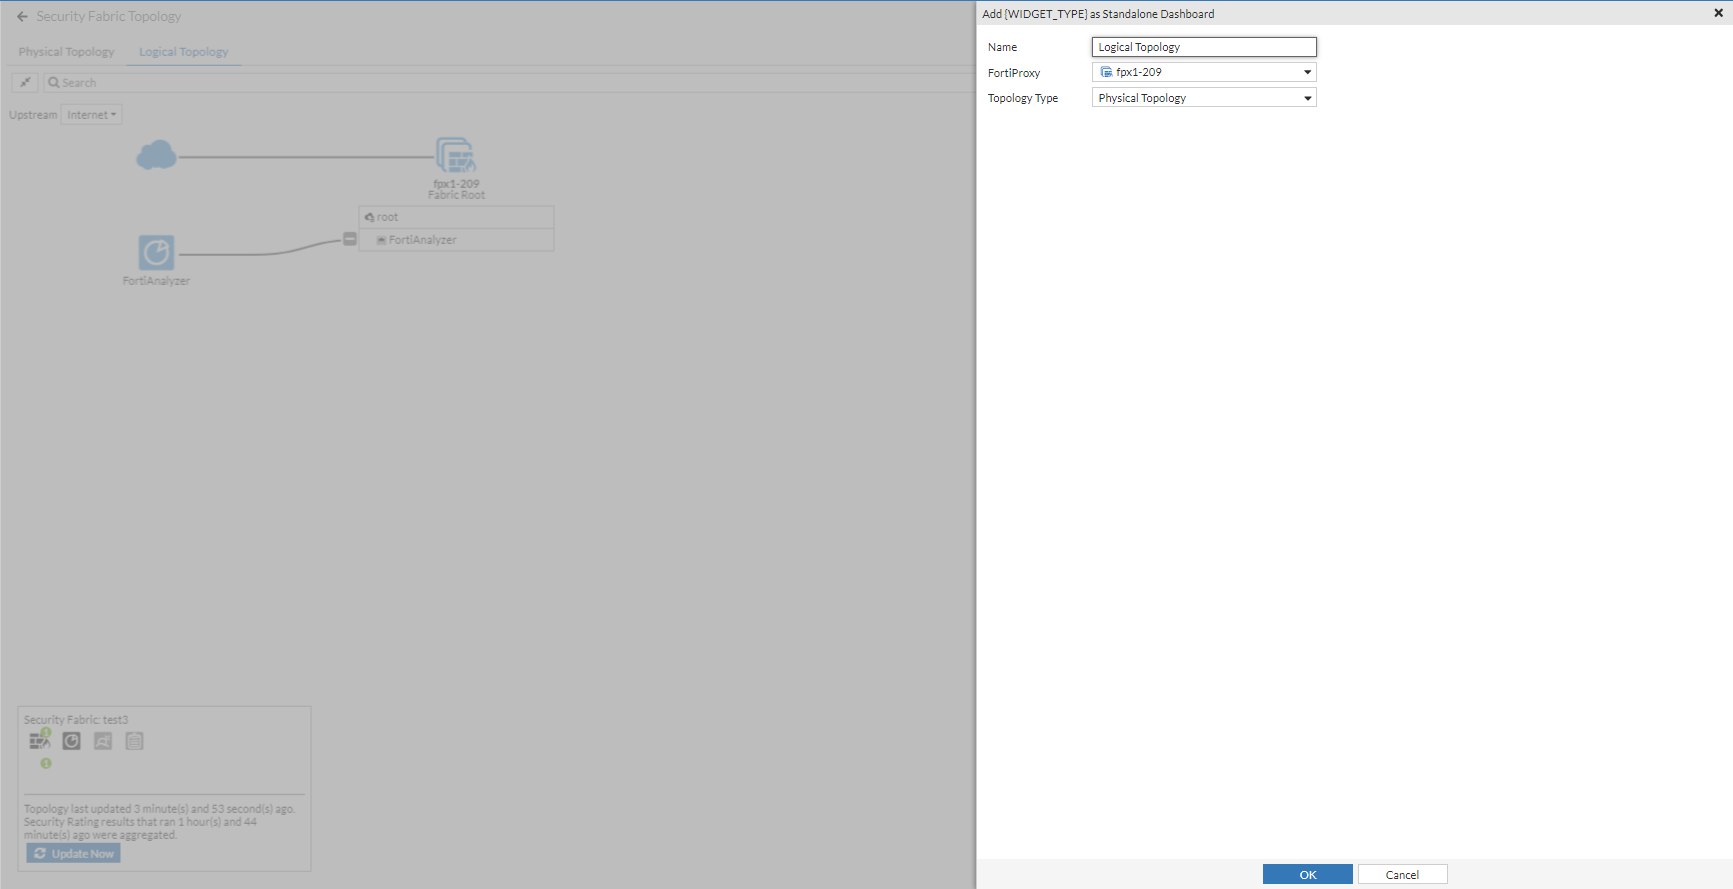
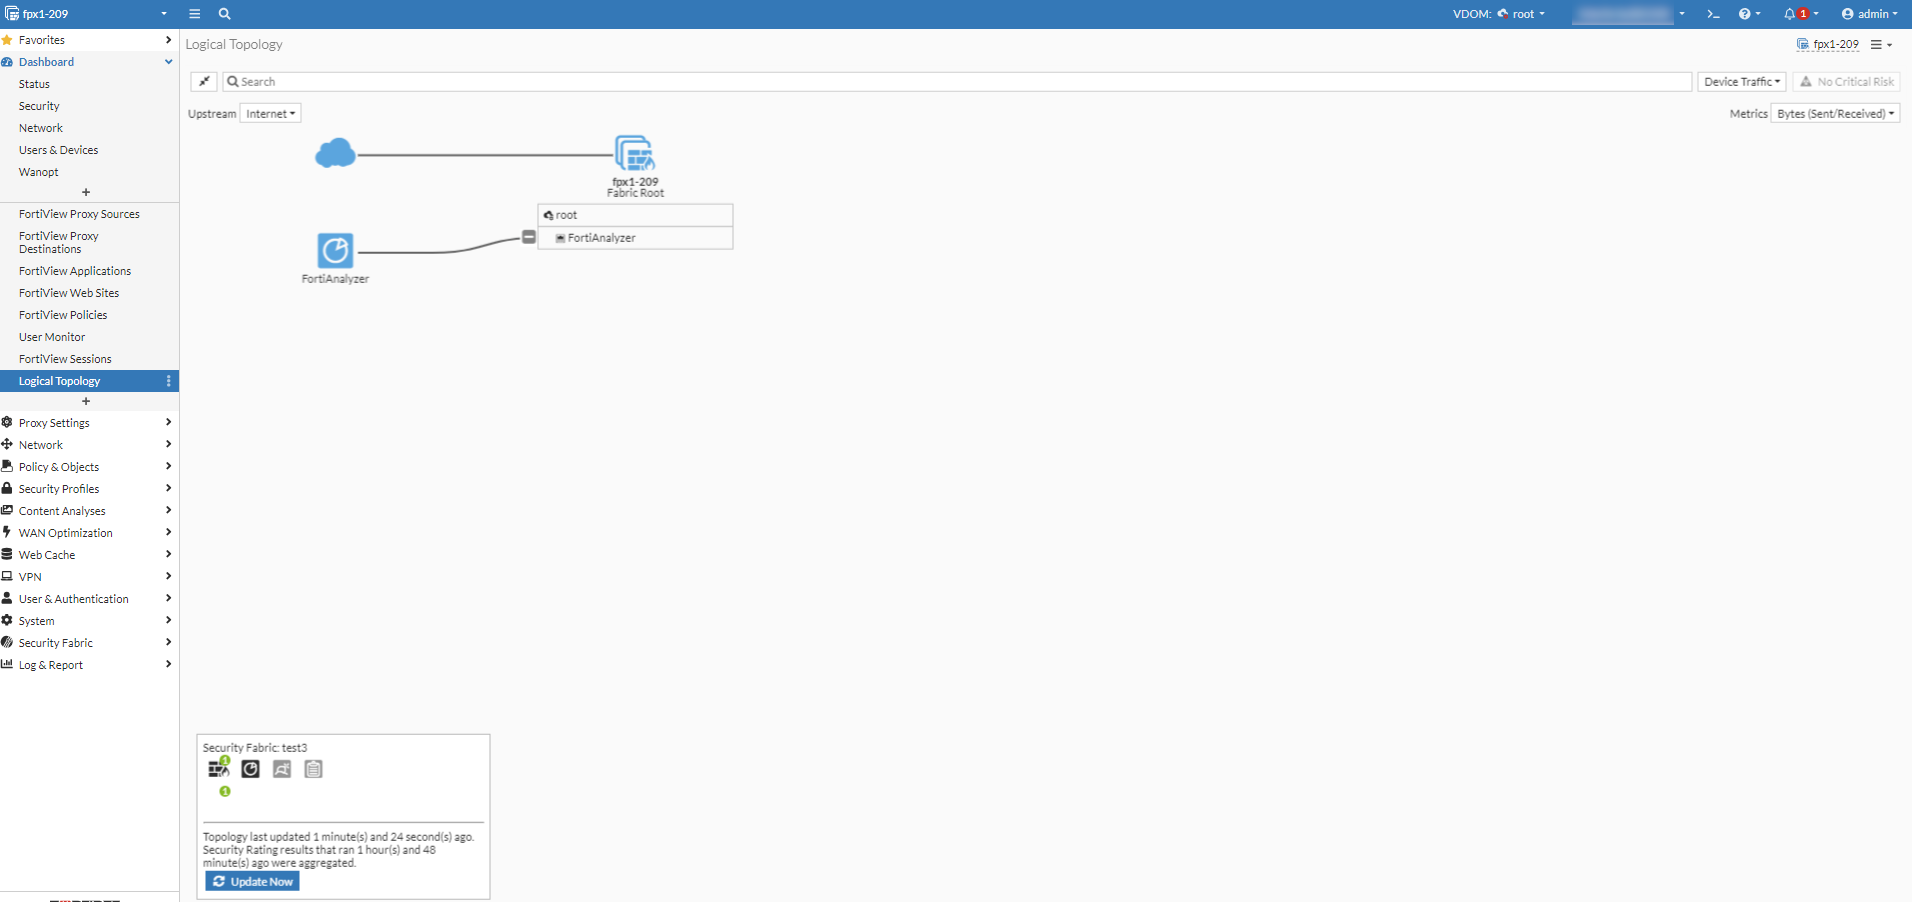
Confirm that the monitor is created and contains the expected data.
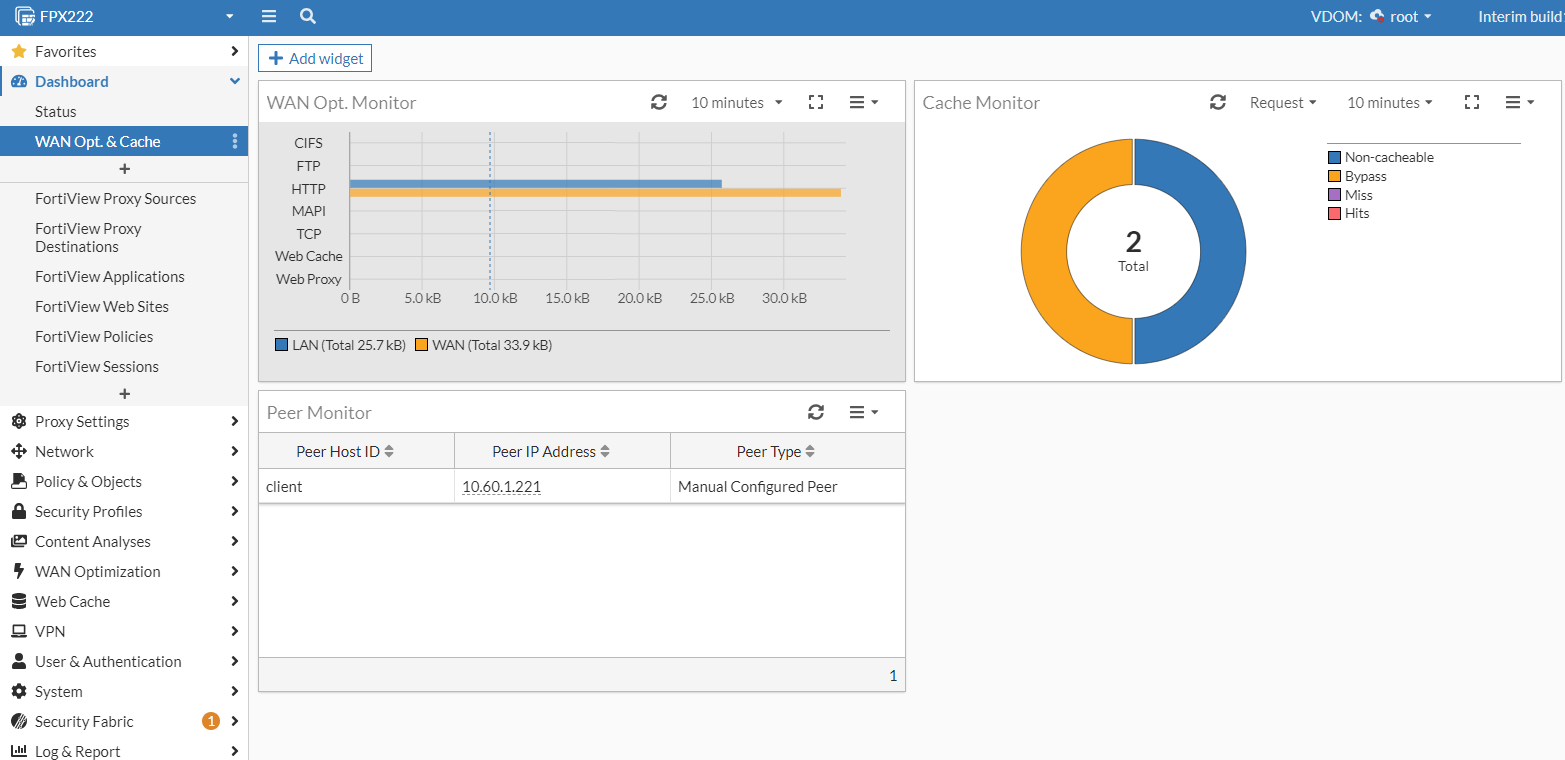
WAN Opt. & Cache dashboard
The WAN Opt. & Cache dashboard is updated.