Using the FortiView Internal Hubs monitor
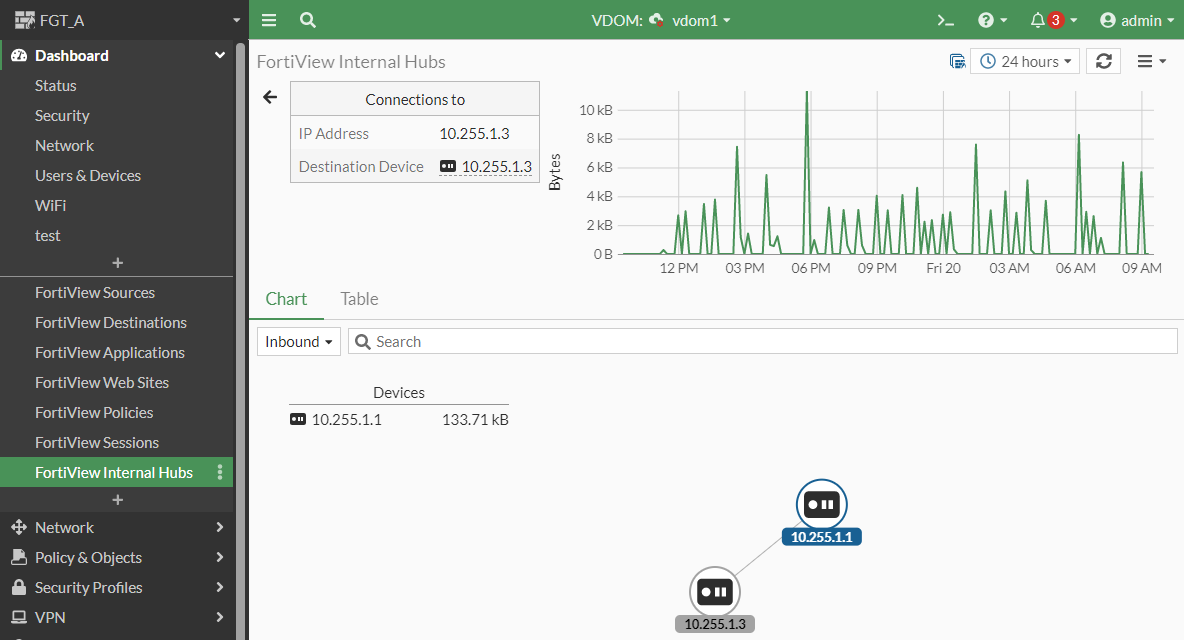
Starting in FortiOS 7.2.4 with FortiSwitchOS 7.2.3, you can use the FortiView Internal Hubs monitor in FortiOS to monitor the connections between devices in private networks, as specified in RFC 1918 (10.0.0.0/8, 172.16.0.0/12, and 192.168.0.0/16). The FortiView Internal Hubs monitor reports the IP addresses and the number of bytes collected from devices behind a FortiSwitch unit. If you drill down on one of the devices, you can see a chart displaying the devices and how they are connected.
|
|
To use the FortiView Internal Hubs monitor:
|
To enable the FortiView Internal Hubs monitor on a managed FortiSwitch unit:
config system interface
edit <FortiLink_interface>
set ip <IP_address_and_netmask>
set switch-controller-netflow-collect enable
next
end
config switch-controller flow-tracking
config collectors
edit <name>
set ip <FortiLink_interface_IPv4_address>
next
end
end
To add the FortiView Internal Hubs monitor:
-
Under Dashboard and click + to add a monitor.
-
In the Add Monitor pane, click the + by FortiView Internal Hubs.
-
From the FortiGate dropdown list, select which FortiGate device to monitor.
-
From the Time Period dropdown list, select how long to monitor (5 minutes, 1 hour, or 24 hours).

-
Click Add Monitor.
-
Under Dashboard, select FortiView Internal Hubs to display the FortiView Internal Hubs page.
-
Right-click on one of the devices and select Drill Down to Details.

-
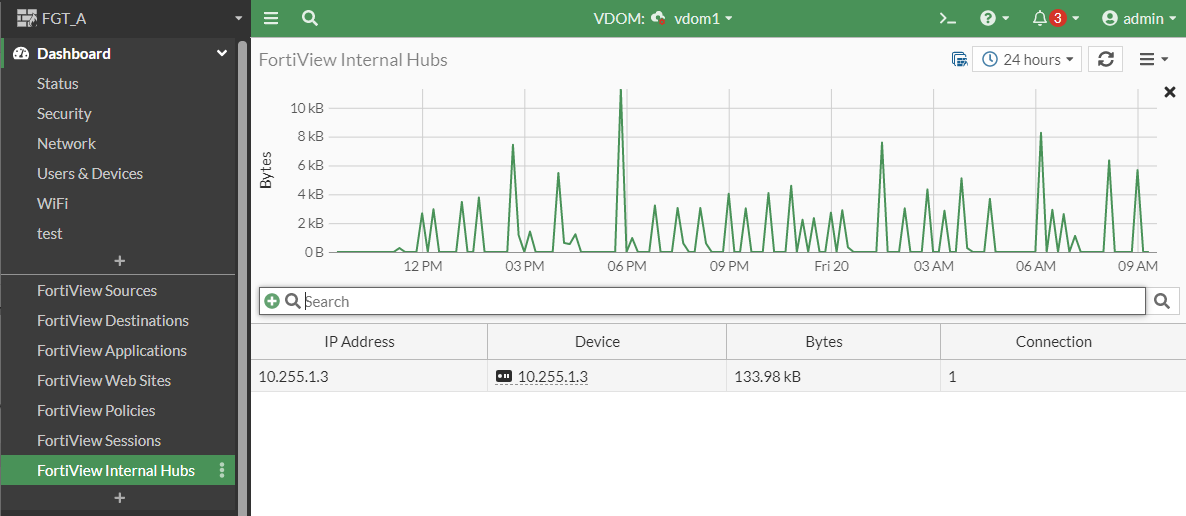
You can select the Chart or Table tab to change how the details are displayed.