Wireless Clients Diagnostics and Tools
The Diagnostics and Tools pane displays the details about the selected Client and allows you to run diagnostic tests.
The pane provides Quarantine, Disassociate, and Locate options. For more information, see Wireless Clients.
On the right, the expand section consists of the following details:
-
Status: This section provides a summary of Signal Strength, Band, Signal Strength/Noise, and Transmission Discard/Retry details.
-
Data Rates: A summary of key data rate metrics, including Downlink and Uplink Data Rates, and their corresponding MCS (Modulation and Coding Scheme) Indexes.
-
Client Capabilities: Displays client status for Optimized Roaming (802.11k), Fast Roaming (802.11r), and Assisted Roaming (802.11v). The capability is shown in green if it is supported and red if it is not supported.
A Client Connectivity widget is also introduced providing an overview of the connection health of wireless clients. See Wireless.
The Diagnostics and Tools pane has the following tabs to view more details:
AI Insights
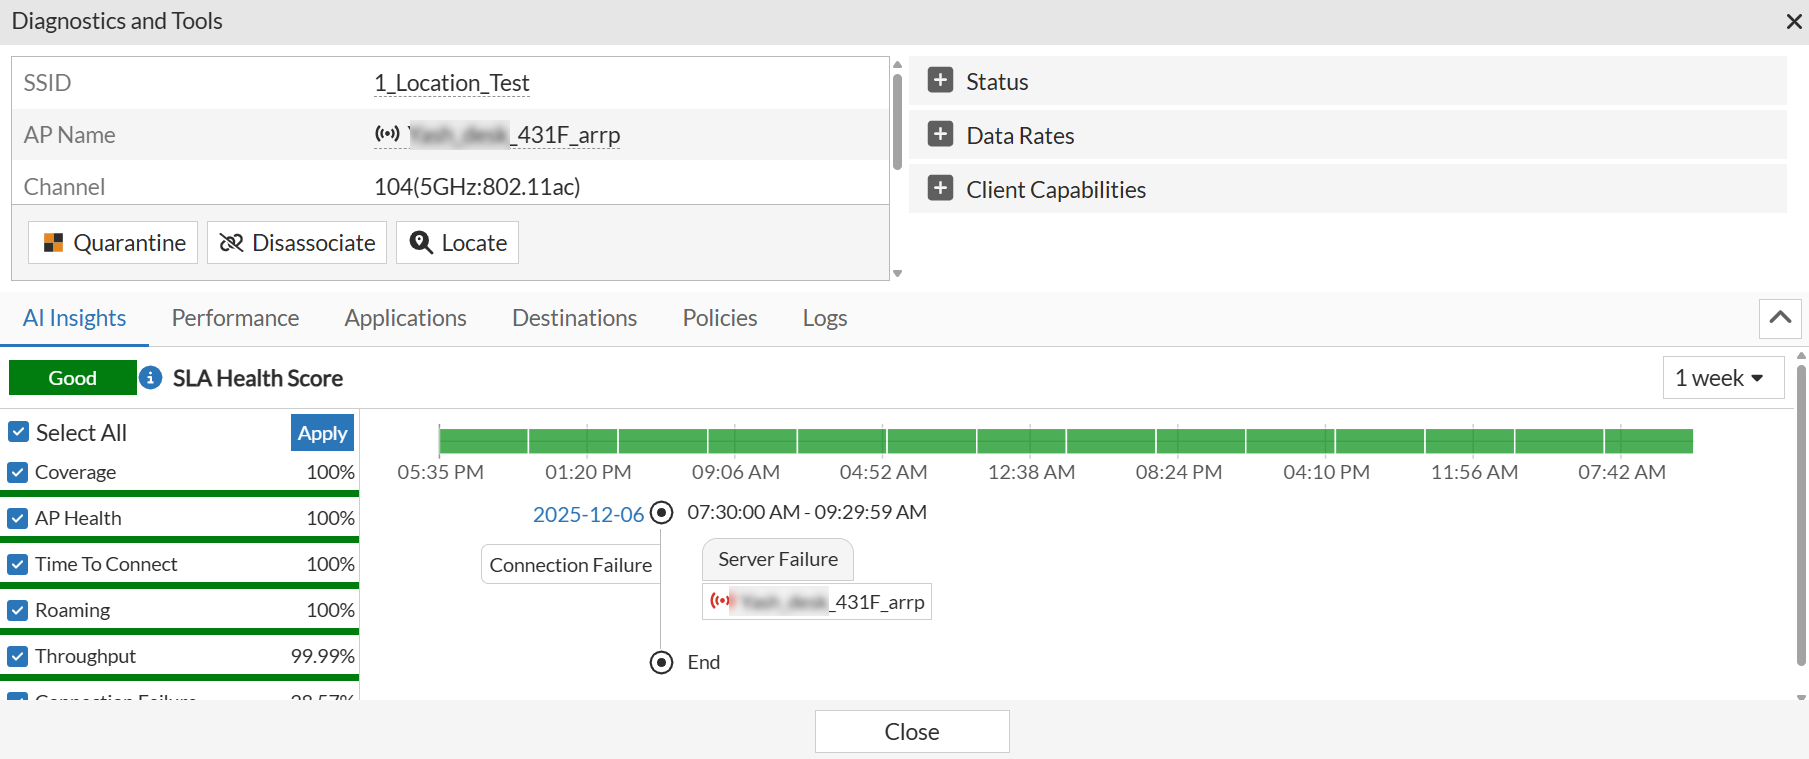
The AI Insights tab helps to analyze various performance metrics, identify issues, and provide detailed insights into the root cause of network problems, helping administrators maintain high service levels.
Note: This feature may not work as expected on Safari browser. For the best experience, use Chrome, Firefox, or Microsoft Edge instead.
The SLA Health Score provides the overall high-level score.
-
Good for a score more 70
-
Fair for a score between 30 and 70
-
Bad for a score less than 30
Below the overall score, a list of individual SLAs or metrics is shown with their current health scores. You can select the SLAs that you want to track.
The following metrics are available:
-
AP Health
-
Roaming
-
Coverage
-
Throughput
-
Connection Failure
-
Time To Connect
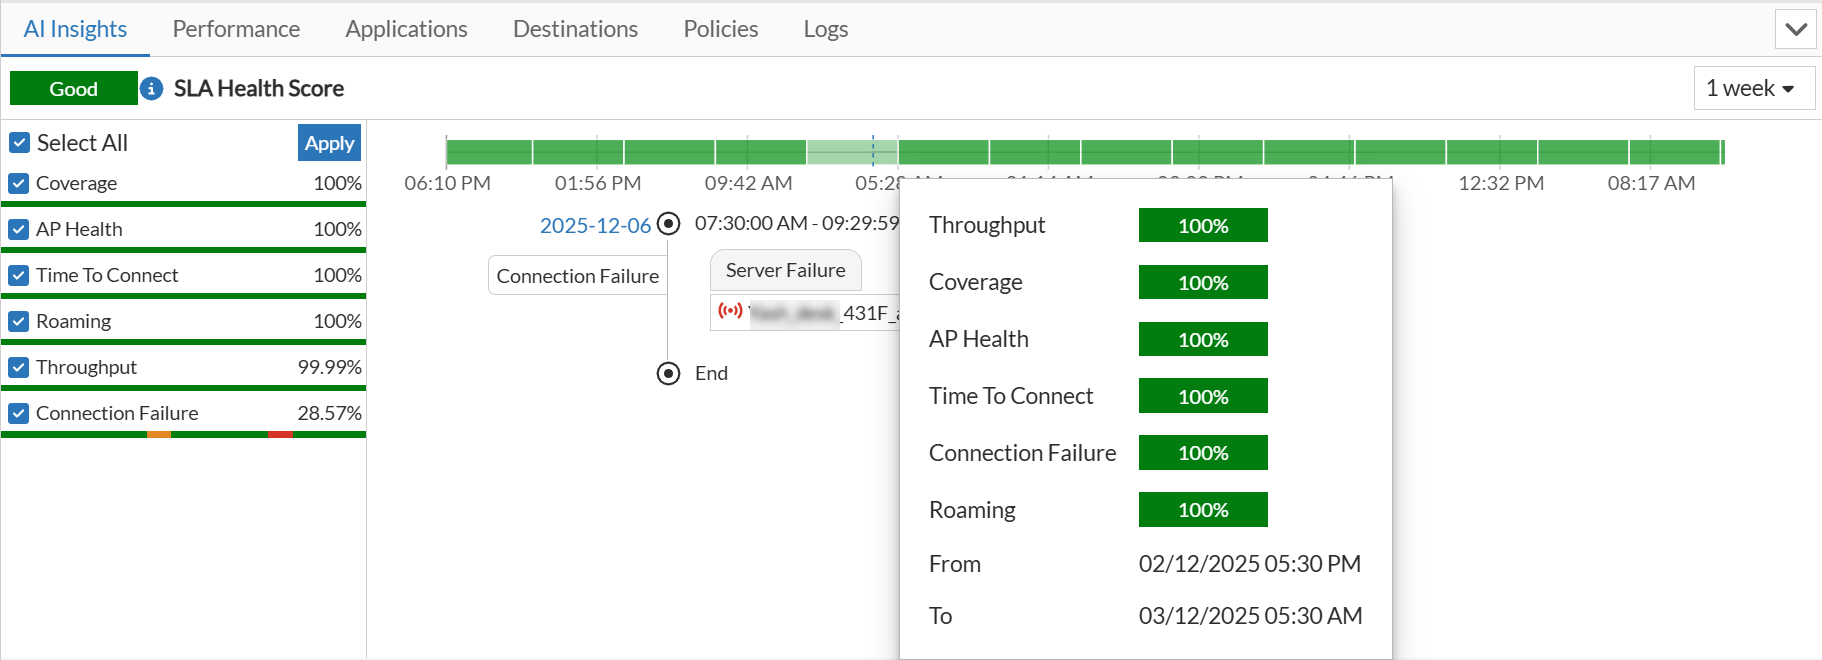
When you click an SLA, the corresponding SLA Summary window opens with more details.
The bar graph shows the performance trend over a selected time period (in this case, 1 day). The graph is divided to equal time segments. Based on the health score of each segment, the segments are colour coded as green (good), orange (fair), and red (bad).
Clicking on a specific time segment displays more details events that occurred during the time period.
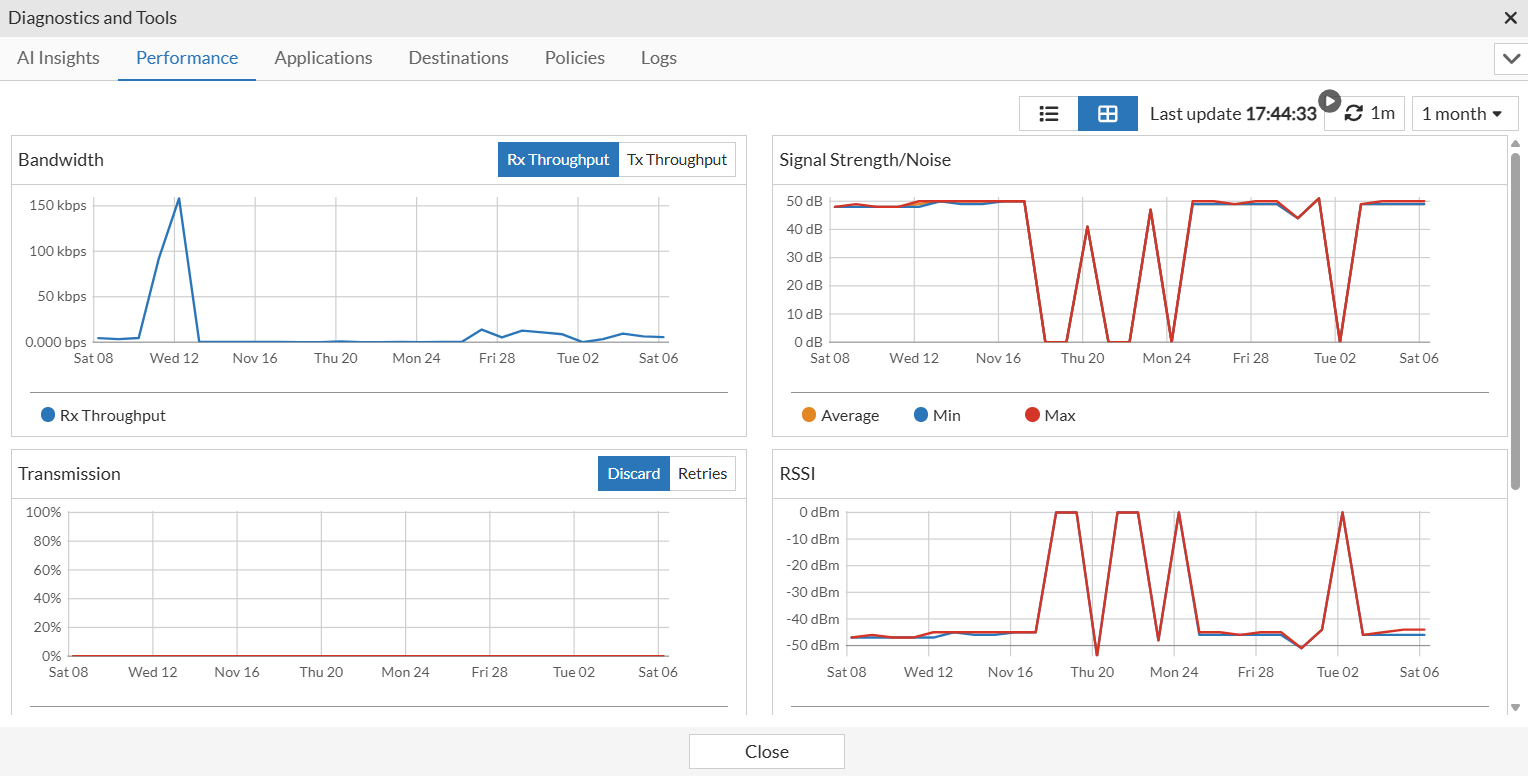
Performance
The Performance tab displays information about the client's performance. You can filter the trends based on the selected duration or customized time slot; select a time window or define a Custom range. The custom range allows the selection of a minimum of 1 day and the maximum is the duration of log retention configured in System > Settings.
The following charts are available:
-
Bandwidth: Displays the data transfer rate of the network over time, allowing you to monitor both Receive (Rx) and Transmit (Tx) throughput speeds.
-
Signal Strength/Noise: Displays the Signal-to-Noise Ratio to assess connection quality. Higher values indicate a strong signal with minimal background interference.
-
Transmission: Tracks the integrity and reliability of data packet delivery by monitoring specific metrics for discarded packets and retry attempts.
-
RSSI: Displays the trend of Received Signal Strength Indicator (RSSI) over a selected time period for a client. RSSI is a measure of the Wi-Fi signal strength your device receives from an Access Point, typically measured in dBm (decibel milliwatts). A value closer to 0 dBm (for example, -30 dBm) indicates a strong signal, while a value closer to -90 dBm indicates a very poor one.
You can click on any point in the chart to see detailed information like Timestamp, If Index, RSSI, Tx Data Rate, and Rx Data Rate. -
Data Rate: Shows the trend of data transmission speeds in both uplink (from the client to the access point) and downlink (from the access point to the client) directions for a client. You can view either of these trends at a time. The speeds are measured in Mbps (Megabits per second).
Similar to the RSSI chart, clicking on any point provides a detailed information like Timestamp, If Index, Tx Data Rate, and Rx Data Rate.
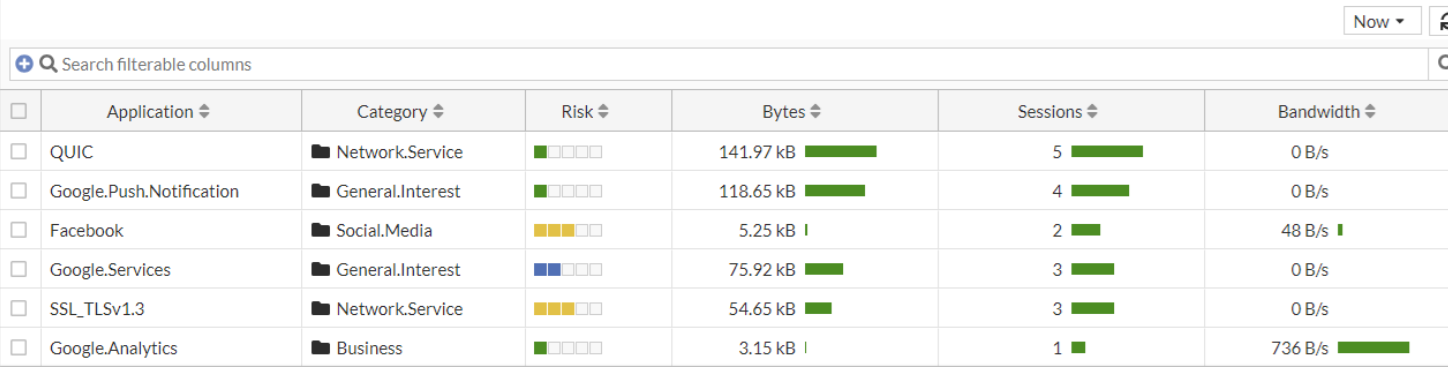
Applications
The Applications tab displays a list of applications in use by the selected client, along with details such as the application name, category, risk, data usage, session and bandwidth details.
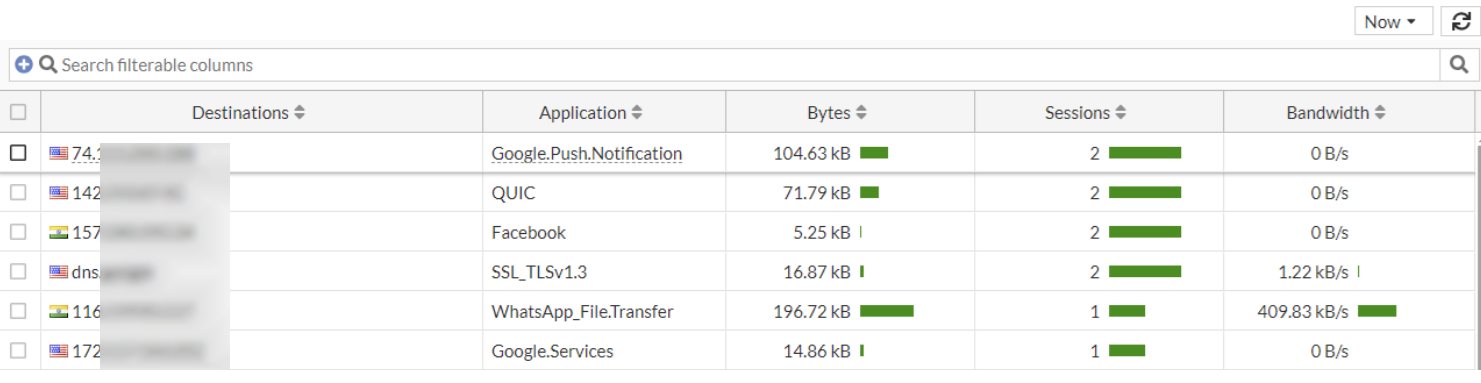
Destinations
The Destinations tab displays a list of network destinations accessed by the selected client, along with details such as the destination IP address, application name, data usage, session and bandwidth details.
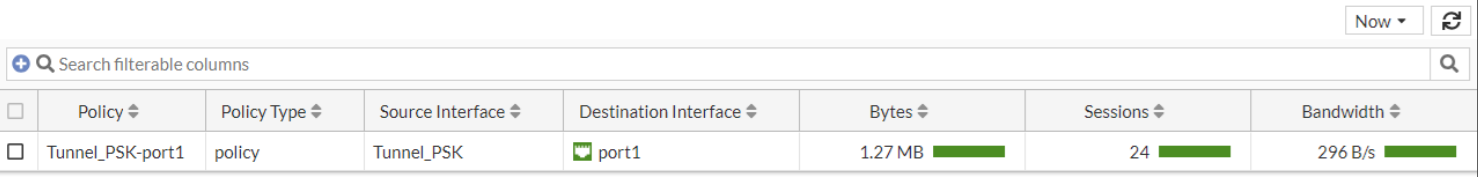
Policies
The Policies tab displays information about any policies applied to the selected client, such as policy name, policy type, source interface, destination interface, data usage, session and bandwidth details.
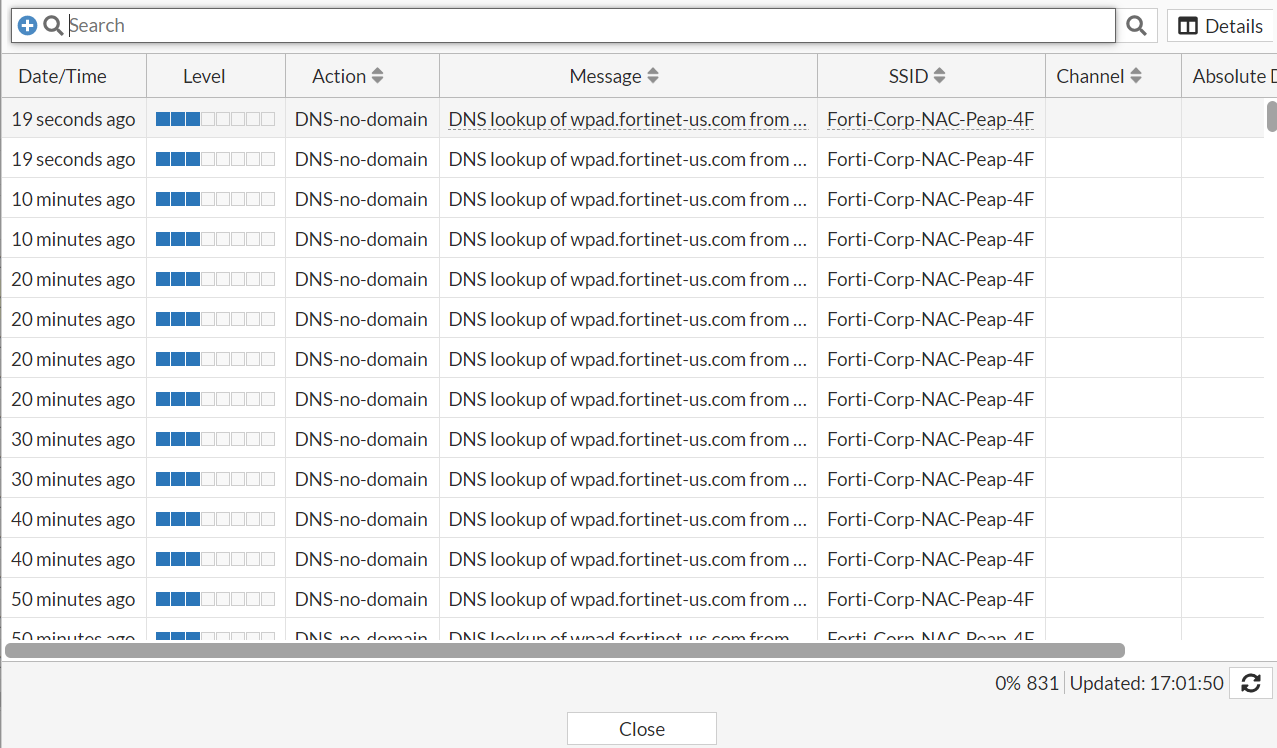
Logs
The Logs tab displays detailed logs of events related to the selected client, allowing you to troubleshoot any issues. To view detailed information, select log and click Details.