
Connecting to FortiData
Fabric connectors are used to integrate FortiData with FortiGate. You must configure both FortiData and FortiGate to establish the connection between them. Configure the products in the following order:
-
On FortiData, configure a fabric connector to FortiGate, and add FortiGate as an allowed device. See Connecting FortiData to FortiGate.
-
On FortiGate, enable FortiData. See Enabling FortiData.
-
On FortiGate, authorize FortiData. See Authorizing FortiData.
Information about Diagnostics is also included.
See FortiData labels for information about using FortiData labels.
Enabling FortiData
FortiData can be enabled only in the CLI.
To enable FortiData in the CLI:
-
In FortiOS, enable FortiData:
config system fortidata
    set status enable
    unset source-ip
    set interface-select-method auto
    set vrf-select 0
				end
Command
Description
status {enable | disable}
Enable/disable FortiData.
source-ip <string>
Source IPv4 address used to communicate with FortiData.
interface-select-method {auto | sdwan | specify}
Specify how to select outgoing interface to reach server.
-
auto: Set outgoing interface automatically. -
sdwan: Set outgoing interface by SD-WAN or policy routing rules. -
specify: Set outgoing interface manually.
vrf-select
VRF ID used for connection to server (0 to 511, default = 0).
-
Authorizing FortiData
On FortiGate, authorize FortiData to establish a connection between the two products.
To authorize FortiData:
-
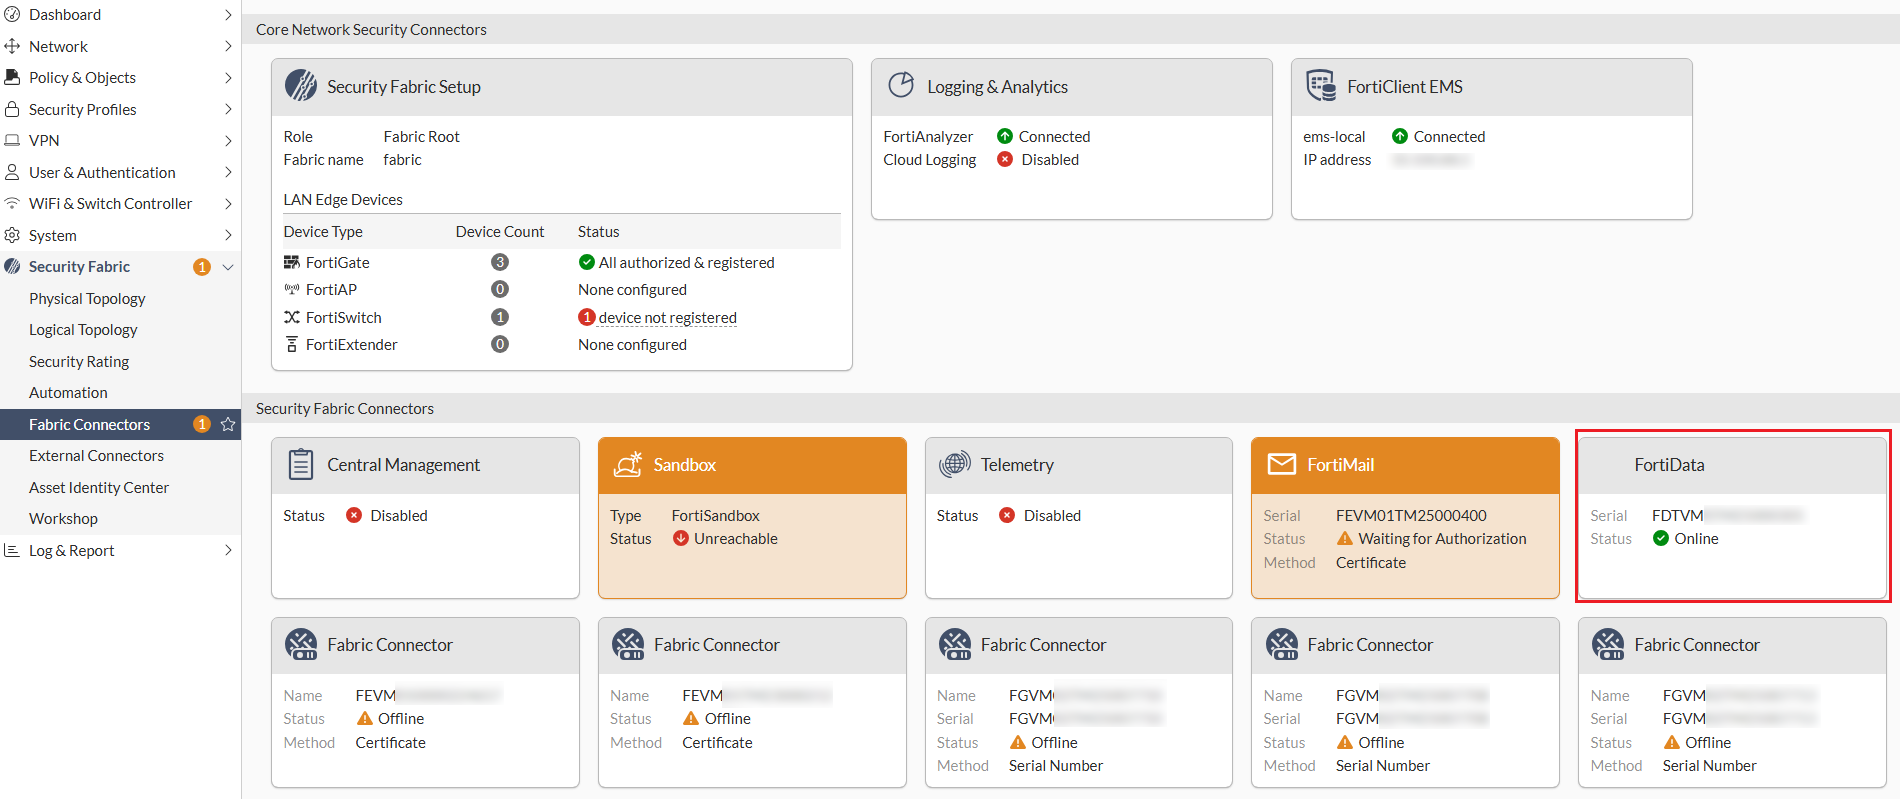
On the Security Fabric > Fabric Connectors page, click the FortiData card and select Authorize. Accept the certificate and verify that the status of the FortiData card changes to Online.
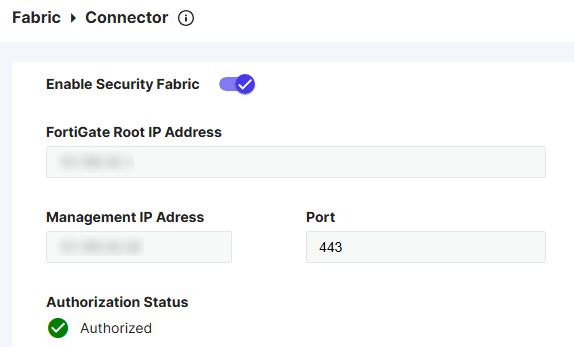
To further verify the authorization status in FortiData, go to the Fabric > Connector page and ensure that the authorization status is Authorized.
-
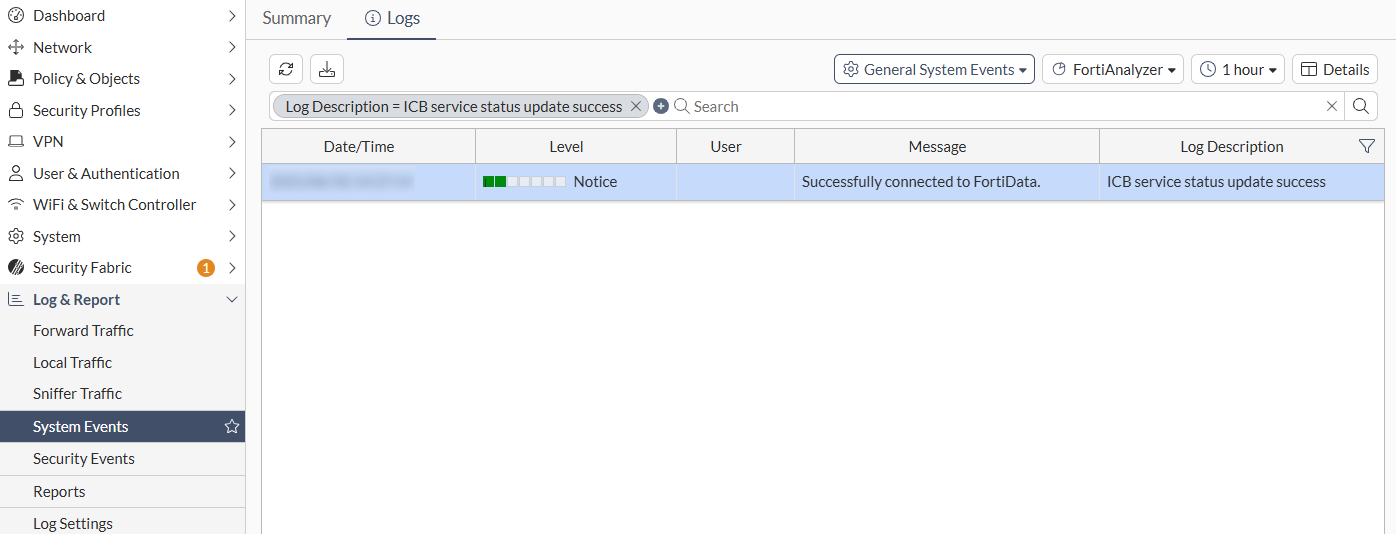
Go to the Log & Report > System Events page and verify the log stating that the FortiGate is successfully connected to the FortiData.
Diagnostics
Use the following diagnose commands to debug FortiData integration issues:
-
Verify the integration is successful and a list of supported file types is returned:
# diagnose sys icb status
current time 2025-06-18 15:32:39 -07:00
icb.status_updated.count: 21
icb.status_updated.last.time: 1750282634
icb.status_updated.last.ago: 3325
icb.status_updated.last.local: 2025-06-18 14:37:14 -0700
======= fai =======
icb.state: stop
icb.file_type_list: not available
======= fsa =======
icb.state: stop
icb.file_type_list: not available
======= fortidata =======
icb.state: ready
icb.file_type_list:
ft.1: AVFT_JAVASCRIPT (7)
ft.2: AVFT_MSOFFICE (10)
ft.3: AVFT_PDF (42)
ft.4: AVFT_MSOFFICEX (52)
ft.5: AVFT_C_CPP (110)
ft.6: AVFT_JPEG (1006)
ft.7: AVFT_GIF (1007)
ft.8: AVFT_TIFF (1008)
ft.9: AVFT_PNG (1009)
ft.10: AVFT_BMP (1010)
icb.file_type_extensions:
ext.1: avif
ext.2: cer
ext.3: cfg
ext.4: conf
ext.5: crt
ext.6: csv
ext.7: env
ext.8: go
ext.9: ini
ext.10: java
ext.11: jpeg
ext.12: json
ext.13: key
ext.14: kt
ext.15: md
ext.16: odp
ext.17: ods
ext.18: odt
ext.19: p7b
ext.20: pem
ext.21: php
ext.22: py
ext.23: rtf
ext.24: service
ext.25: sh
ext.26: tiff
ext.27: toml
ext.28: txt
ext.29: webp
ext.30: yaml
ext.31: yml
-
Show statistics:
# diagnose sys icb stats
-
Restart the ICB manager daemon:
# diagnose sys icb restart
-
Query FortiData-related information:
# diagnose sys fortidata {labels | local-labels | service-ip}