Status dashboard
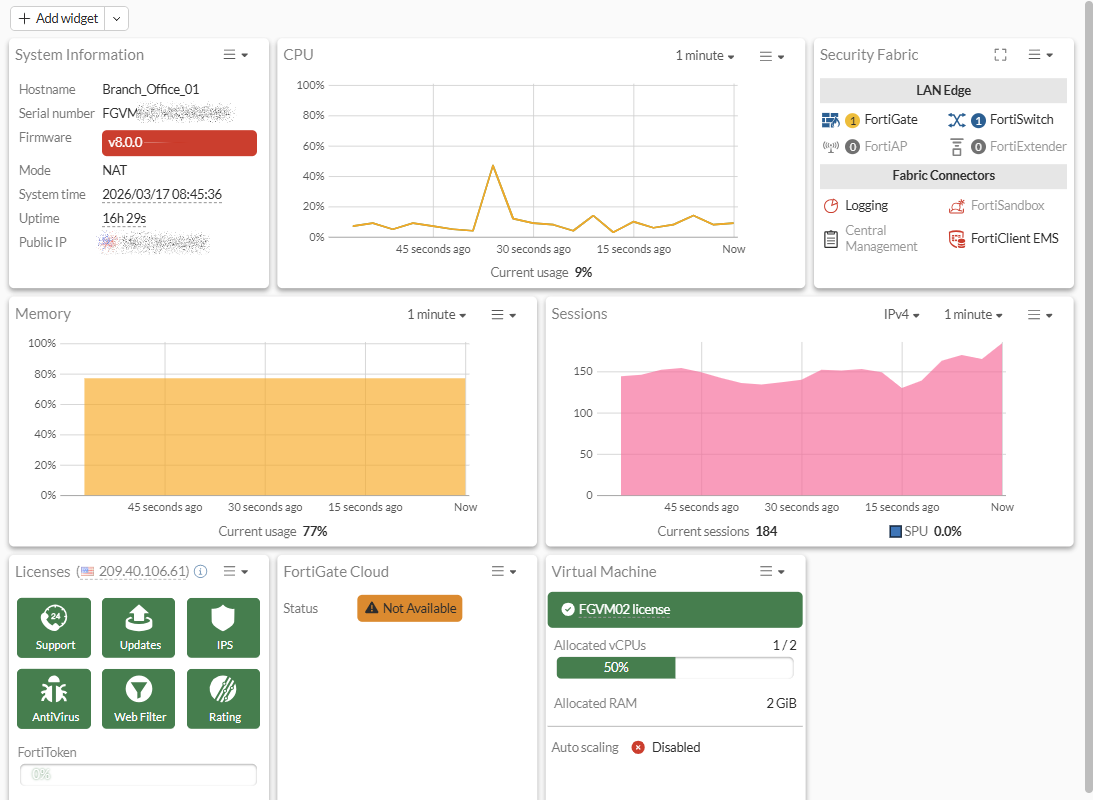
The Status dashboard provides an overview of your FortiGate device and the devices in your Security Fabric. If your FortiGate is a virtual machine, information about the virtual machine is also displayed in the dashboard.
Updating system information
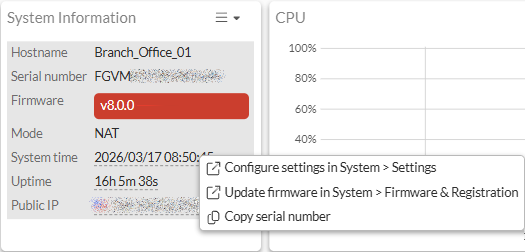
The System Information widget contains links to the Settings module where you can update the System Time, Uptime, and Public IP.
A notification will appear in the Firmware field when a new version of FortiOS is released. Click Update firmware in System > Firmware & Registration to view the available versions and update FortiOS.
You can also click Copy serial number to copy the FortiGate serial number to the clipboard and paste in other applications.
Resource widgets
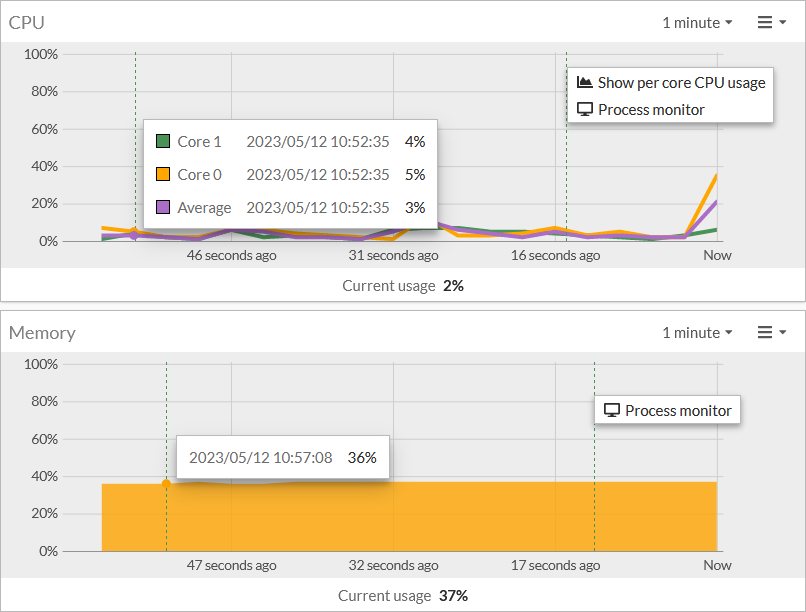
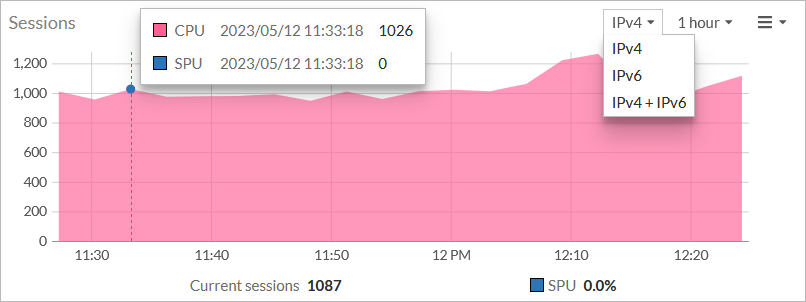
The resource widgets show the current usage statistics for CPU, Memory, and Sessions.
Click the CPU widget to show the per core CPU usage or access the Process monitor.
You can switch between IPv4, IPv6, or IPv4+IPv6 in the Sessions monitor.
Viewing Fabric devices
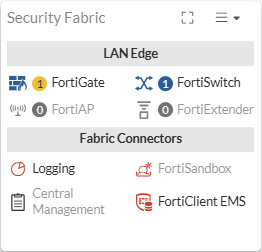
The Security Fabric widget provides a visual overview of the devices connected to the Fabric and their connection status. Hover of a device icon to view more information about the device.
Click a device in the Fabric to:
- View the device in the physical topology
- Register, configure, deauthorize, or log in to the device
- Open Diagnostics and Tools
- View the FortiClient Monitor
These options will vary depending on the device.
Click Expand to view all the devices in the Fabric at once.
Viewing administrators
This widget is hidden by default. See Editing dashboards of widgets and monitors for information about adding widgets.
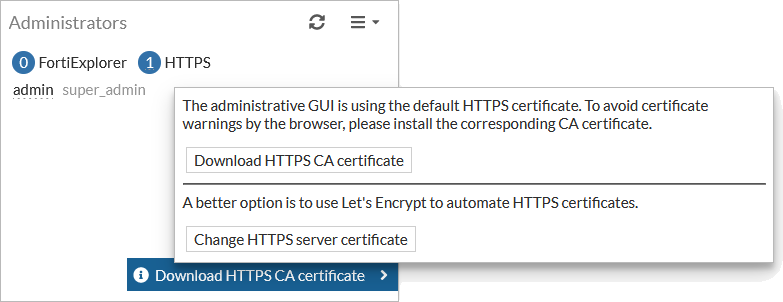
The Administrators widget displays the active administrators and their access interface. Click the username to view the Active Administrator Sessions monitor. You can use the monitor to end an administrator's session.
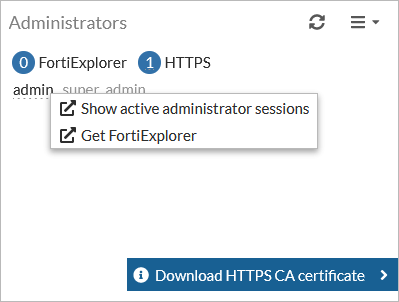
If the GUI is using the default HTTPS certificate, a warning is shown where you can download the HTTPS CA certificate or change the HTTPS server certificate.
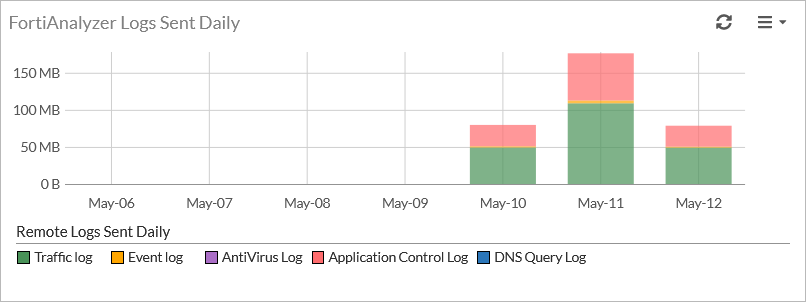
Viewing logs sent for remote logging source
This widget is hidden by default. See Editing dashboards of widgets and monitors for information about adding widgets.
The Logs Sent widget displays chart for remote logging sources (FortiAnalyzer, FortiGate Cloud, and FortiAnalyzer Cloud) sent daily.