
Application performance monitoring analytics NEW
The FortiView SD-WAN Application Performance widget leverages the passive WAN application performance monitoring of SD-WAN to log and monitor application performance metrics. See also Application performance monitoring . These metrics are aggregated into the following FortiView report types:
-
Application performance overview: Overview of different performance metrics of monitored applications.
-
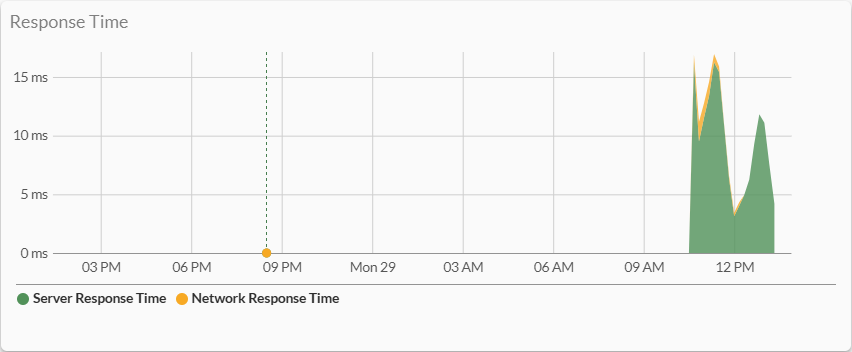
Application response time: Shows response time of a given application.
-
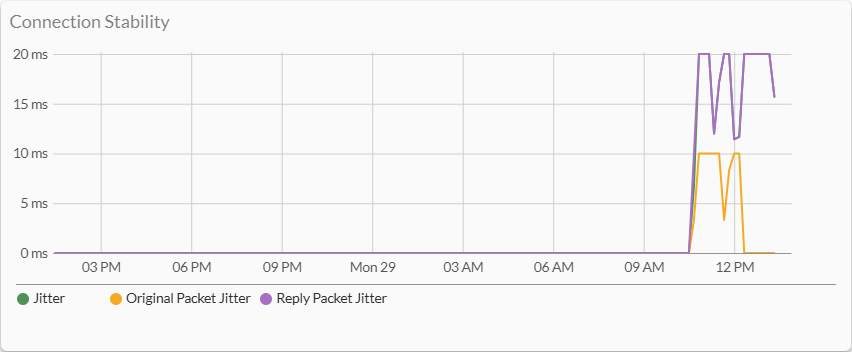
Application connection stability: Shows application connection stability in terms of jitter.
-
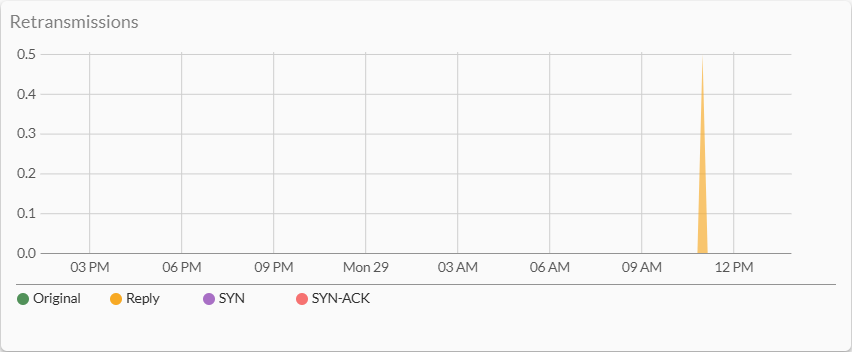
Application retransmission: Shows application traffic packet retransmission.
-
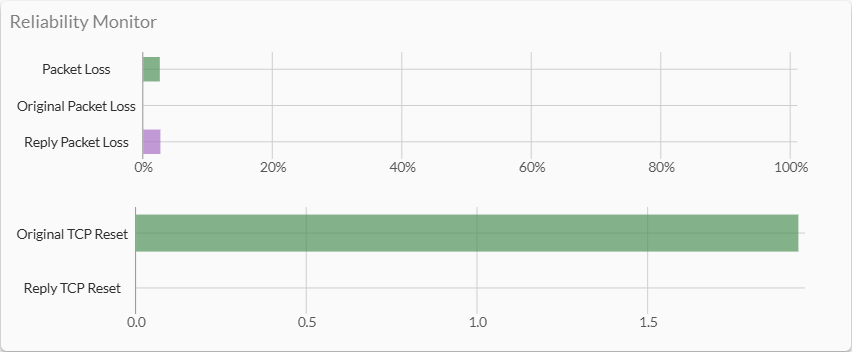
Application reliability monitor: Shows packet loss and abrupt connection termination by TCP reset.
A new GUI option, Log application health metrics, is added to the firewall policy logging options section to enable the required logging for this widget.
Example
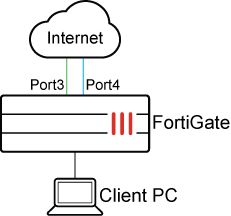
To test the application performance monitoring analytics in the GUI:
-
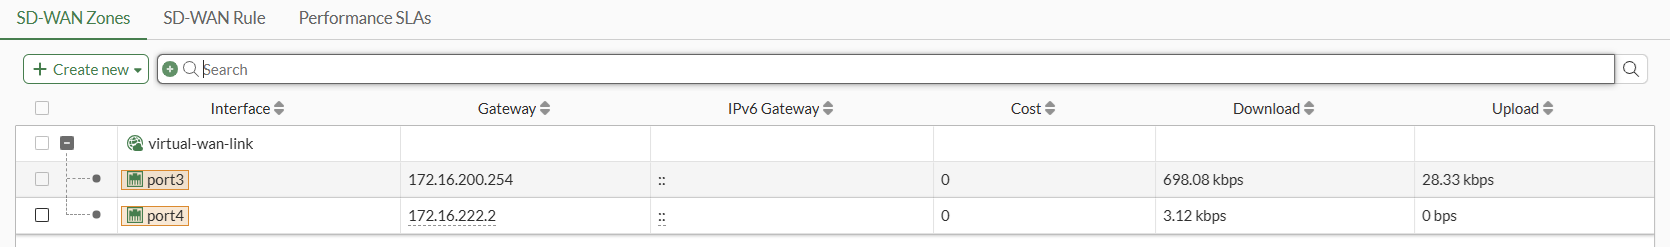
Create the SD-WAN zone and assign WAN ports.
-
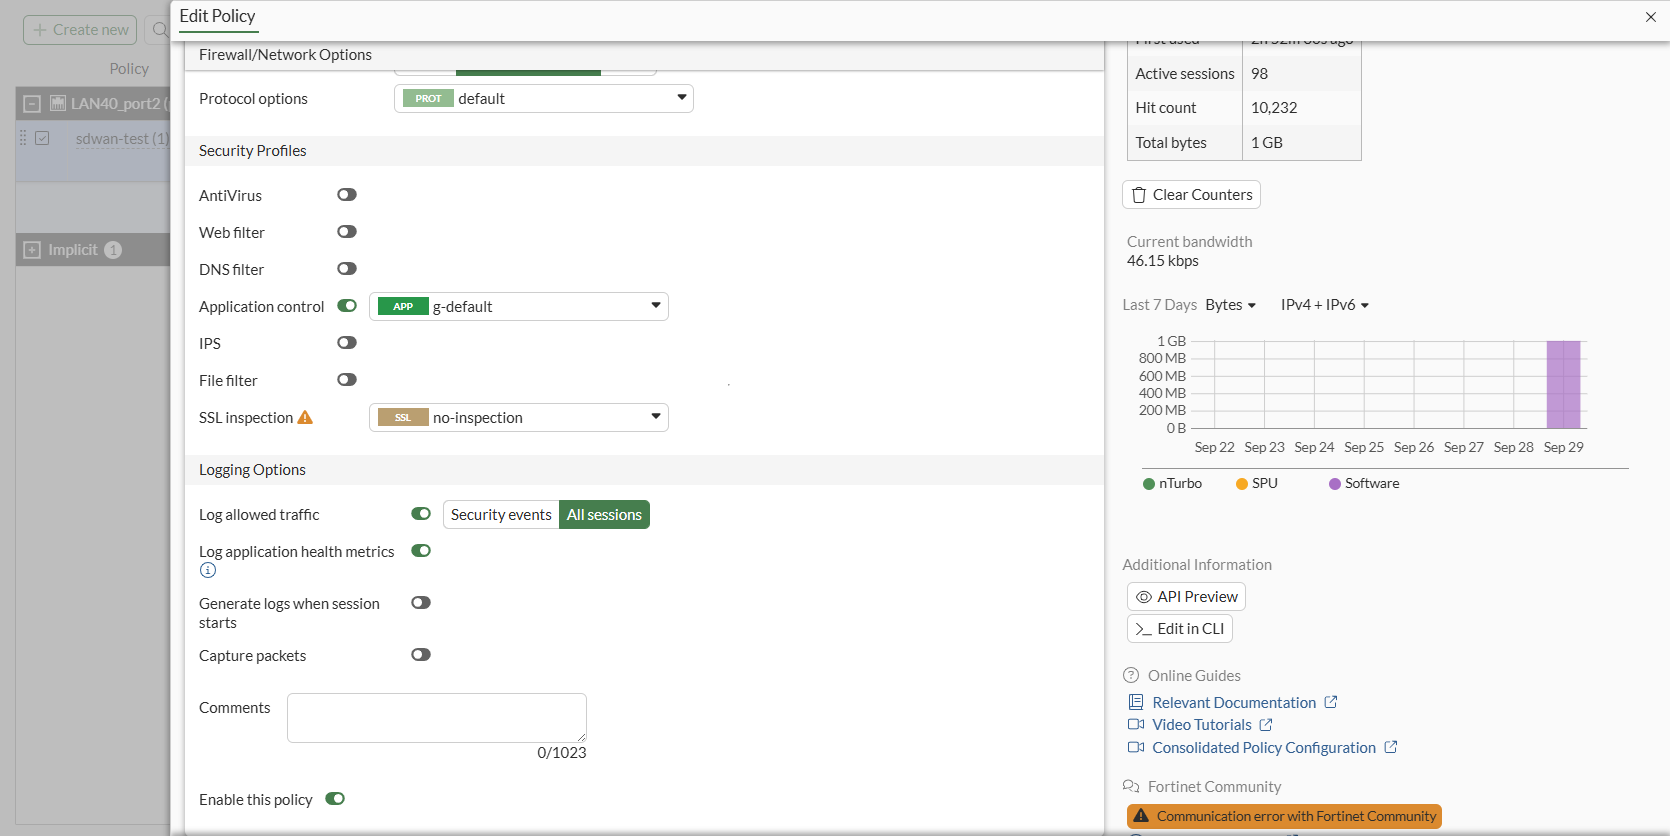
Create a policy with the following settings:
-
Set the SD-WAN zone as the destination interface.
-
Attach an Application Control profile to specify which applications are monitored.
-
Enable Log application health metrics under Logging Options.
This replaces the Passive health check option under Firewall > Network Options. Enabling this toggle enables both passive-wan-health-measurement and app-monitor values in the policy. When it is disabled, both are turned off.
-
-
From a client PC, generate traffic using various applications, such as YouTube or ChatGPT.
-
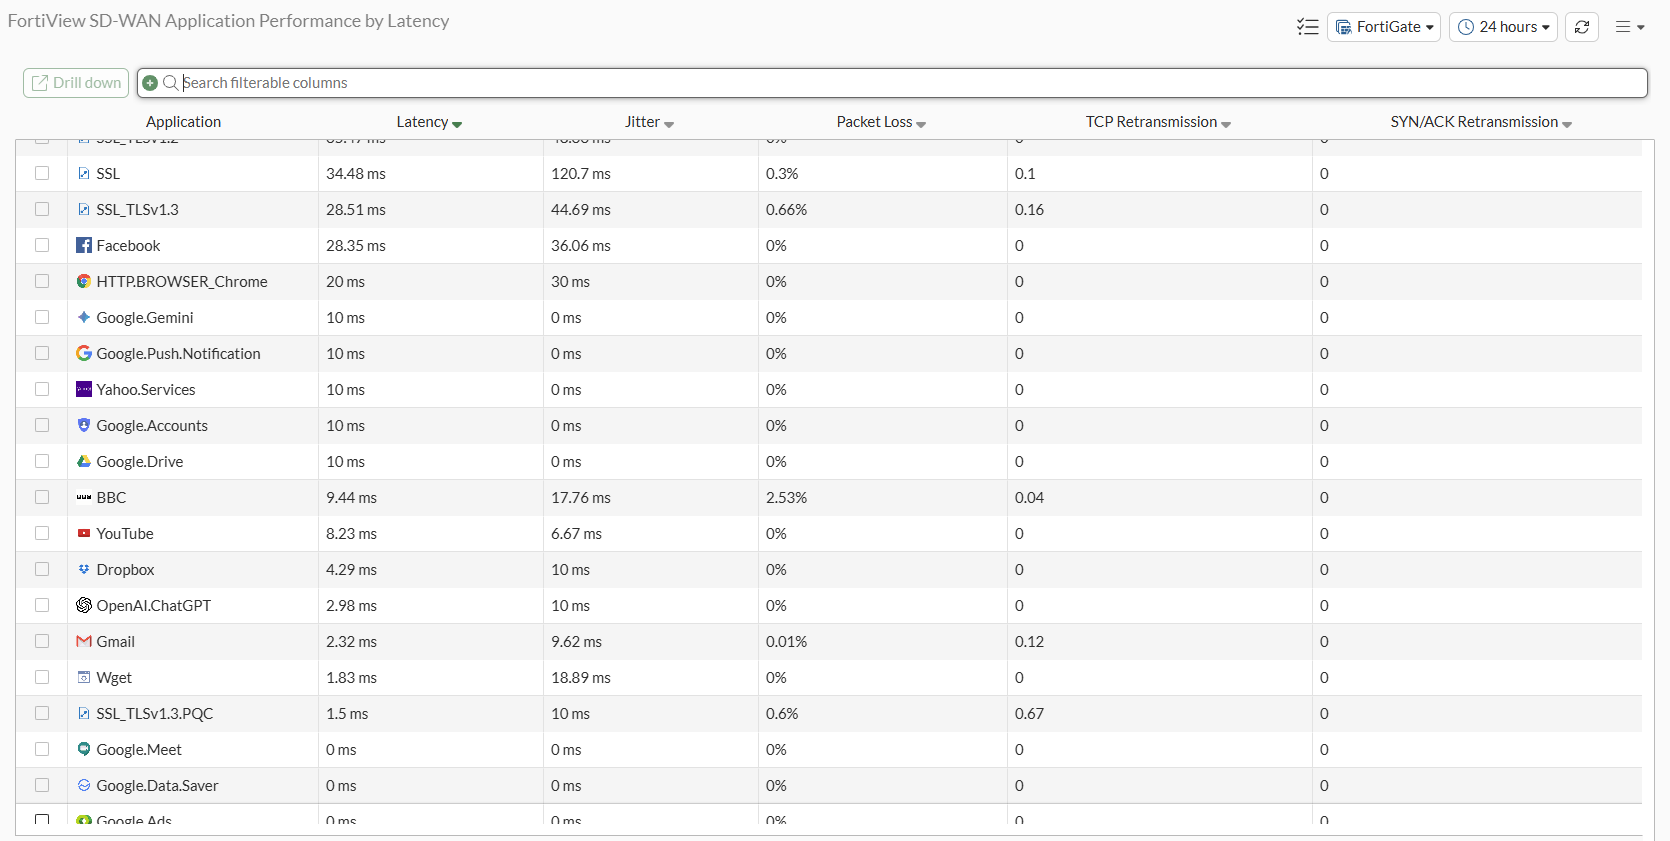
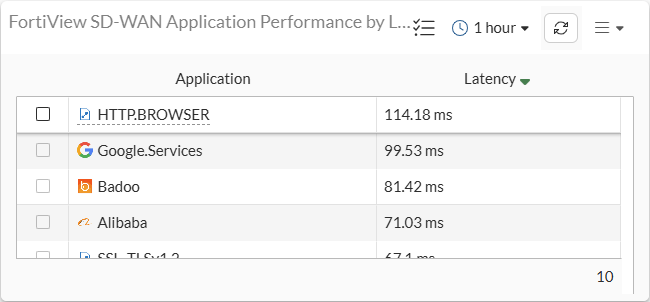
Go to Dashboard > FortiView and add the FortiView SD-WAN Application Performance Monitor. See Editing dashboards of widgets and monitors.
Verify that filtering by Applications works and check that sorting by Latency, Jitter, Packet Loss, TCP Retransmission, and SYN/ACK Retransmission is functional.
-
Drill down into an entry and verify that the following four charts are available:
-
Response Time
-
Connection Stability
-
Retransmissions
-
Reliability Monitor
-
-
Go to the Dashboard and confirm that the FortiView SD-WAN Application Performance widget can be added.
To test the application performance monitoring analytics in the CLI:
-
Create the SD-WAN zone and assign WAN ports:
config system sdwan set status enable config zone edit "virtual-wan-link" next end config members edit 1 set interface "port3" set gateway 172.16.200.254 next edit 2 set interface "port4" set gateway 172.16.222.2 next end end -
Create a policy:
config firewall policy edit 1 set name "sdwan-test" set srcintf "port2" set dstintf "virtual-wan-link" set action accept set srcaddr "all" set dstaddr "all" set schedule "always" set service "ALL" set passive-wan-health-measurement enable set app-monitor enable set utm-status enable set application-list "g-default" set logtraffic all set auto-asic-offload disable set nat enable next end -
Configure a health-check:
config system sdwan config health-check edit "test_h" set detect-mode passive set recoverytime 10 set embed-measured-health enable set members 1 2 config sla edit 1 set link-cost-factor latency set latency-threshold 50 next end next end end -
Configure an SD-WAN service and rule:
config system sdwan config service edit 1 set name "sdwan_test" set mode sla set internet-service enable set internet-service-name "8X8-8X8.Cloud" set internet-service-app-ctrl 31077 config sla edit "test_h" set id 1 next end set priority-zone "virtual-wan-link" set passive-measurement enable next end end -
From a client PC, generate traffic using YouTube.