
FortiView dashboard
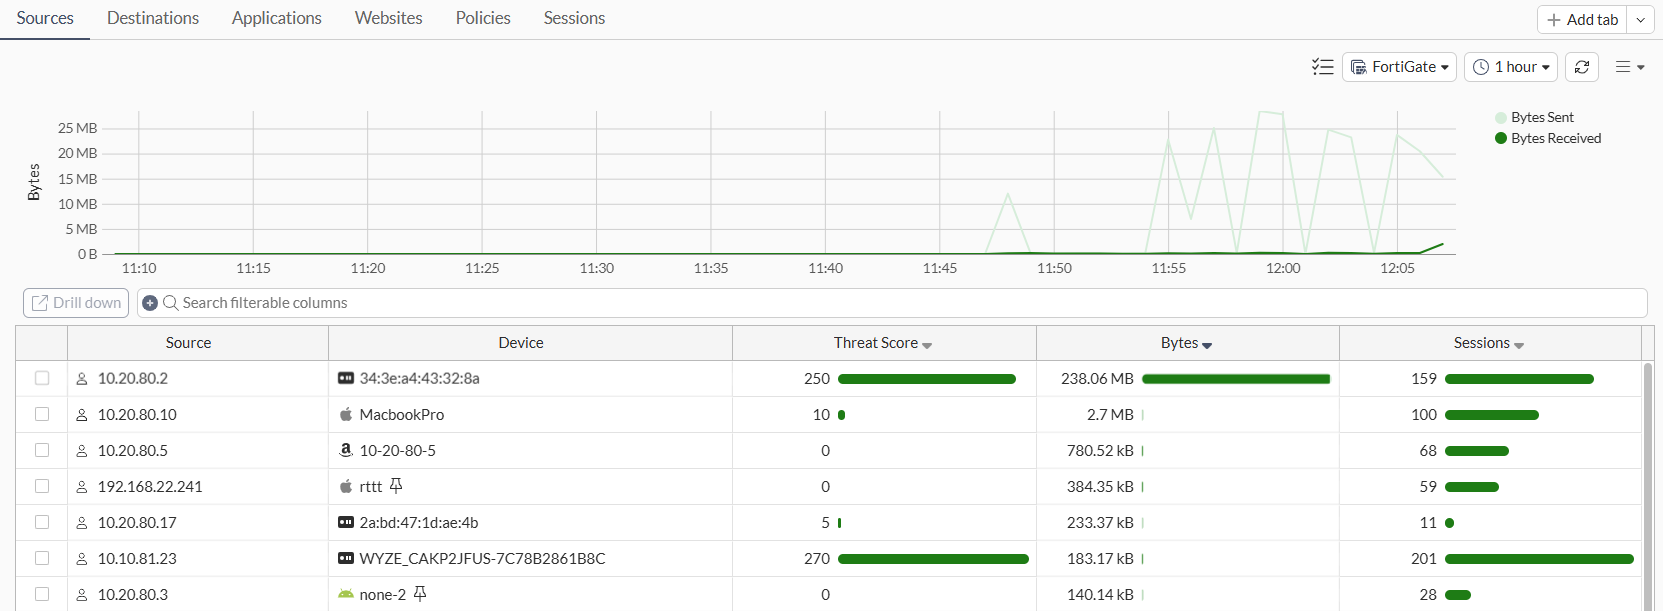
The Dashboard > FortiView dashboard includes several tabs of monitors that display information about top traffic volume by sources, destinations, applications, web sites, policies, and sessions.
Additional FortiView monitors and widgets can be added to the dashboard. You can also add FortiView monitors directly to the tree menu with the + Add dashboard/monitorbutton.
The following tabs of monitors are available by default:
|
Dashboard |
Usage |
|---|---|
|
Sources |
Displays Top Sources by traffic volume and drilldown by Source. |
|
Destinations |
Displays Top Destinations by traffic volume and drilldown by Destination. |
|
Applications |
Displays Top Applications by traffic volume and drilldown by Application. |
|
Websites |
Displays Top Websites by session count and drilldown by Domain. |
|
Policies |
Displays Top Policies by traffic volume and drilldown by Policy number |
|
Sessions |
Displays Top Sessions by traffic source and can be used to end sessions. |
Usage is based on default settings. The pages may be customized further and sorted by other fields.
You can quarantine a host and ban an IP from all of the core FortiView monitors.
See Editing dashboards of widgets and monitors for information about adding monitors and widgets.