


Network Insights
Network Insights contains displays information about NDR detections. Detections are organized by category Botnet, FortiGuard IOC, Network Attacks, Weak/Vulnerable Communication, Encrypted Attack and ML Discovery.
Device Inventory
The Device Inventory page displays the discovered devices. The Device and Role columns are dependent on IOT lookup service.
The device name in the Device column is determined by OS_hash of the mac address Status (online/offline). If FortiNDR does not see a session within 60 seconds, the status will be offline.

Botnet
Botnet displays the botnet traffic detections. If there is a known Botnet name, it will be displayed.

FortiGuard IOC
FortiGuard IOC detections are suspicious URLs and IPs that are flagged by FortiGuard. This anomaly discovery depends on FortiNDR look up to FortiGuard IOC service. Apart from URL category (e.g. malicious websites), you will also see in extra info column any campaign name involved (e.g. Solarwind, Locky Ransomware).

Network Attacks
Network Attacks are known attacks detected by Network Intrusion Protection Database.

Weak/Vulnerable Communication
The Weak/Vulnerable Communication page displays the list of weak or vulnerable communication detected on port2. For example, a weak cipher used by an older version of SSL.

Weak/Vulnerable Communication types
The following table provides a definition for each of the weak/vulnerable communication types:
|
Communication type |
Description |
|---|---|
| Weak record version | Weak TLS record layer version. |
| Weak version | Weak TLS handshake version. |
| Weak support version | Weak TLS handshake extension supported version. |
| Weak cipher | Weak TLS handshake cipher suite. |
|
Weak security mode |
SMB protocol uses level security mode. |
|
Weak extended security |
SMB protocol uses outdated extended security negotiation option. |
|
Weak dialect |
SMB uses outdated dialect version. |
|
Weak encryption |
SMB or SSH uses risky encryption algorithm. For example, SMB protocol with encryption disabled. |
|
Weak authentication |
Email protocols are using risky authentication methods. For example, POP3 uses authentication cram-md5, |
|
Weak server |
HTTP or RTSP server version is outdated. |
|
Weak method |
HTTP, SIP or RTSP protocol uses weak request method. For example, HTTP protocol uses DELETE as request method. |
|
Weak banner |
Weak or outdated email server version. For example, Outdated Cyrus IMAP server |
|
Weak encrypt algo server client |
Weak encryption option is used in SSH, such as rc4, rc3, rc2. |
|
Weak capability |
IMAP or POP3 capability command uses option AUTH=PLAIN. |
|
Weak security |
SMB protocol uses low level security mode. |
|
Weak encrypt method |
RDP protocol uses low level encryption methods such as ENCRYPTION_METHOD_40BIT. |
|
Weak encrypt level |
RDP protocol uses low encryption level such as ENCRYPTION_LEVEL_NONE |
|
Weak msg flags |
SNMP protocol uses risky flags such as 0x00-02, 0x04-06 and 0x08-ff. |
|
Weak server version |
MYSQL, TDS, Posgres or SIP server version is outdated. |
|
Weak auth algo |
POP3, SMTP or IMAP authentication method option is too risky. For example, POP3 uses PLAIN authentication option. |
|
Weak protocol version |
MYSQL protocol version outdated. |
|
Weak encrypt |
TDS encryption option is disabled. |
|
Weak fedauth |
TDS protocol disables |
Examples
Wireshark pcap

Weak security mode

Weak extended security

Weak dialect

Weak authentication

Encrypted Attack
This page displays a list of encrypted SSL attacks detected by using JA3 JA3s header hashes.

ML Discovery
The ML Discovery page displays a list of anomalies detected by Machine Learning configuration. Each row is based on a session. The configuration and baselining of ML Discovery is located under Virtual Security Analyst > ML configuration. ML discovery is switched ON by default.
- The Anomaly Features column displays the feature or feature combinations that caused the anomaly.
- The Additional Information column provides a glance of the abnormal feature value(s).
- The Use Feedback column is where you can enter positive or negative feedback to the detection.

Add feedback a session
The User Feedback column allows you to provide feedback for Machine Learning discoveries to correct false positives.
To add feedback to session anomaly:
- Go to Network Insights > ML Discovery and select a session in the table.
- Hover over the User Feedback column until the Edit icon appears and click it.
- From the Feedback dropdown, select one of the following options.
Option
Description
Mark as Not Anomaly Select this option to force the next baseline training with new traffic to EXCLUDE the same detection in future. This typically takes 5-10 minutes depending on the network traffic. Mark as Anomaly Select this option to add positive feedback to the detection.
This does not affect the baseline training other than acting a place for you to comment on the detection.

When multiple sessions share the same value in the Anomaly Feature(s) column, you will only need to add feedback once to apply the feedback to all of the sessions.

- Click Apply.
The following image is an example of multiple ML discoveries with the same value in the Anomaly Feature(s) column. In this scenario, you will only need to add feedback once to mark all the sessions as Anomaly.

View Session
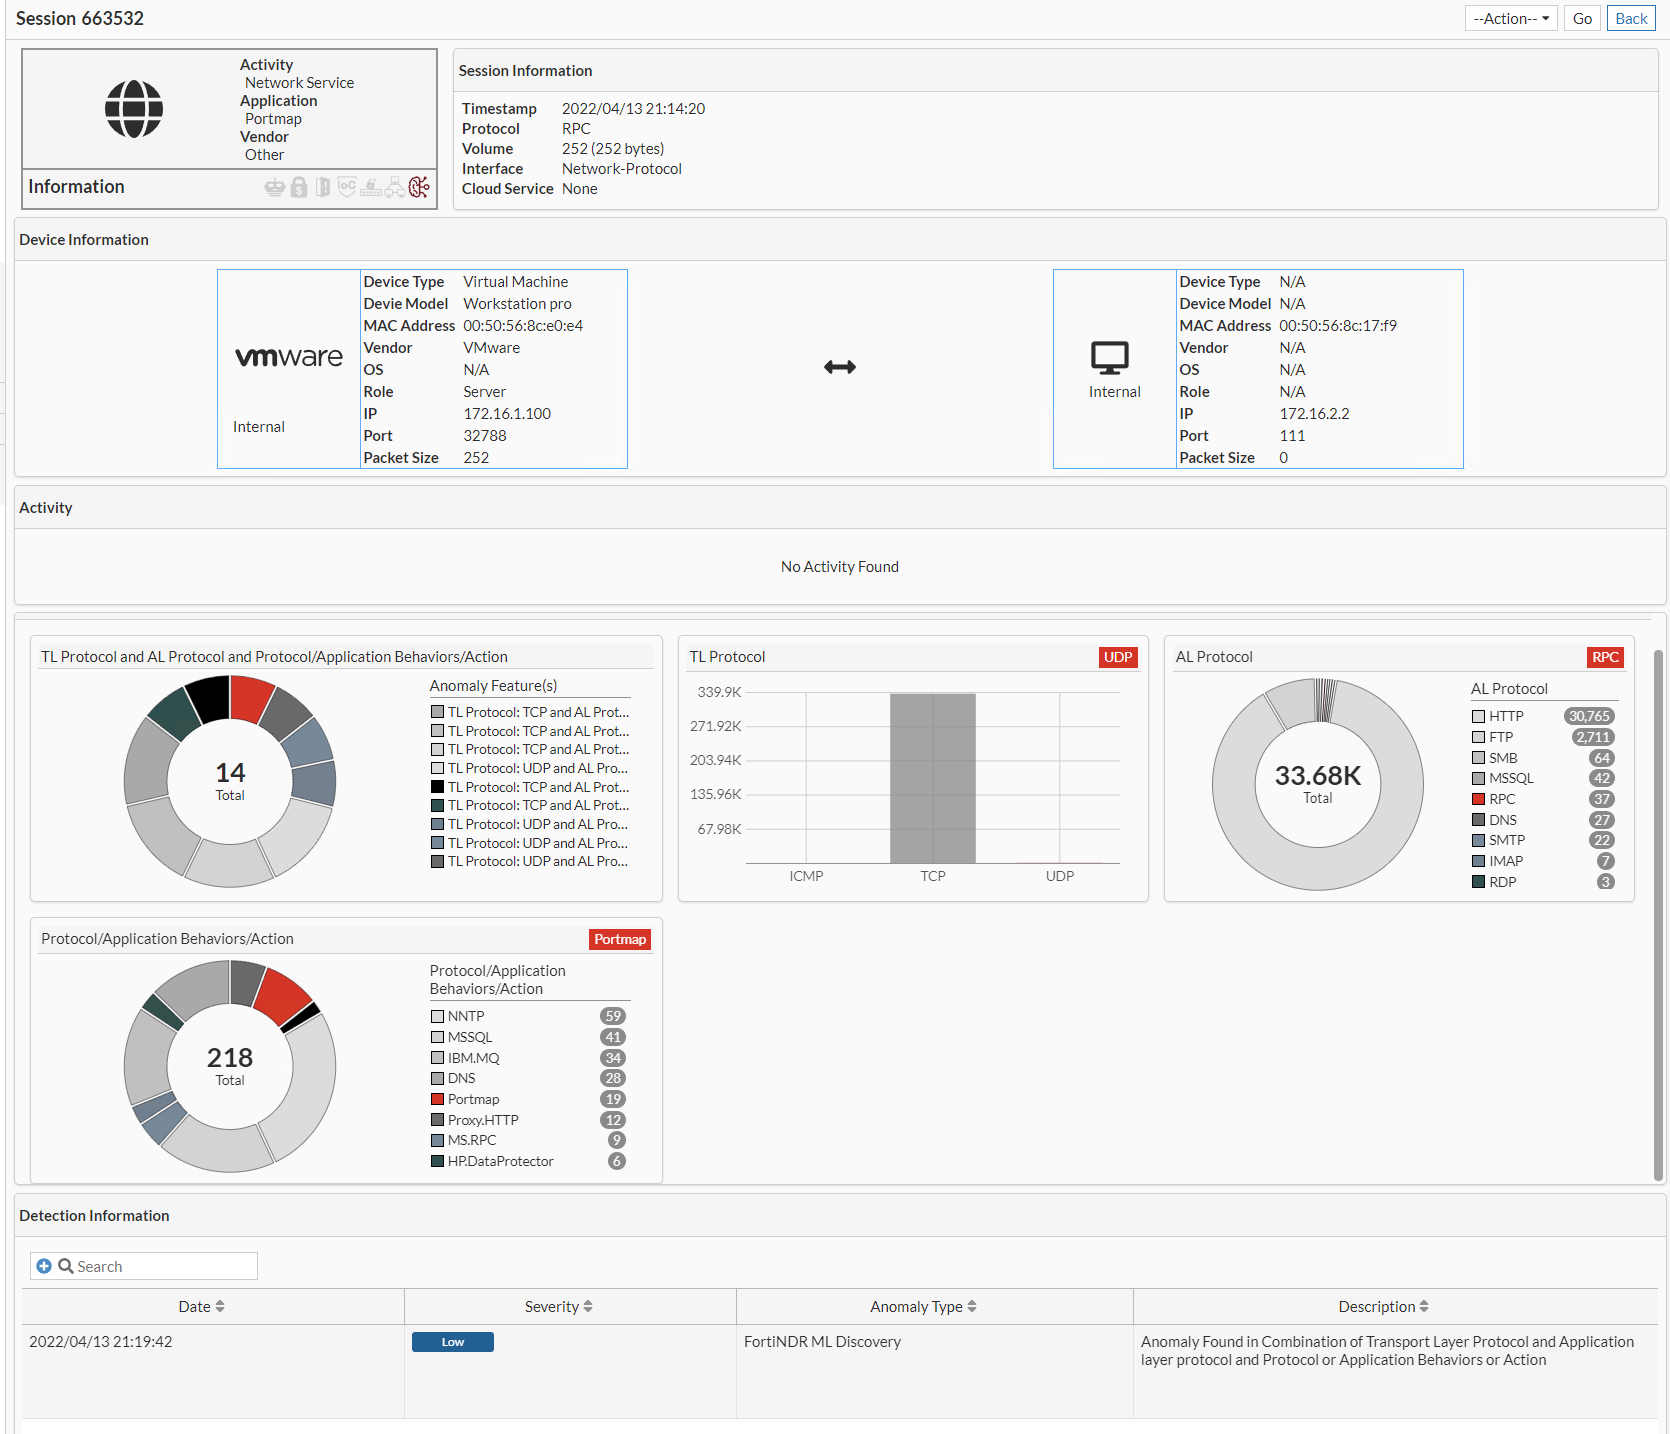
To drill-down to the session details, right-click an entry to open View Session.
In ML Discovery the session shows the distribution of the feature that caused the anomaly. In the image below, the session was flagged because it was trying to use port 22, which is the SSH connection.

If the anomaly is caused by:
- A new IP joining the network, the distribution graph is not displayed. The new IP address is displayed instead.
- A combination of features the session displays the distribution of the combination as well as the individual distributions. For example, the following anomaly is caused by the combination of Transport Layer Protocol, Application Protocol and Protocol/Application Behaviors/Action.
View Source Device and View Destination Device
You can view Source and Destination Device by right-clicking an entry and clicking in View Device > View Source Device or View Destination Device.

To view this device’s ML anomalies, click the ML Discovery tab. The following image shows a series of ML anomalies found on the same device.
