


Logs
Go to Workspace > Logs to view the four types of logs:
Jobs log

The Jobs log provides real-time insight into deployment and insertion processes and progress. The Jobs facility executes operational system and security tasks in a certain order, either sequential or in parallel, and these executions are displayed on the FortiPolicy Jobs log so users can track whether a job passed or failed.
While the Jobs tracking tool assists an administrator with confirmation that a job passed, there is no need for an administrator to be concerned about the job content unless there is a job event that requires investigation.
To investigate Job details, click the “i” icon at the beginning of each Job row. Use the Tasks page to identify where an issue might have occurred and the possible cause.
To stop a running job, click the pause icon above the Jobs table.
|
|
FortiPolicy does not interpret errors produced by third parties such as VMware. Whenever those vendors produce an error, that error is displayed in the Jobs table exactly as relayed. Corrective action by the user requires the user first interpret the failure in the context of the infrastructure named and the task attempted, which is typically suggested in the task name itself. |
Audit log
The Audit log records all configuration changes generated by a user, including configuration events that take place with the FortiPolicy API and CLI.
The FortiPolicy administrator determines which users can view audit records based on role assignment. By default, access to the Audit log is denied to everyone except those with the GlobalAdministrator role. No user can purge or modify an Audit log in any way. See Users to specify which users can access the audit log.
The following table lists the information in each record in the Audit log.
|
Audit Log Data |
Example |
|---|---|
|
Time |
Date and time for the action |
|
User ID |
User name |
|
Action |
Update, Login, Add, Logout, Edit |
|
Outcome |
Success or Failure |
|
Component type |
The part of the system acted on by the user, for example, Policy Generation. |
|
Component name |
Name of the component |
|
Description |
More information about the action |
To filter and search the audit log:
-
Go to Workspace > Logs > Audit.

-
Filter by a time interval by selecting the From date and To date and then clicking APPLY.
-
You can click on the column headings to change the sort order.
|
|
Audit log records are archived automatically. A FortiPolicy administrator can configure how long to save Audit log records. By default, Audit log records are saved for 7 years. |
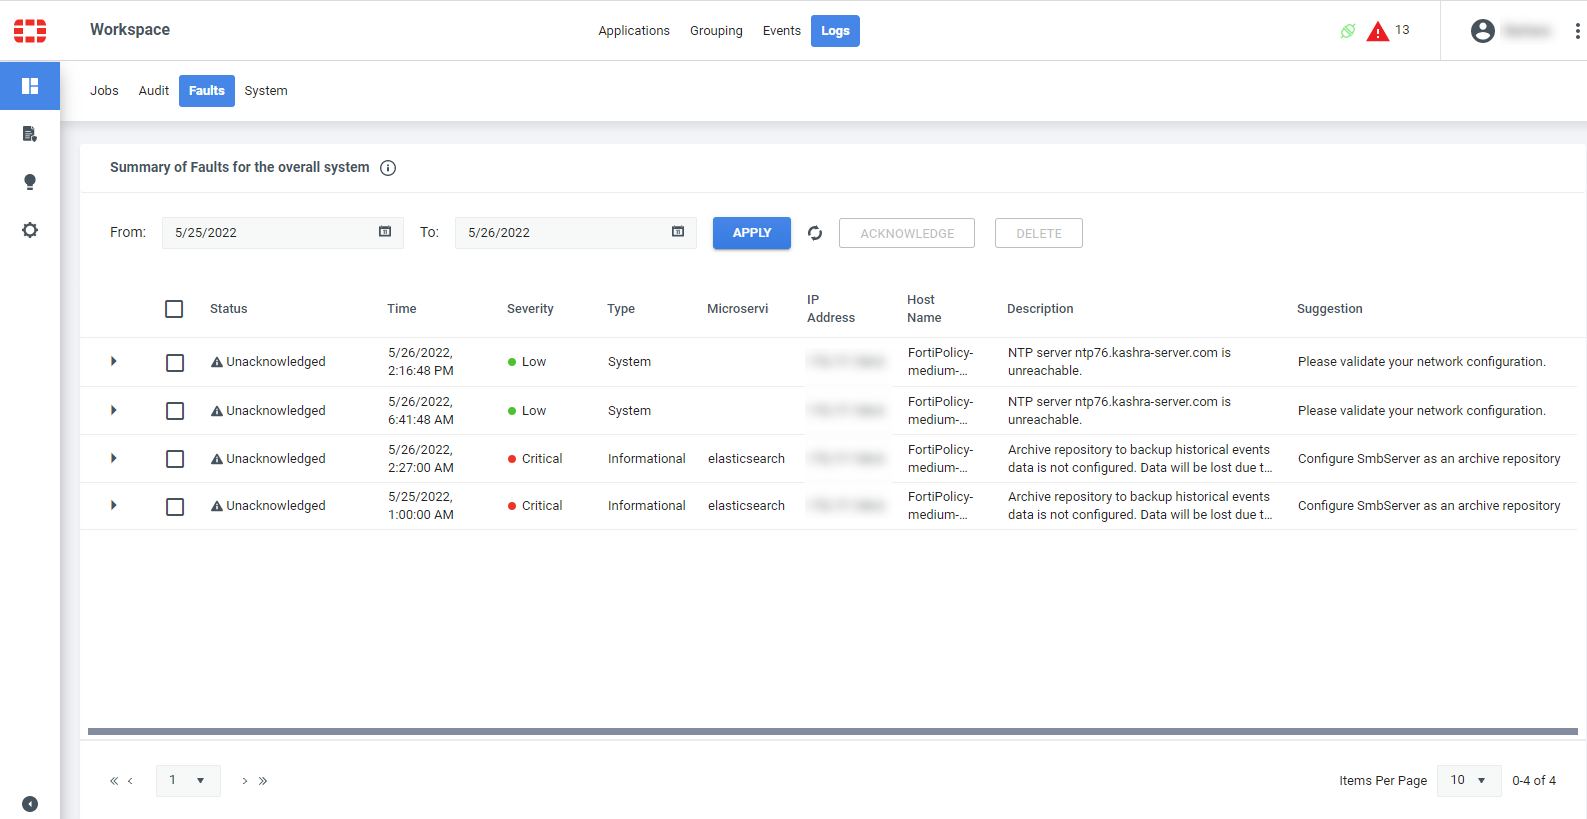
Faults log
The FortiPolicy Faults log records exceptions, system errors, faults, and related issues that arise during FortiPolicy operations. A fault will stay in the Faults log until an administrator acknowledges it or deletes it.
Use the Faults log page to view and search for specific faults, based on date, time, or search string, such as microservice or description.
All fault entries are initially displayed as Unacknowledged (that is, not yet examined or investigated). After you mark a fault as Acknowledged, the fault appears as acknowledged to all users.
|
|
The number of unacknowledged faults is displayed in the header bar at the top of every FortiPolicy page so that an administrator is alerted to new faults. |
To filter and search the Faults log:
-
Go to Workspace > Logs > Faults.
-
Filter by a time interval by selecting the From date and To date and then clicking APPLY.
-
You can click on the column headings to change the sort order.
-
To expand a fault row to display more information, click the arrow at the beginning of the row.
-
To acknowledge an Unacknowledged fault, expand the row, select the fault, and click ACKNOWLEDGE above the table.
Acknowledging a fault updates the Unacknowledged Faults icon at the top of all FortiPolicy pages.
-
To delete a fault, select the fault and click DELETE above the table.
|
|
The Audit log creates a record of the User ID of each individual that marks a fault as acknowledged. Email notification of faults is available. |
System logs
View and filter the following information in the FortiPolicy System log.
|
System Log Data |
Example |
|---|---|
|
Time |
Date and time of the user-initiated configuration change |
|
Type |
Type of microservice, for example, DPI, SI, or TLS |
|
Name |
Name of the microservice |
|
Log Message |
Message logged for a user-initiated configuration change |
To filter and search a system log:
-
Go to Workspace > Logs > System.

-
Filter by a time interval by selecting the From date and To date and then clicking APPLY.
-
You can click on the column headings to change the sort order.