


Diagnostics
Administrators can use the Diagnostics page to create a filter on an interface to capture a specified number of packet streams to examine in real-time with header and payload information. Once completed, packets can be filtered by various fields or through the search bar. The capture can be saved as a PCAP file that you can use with a third-party application, such as Wireshark, for further analysis. Recent capture criteria is saved after the packet capture, and you can select and use the same criteria again.
To capture packets in the GUI:
-
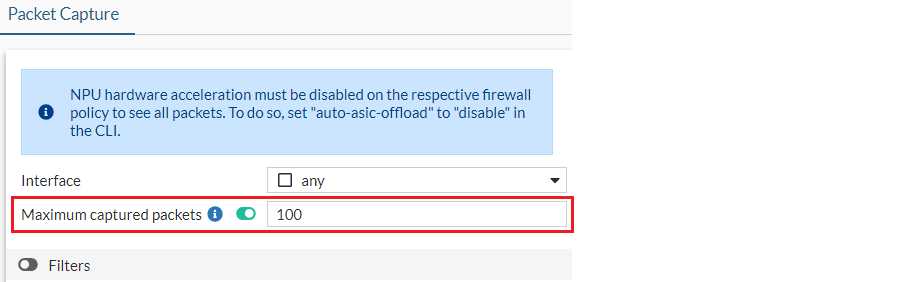
Go to Network > Diagnostics and select an Interface (default is any).

-
Optionally, enable Maximum captured packets and enter a number which is the maximum number of packets that the FortiProxy will capture. The default is 100. When disabled, the FortiProxy automatically stops after capturing 50,000 packets to preserve memory.
-
Optionally, enable Filters and select a Filtering syntax:
-
Basic: enter criteria for the Host, Port, and Protocol number.

-
Advanced: enter a string, such as src host 172.16.200.254 and dst host 172.16.200.1 and dst port 443.

-
-
Click Start capture. The capture is visible in real-time.

-
While the capture is running, select a packet, then click the Headers or Packet Data tabs to view more information.


-
When the capture is finished, click Save as pcap. The PCAP file is automatically downloaded.
-
Optionally, use the Search bar or the column headers to filter the results further.
The packet capture history is listed under Recent Capture Criteria in the right-side of the screen. Clicking the hyperlink will take you back to the main page with the interface and filter settings already populated.

|
|
For more granular sniffer output with various verbose settings, use |