
Diagnostics
Administrators can use the Diagnostics page to create a filter on an interface to capture a specified number of packet streams to examine in real-time with header and payload information. Once completed, packets can be filtered by various fields or through the search bar. The capture can be saved as a PCAP file that you can use with a third-party application, such as Wireshark, for further analysis. Recent capture criteria is saved after the packet capture, and you can select and use the same criteria again. You can also save the capture criteria without starting the capture by clicking Save settings for later after configuring the packet capture criteria.
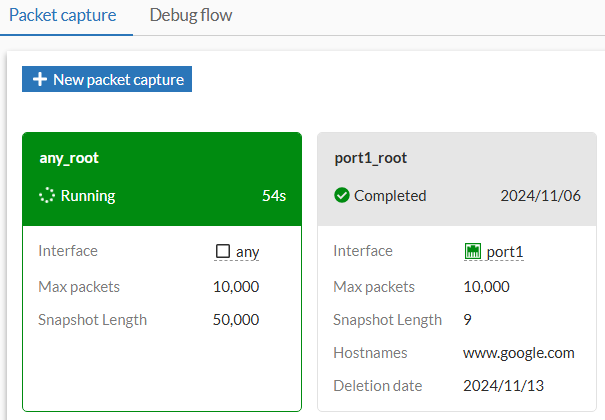
Capture cards in the Network > Diagnostics page are sorted in alphabetical order of the configured name and colored depending on state:
-
Green: The packet capture is running.
-
Gray: The packet capture has not started yet, has completed, or the capture files have been deleted.
To capture packets in the GUI:
-
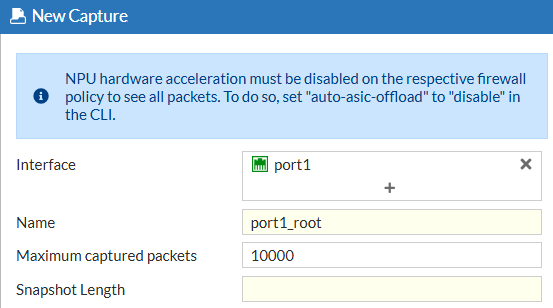
Go to Network > Diagnostics and select the Packet Capture tab.
-
Select one or multiple interfaces (default is any).
-
Specify the name in the Name field. The name must be unique for the packet capture criteria being configured.
-
Optionally, enable Maximum captured packets and enter a number which is the maximum number of packets that the FortiProxy will capture. The default is 10000. When disabled, the FortiProxy automatically stops after capturing 50,000 packets to preserve memory.
-
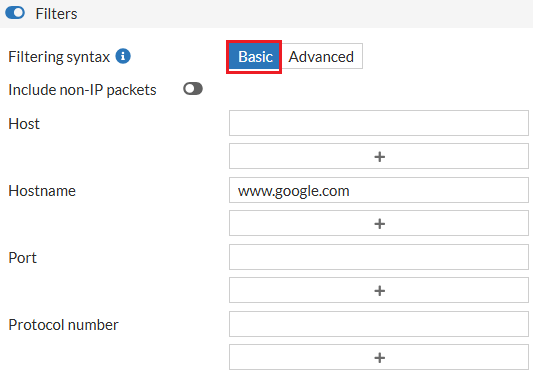
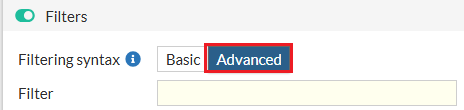
Optionally, enable Filters and select a Filtering syntax:
-
Basic: enter criteria for the Host, Hostname, Port, and Protocol number.
-
Advanced: enter a string, such as src host 172.16.200.254 and dst host 172.16.200.1 and dst port 443.
-
-
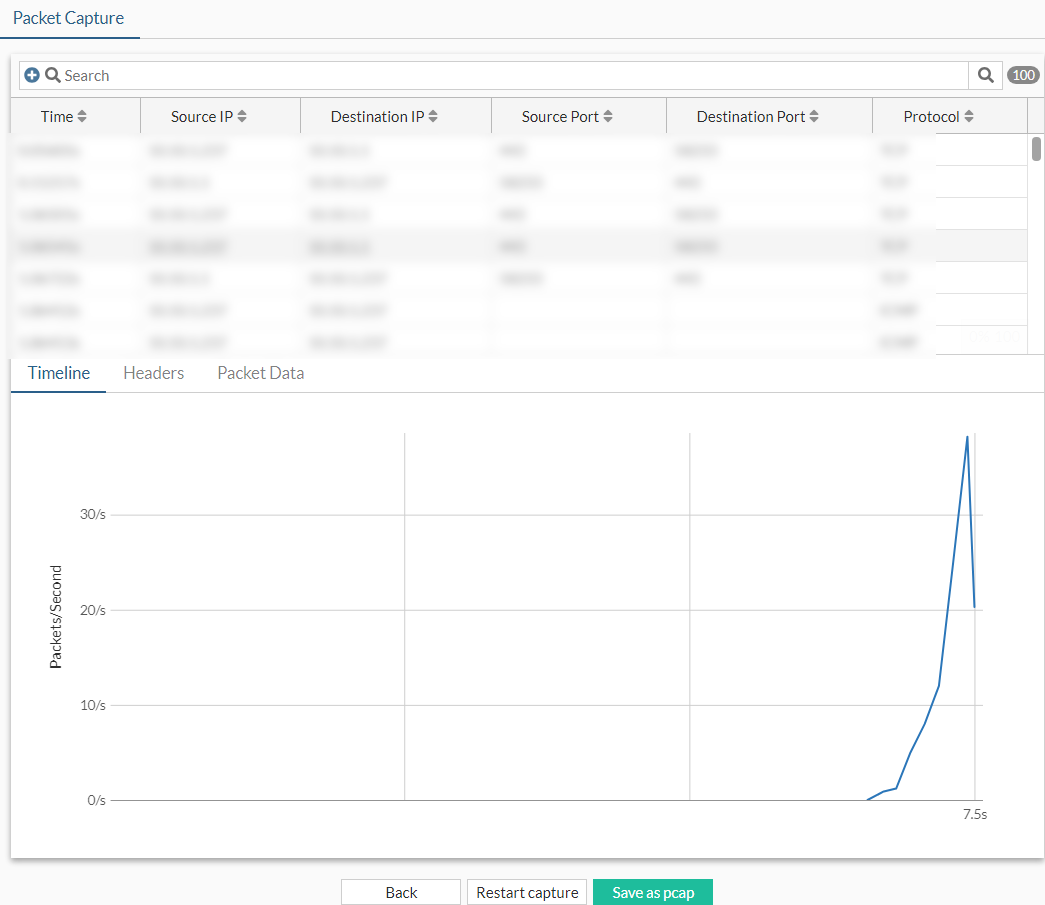
Click Start capture. The capture is visible in real-time.
-
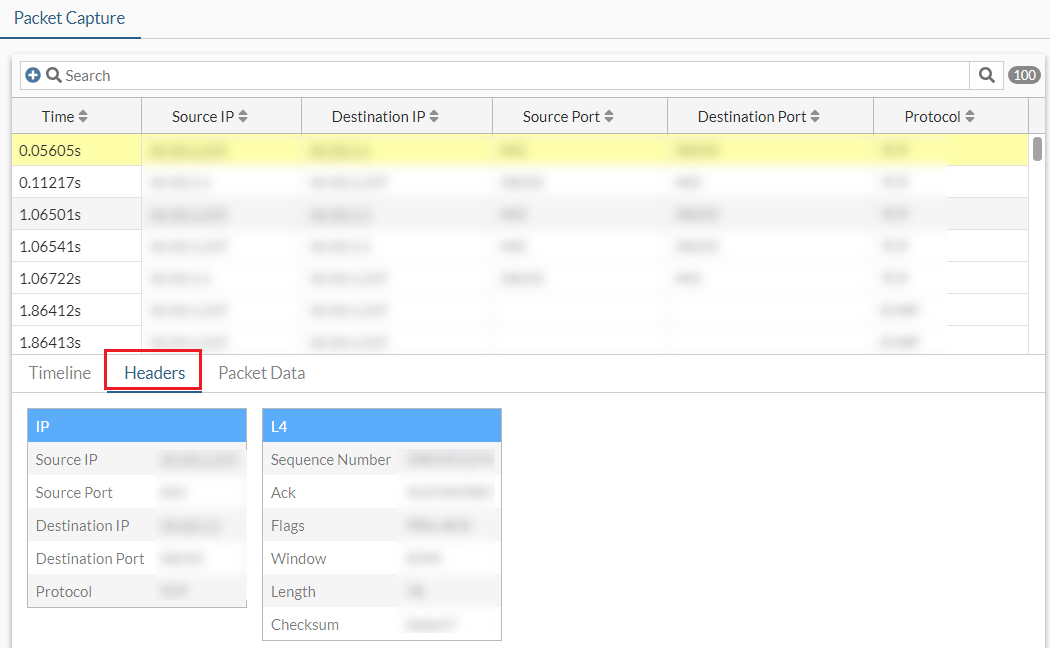
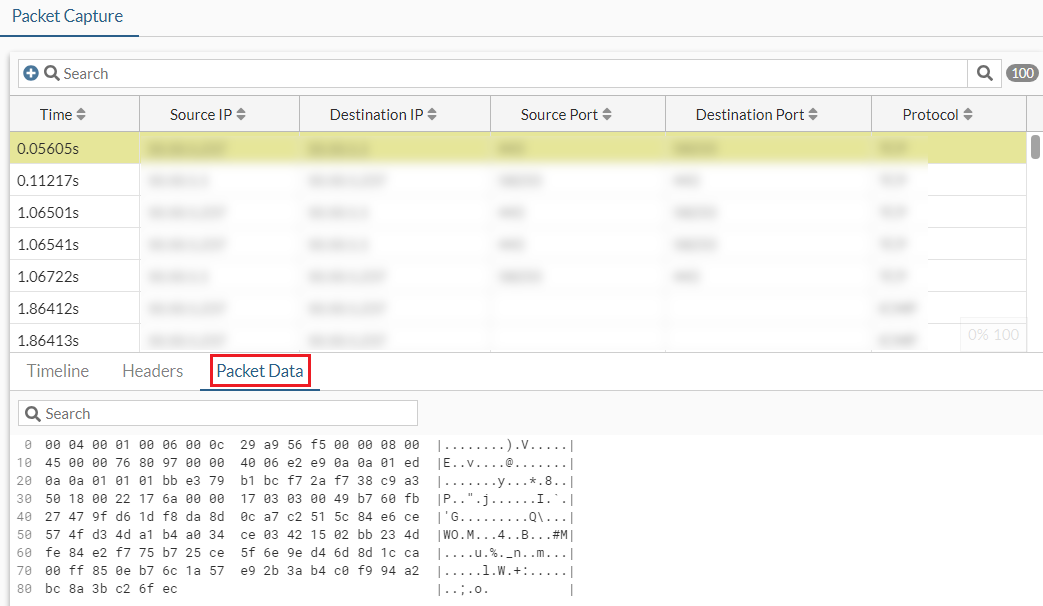
While the capture is running, select a packet, then click View to see more information in the Headers or Packet Data tabs.
-
When the capture is finished, click Save as pcap. The PCAP file is automatically downloaded.
-
Optionally, use the Search bar or the column headers to filter the results further.
|
|
For more granular sniffer output with various verbose settings, use |
Multiple packet captures
Multiple packet captures can be run simultaneously for when many packet captures are needed for one situation. For example, ingress and egress interfaces can be captured at the same time to compare traffic or the physical interface and VPN interface can be captured using different filters to see if packets are leaving the VPN.
The packet capture dialog can be docked and minimized to run in the background. The minimized dialog aligns with other CLI terminals that are minimized.
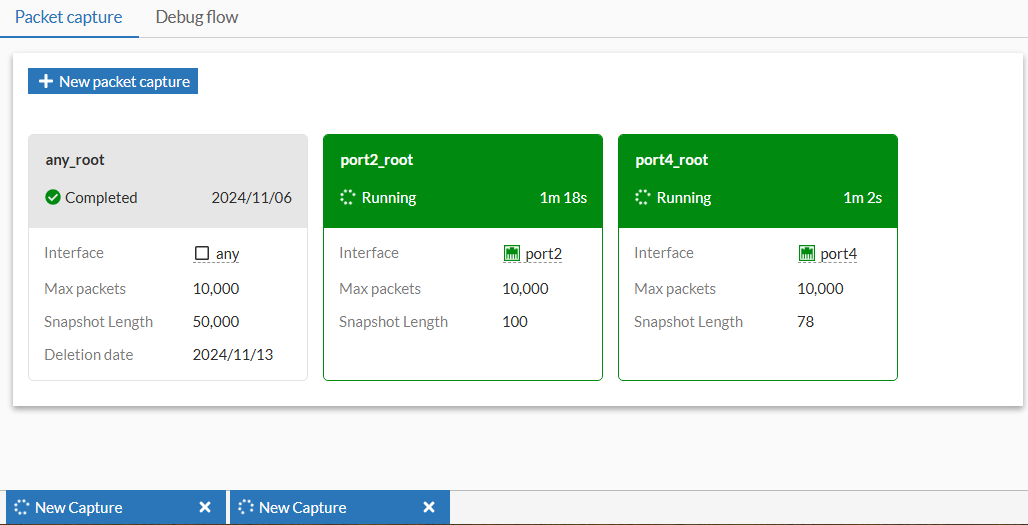
To run multiple packet captures at the same time:
-
Go to Network > Diagnostics.
-
Configure the first packet capture:
-
Click New packet capture. The Packet Capture (1) dialog is displayed.
-
Select the Interface and configure other settings as needed.
-
Click Start capture. The first packet capture begins.
-
-
Minimize the packet capture. The packet capture continues to run.
-
Configure the second packet capture:
-
Click New packet capture. The Packet Capture (2) dialog is displayed.
-
Select the Interface and configure other settings as needed.
-
Click Start capture. The second packet capture begins.
-
-
When the captures are complete, expand the dialog and select Save as pcap for each packet capture.