Clients Diagnostics and Tools
The Diagnostics and Tools pane displays the details about the selected Client and allows you to run diagnostic tests.
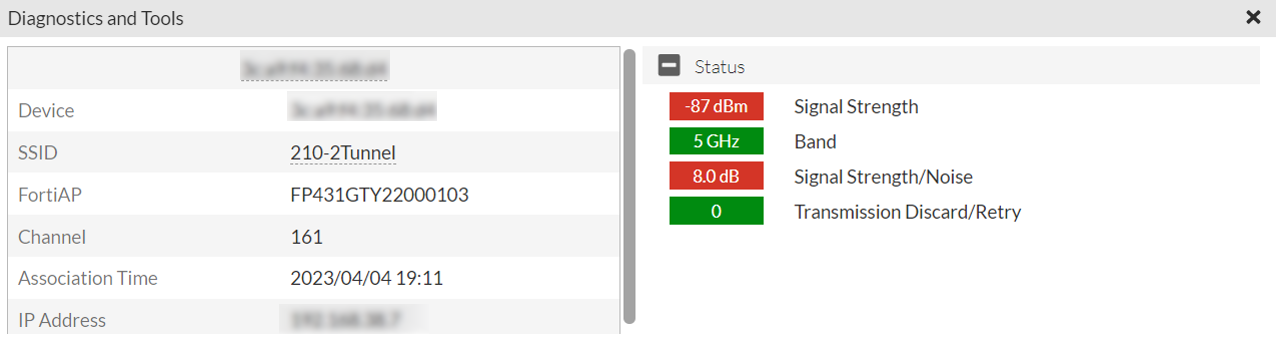
Performance
The Performance tab displays information about the client's performance, including data charts for bandwidth, signal strength, and transmission discards and retries.

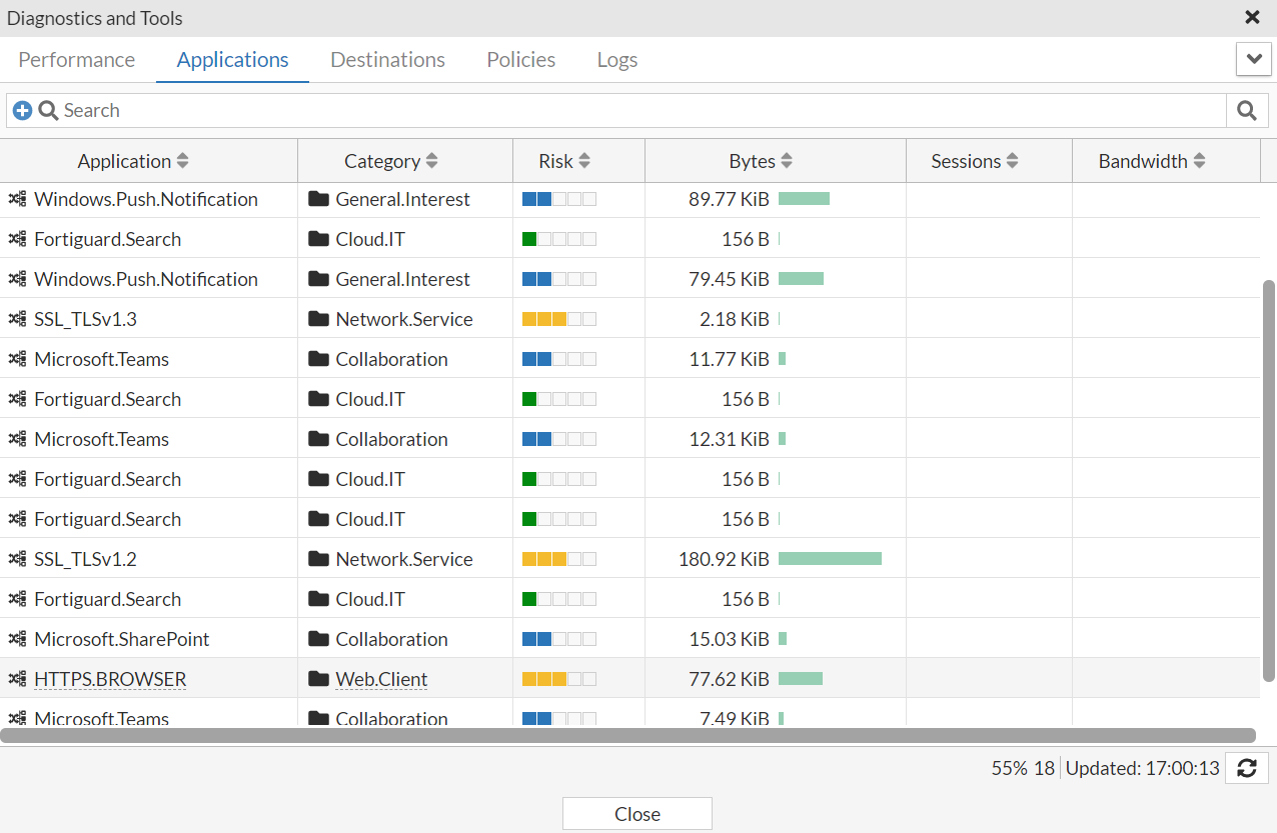
Applications
The Applications tab displays a list of applications in use by the selected client, along with details such as the application name, category, risk, data usage, session and bandwidth details.
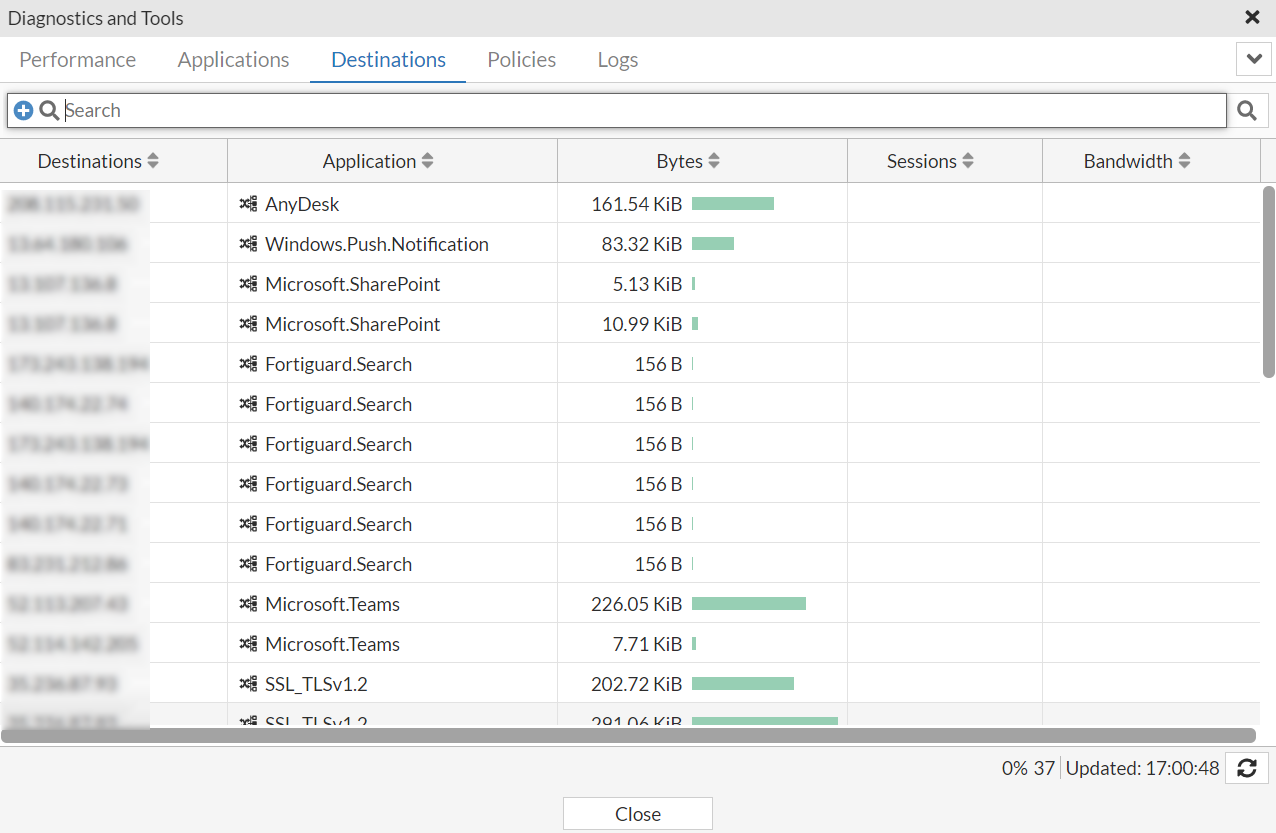
Destinations
The Destinations tab displays a list of network destinations accessed by the selected client, along with details such as the destination IP address, application name, data usage, session and bandwidth details.
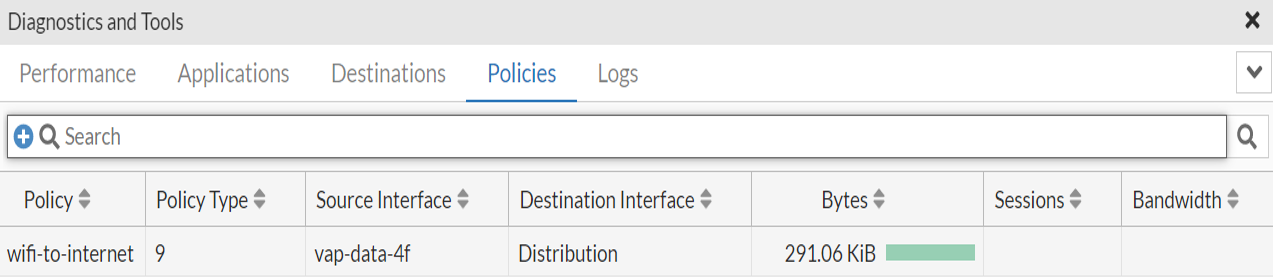
Policies
The Policies tab displays information about any policies applied to the selected client, such as policy name, policy type, source interface, destination interface, data usage, session and bandwidth details.
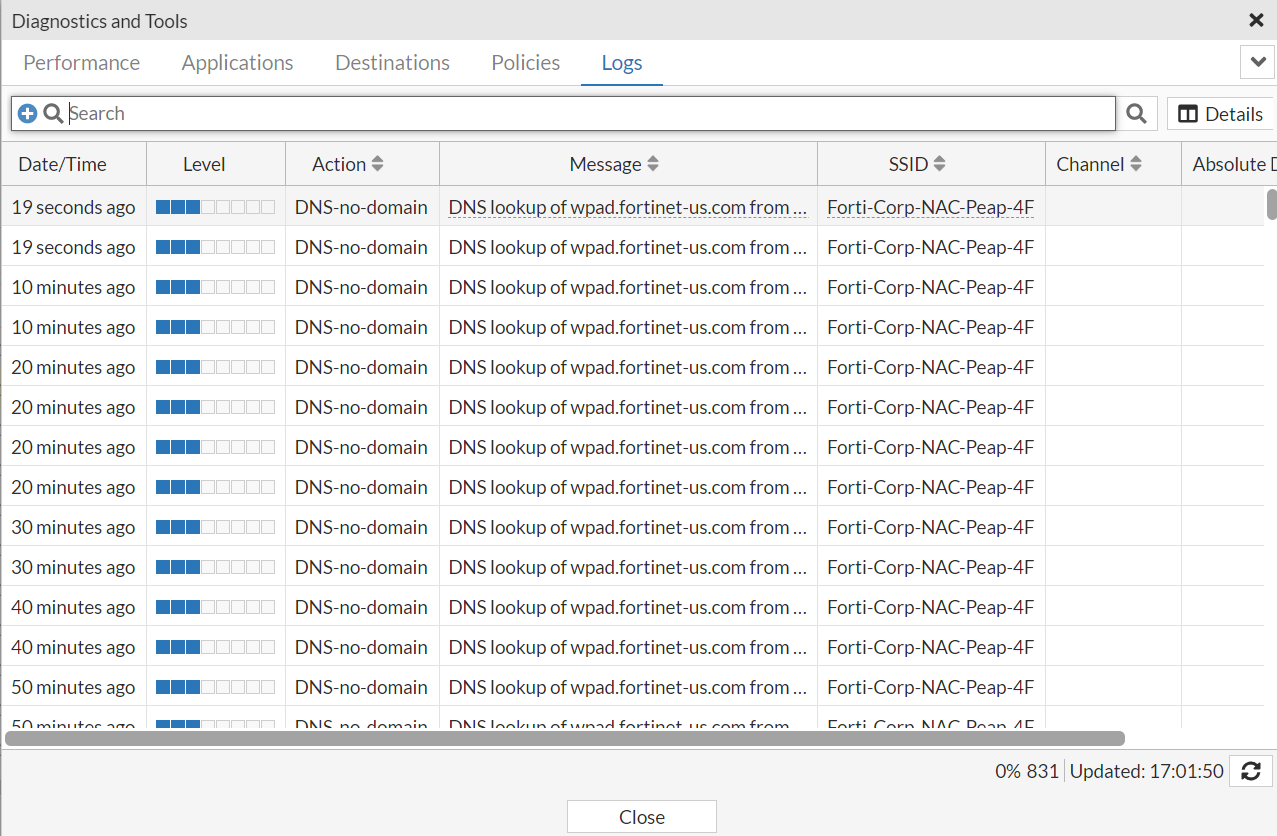
Logs
The Logs tab displays detailed logs of events related to the selected client, allowing you to troubleshoot any issues. To view detailed information, select log and click Details.