


System Events
The Log & Report > System Events page includes:
-
A Summary tab that displays the top five most frequent events in each type of event log and a line chart to show aggregated events by each severity level. Clicking on a peak in the line chart will display the specific event count for the selected severity level. You can also filter the log viewer with specific time frames.
-
A Logs tab that displays individual, detailed log views for event type. You can change the type of event log in the top-right, dropdown list. You can apply a custom time frame using the Date/Time filter. When the Date/Time filter is applied, the time frame will be disabled and set to custom. To select a new time frame, you must first remove the existing filter by clicking the X in the search bar or selecting Remove in the Filter dialog.
Clicking on an event in the Summary tab will automatically bring users to the Logs tab with the appropriate filters applied.
|
|
Disk logging and historical FortiView must be enabled for the Summary tab to display valid data. |
To review system events in the GUI:
-
Go to Log & Report > System Events. The Summary tab opens.
-
On the right-side of the screen, select the time range from the dropdown list.
The line chart will display all of the system events, and the non-empty event cards will list up to five Top Event entries within the time range set.

Data is retrieved from FortiView with the 5 minutes range updated first. When selecting either the 1 hour or 24 hours time range, there may be a delay to update Top Event entries.

-
Review the details of system events:
-
Clicking on any event type title opens the Logs page for that event type filtered by the selected time span.
For example, on the System Events > Summary page, clicking General System Events opens the following page. The type of event log can be changed in the top-right, dropdown list.
-
Clicking on any event entry opens the Logs page for that event type filtered by the selected time span and log description.
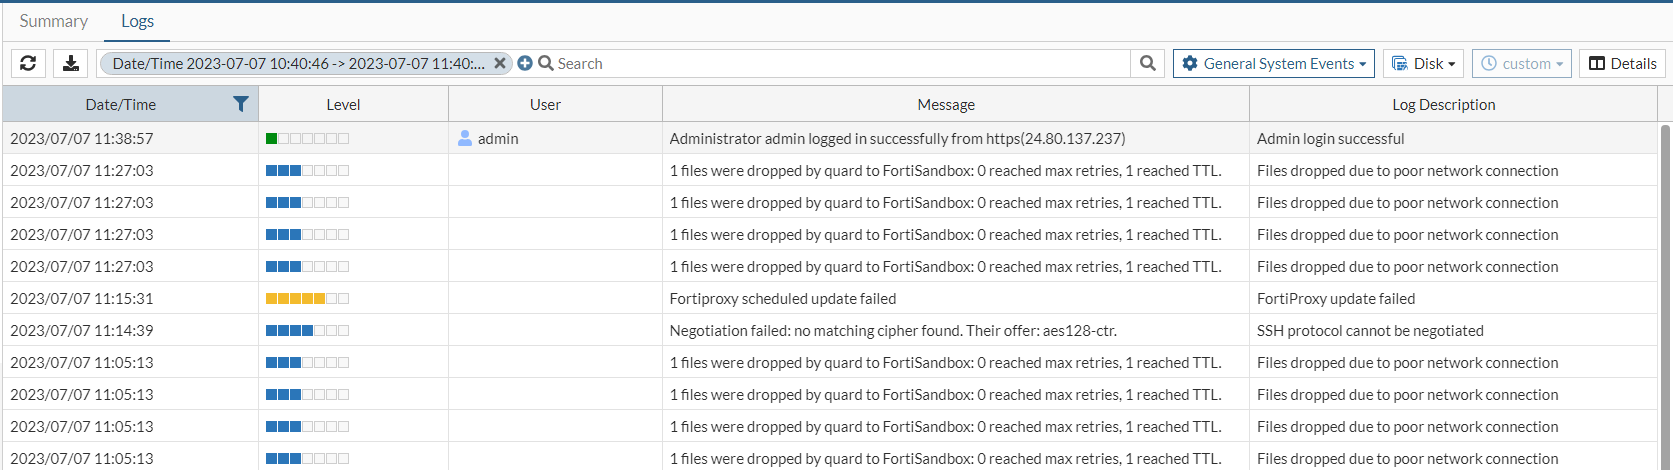
For example, on the System Events > Summary page in the General System Events box, clicking Files dropped due to poor network connection opens the following page. The type of event log can be changed in the top-right, dropdown list.

A custom time frame can be applied using the Date/Time filter. If the Date/Time filter is applied, the time frame will be disabled and set to custom. To select a new time frame, you must first remove the existing filter by clicking the X in the search bar or selecting Remove in the Filter dialog.
-
Up to 100 Top Event entries can be listed in the CLI using the diagnose fortiview result event-log command.
To list system events in the CLI:
# diagnose fortiview result event-log

    data(1646760000-1646846401):
    0). subtype-ha | eventname-HA device interface failed | level-warning | count-1 |
    1). subtype-system | eventname-DHCP statistics | level-information | count-40 |
    2). subtype-system | eventname-Super admin left VDOM | level-information | count-13 |
    3). subtype-system | eventname-Admin performed an action from GUI | level-warning | count-5 |
    4). subtype-system | eventname-Super admin entered VDOM | level-information | count-4 |
    5). subtype-system | eventname-Global setting changed | level-notice | count-3 |
    6). subtype-system | eventname-Attribute configured | level-information | count-2 |
    7). subtype-system | eventname-Clear active sessions | level-warning | count-2 |
    8). subtype-system | eventname-Disk log rolled | level-notice | count-2 |
    9). subtype-system | eventname-Log rotation requested by FortiCron | level-notice | count-1 |
    10). subtype-system | eventname-Report generated successfully | level-notice | count-1 |
    11). subtype-system | eventname-Test | level-warning | count-1 |
    12). subtype-system | eventname-VDOM added | level-notice | count-1 |
    13). subtype-user | eventname-Authentication failed | level-notice | count-1 |
    14). subtype-user | eventname-Authentication lockout | level-warning | count-1 |
    15). subtype-user | eventname-FortiGuard override failed | level-warning | count-1 |
The data is collected from FortiView for the last 24 hours by default. To specify a specific time range, customize the time filter using the diagnose fortiview time command.
To filter the time range of system events in the CLI:
# diagnose fortiview time <arg1> <arg2>
Where <arg1> is the start time in YYYY-MM-DD HH:MM:SS and <arg2> is the end time in YYYY-MM-DD HH:MM:SS.