
Zone Analytics
View query volume by DNS zone, giving insight into which domains receiving the highest number of queries.
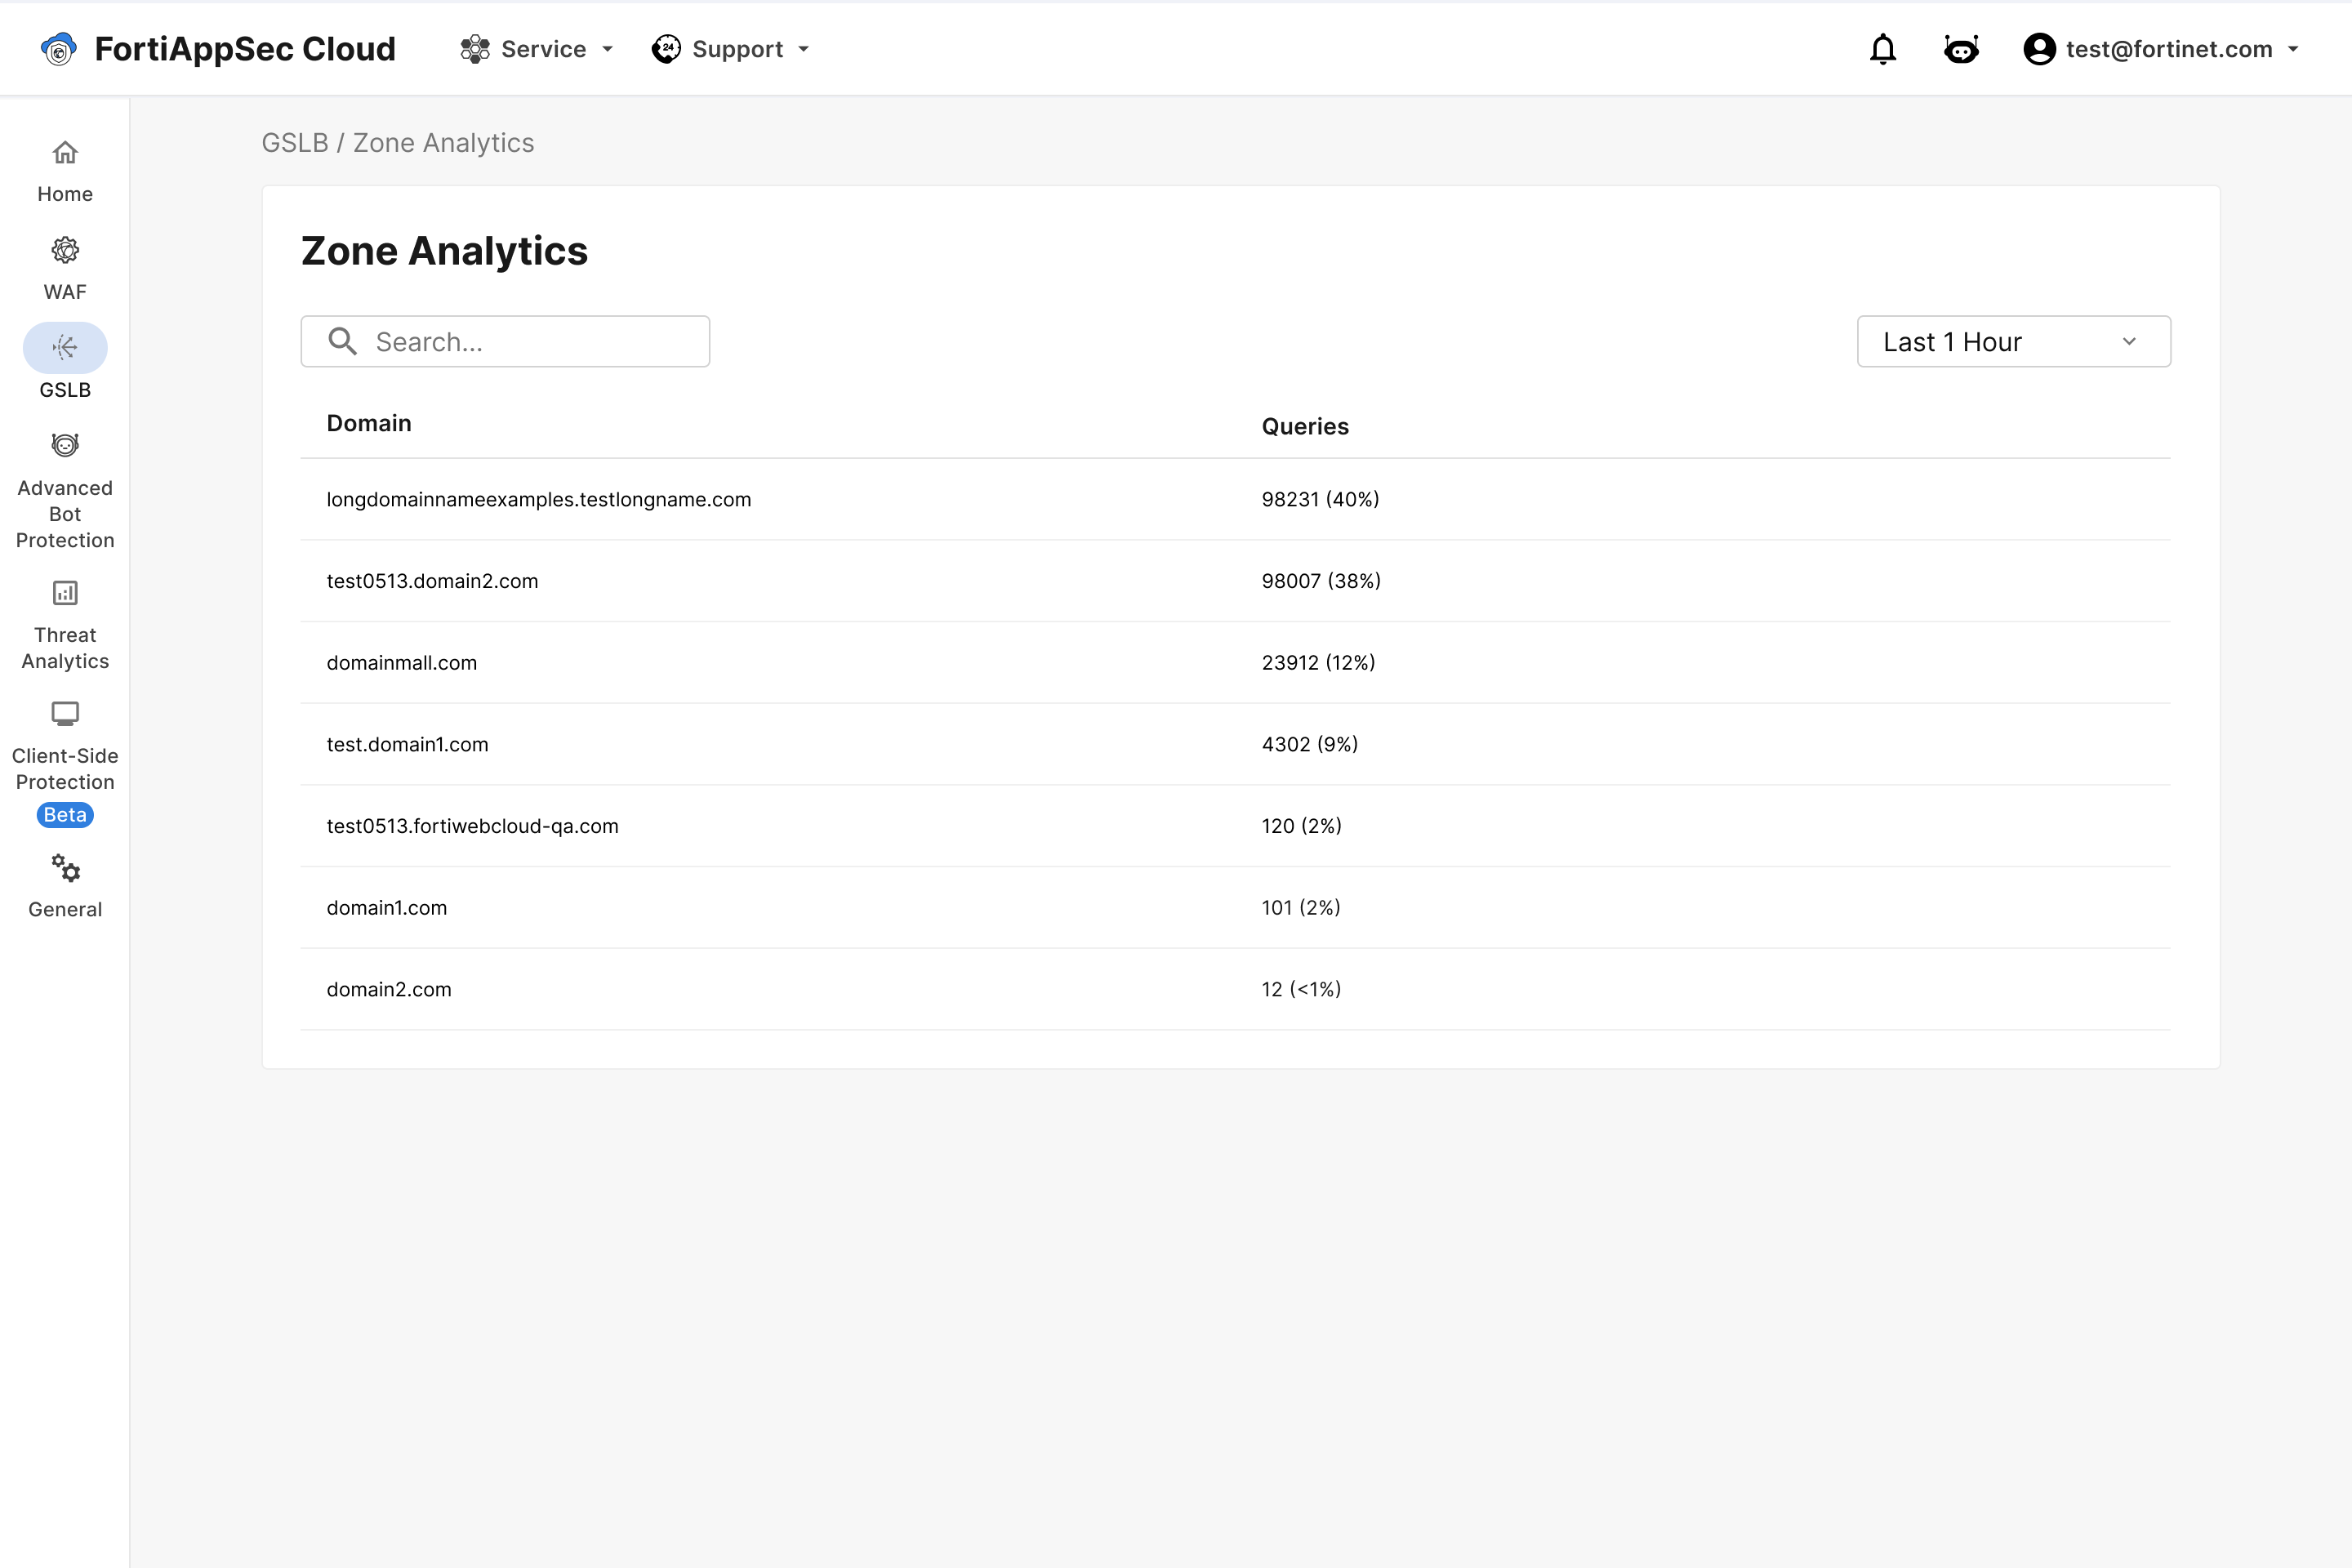
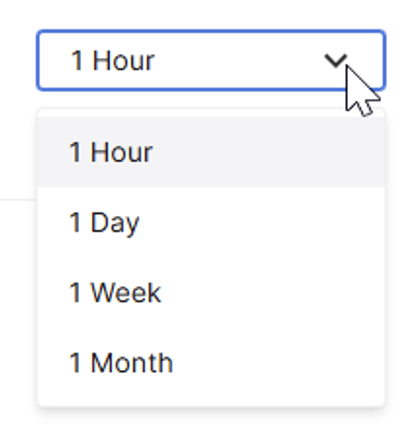
Set time frame
Click the time-frame dropdown above the analytics table (default: 1 Hour) and select the desired time range.
View Domain details
Click any domain to view its traffic details. Use the filters to narrow results by query type and time range.
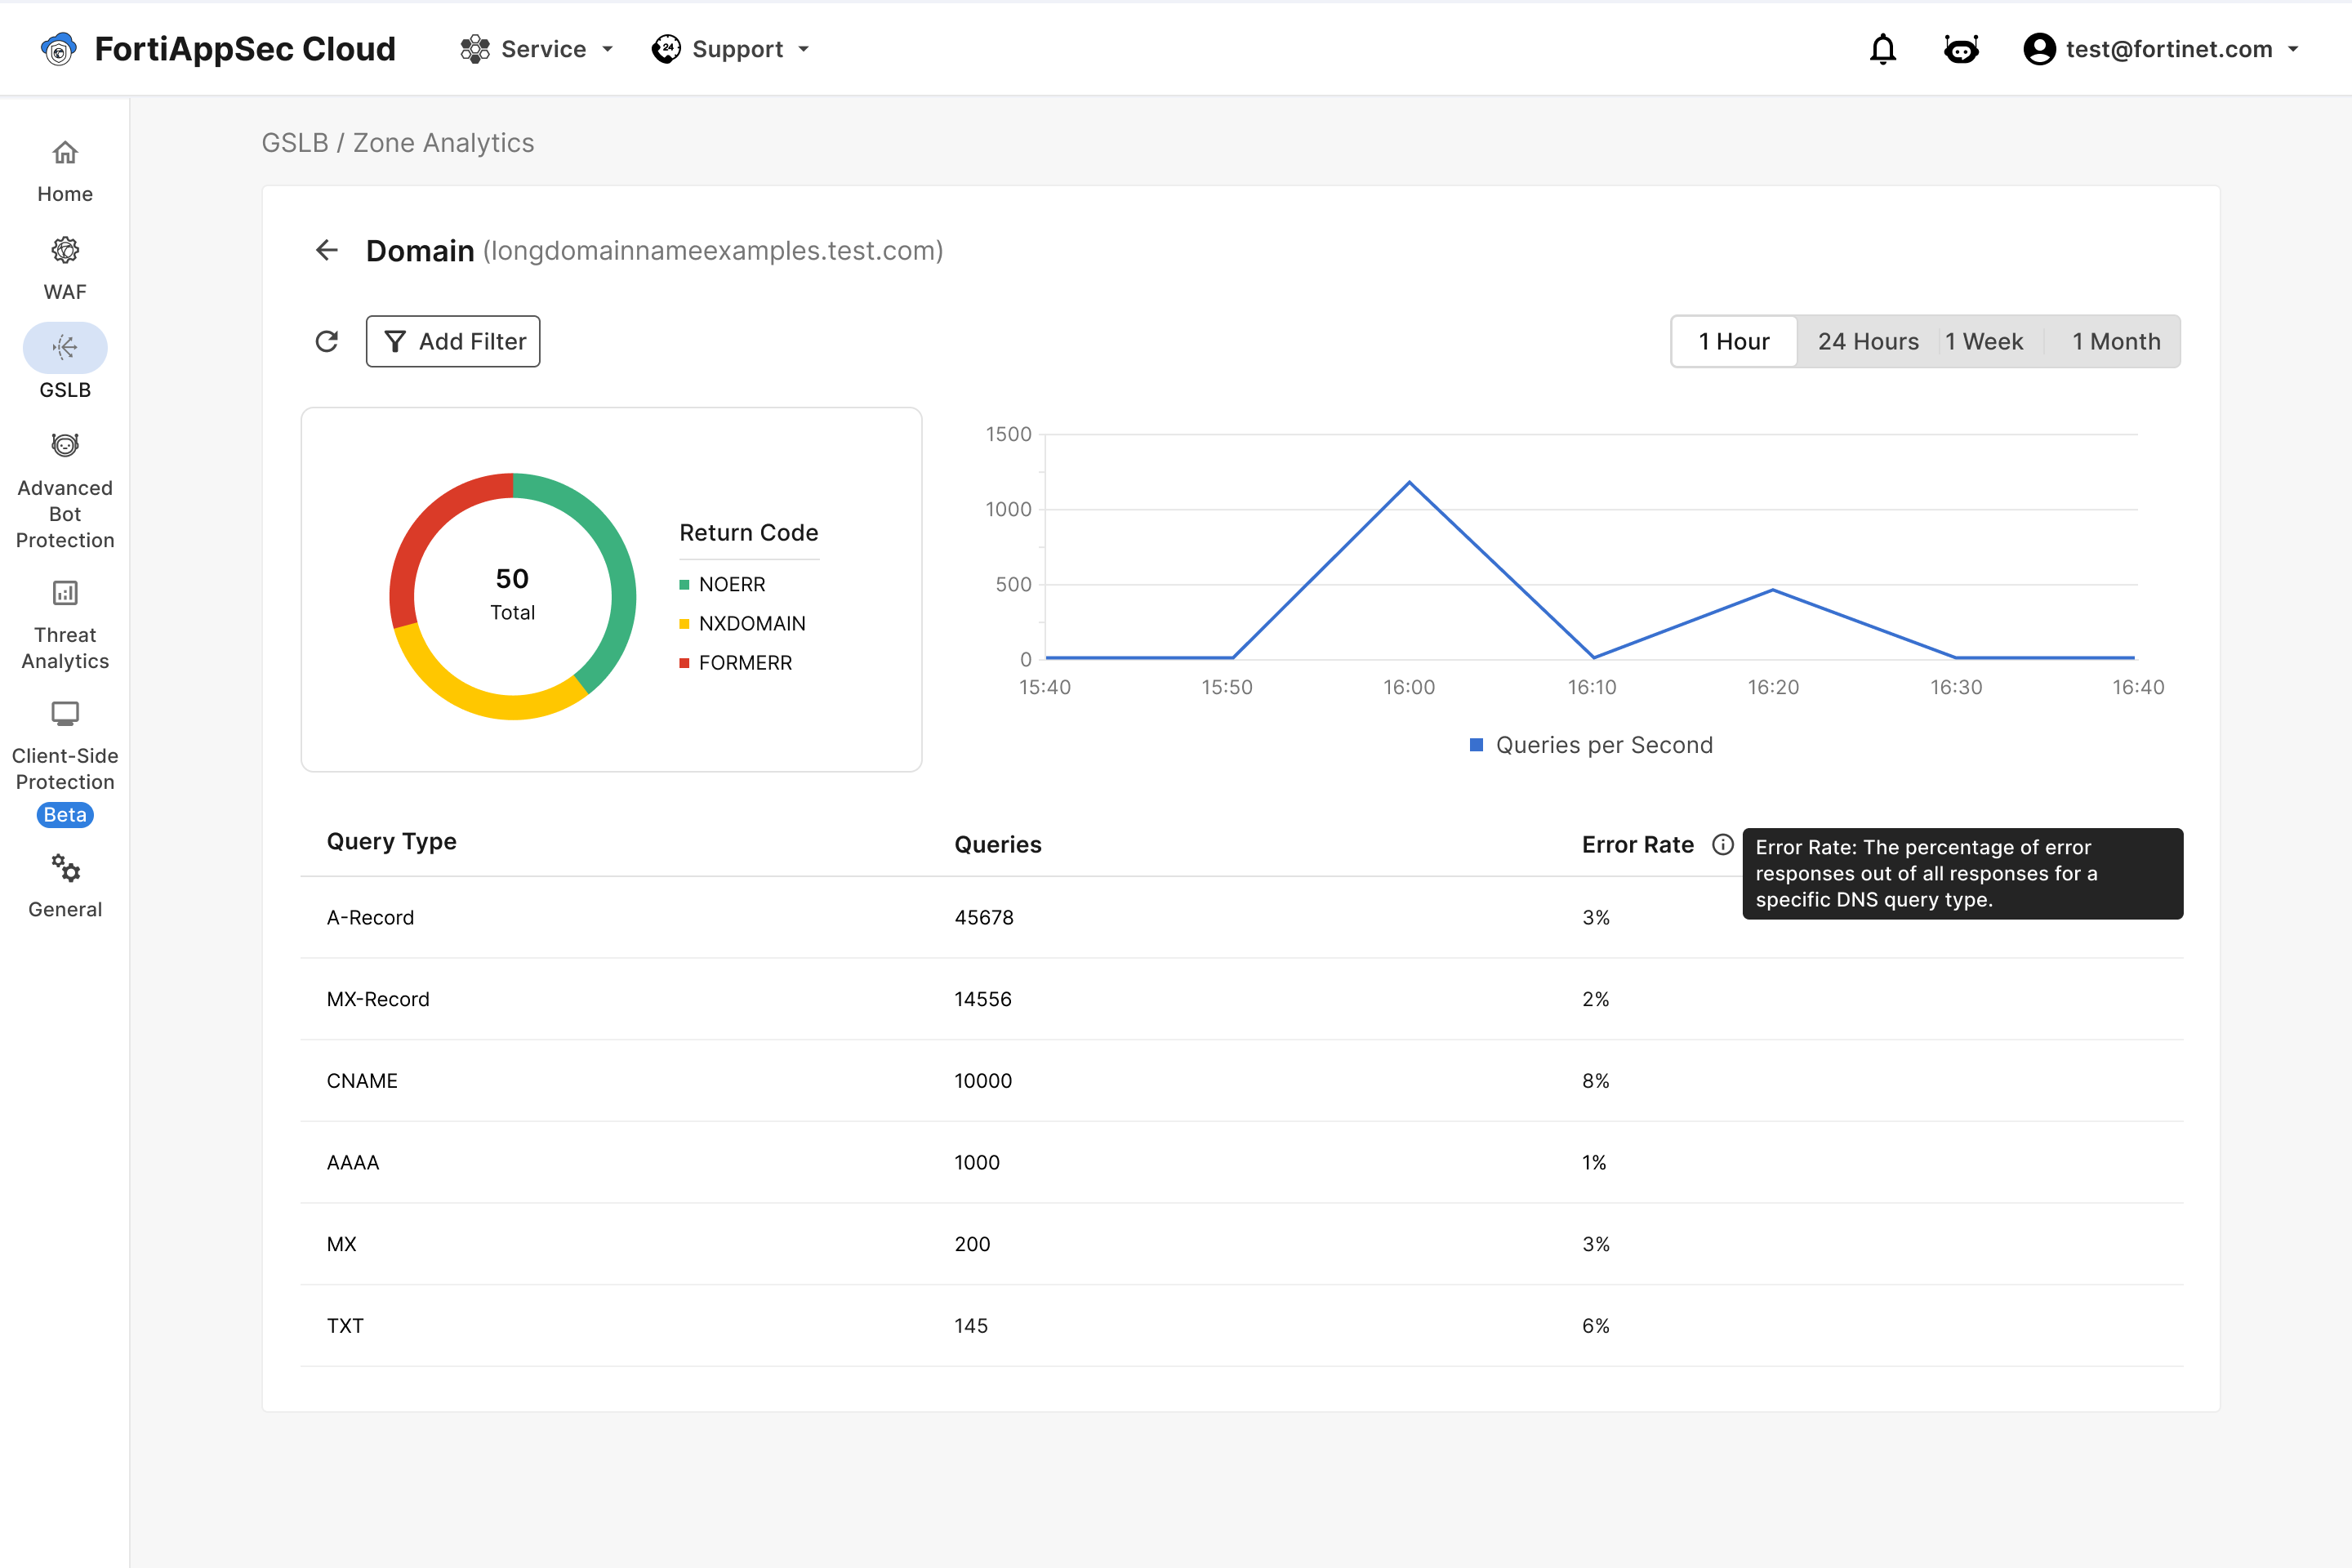
Return Code Distribution
The pie chart surrounding the number of total queries shows how many queries resulted in each return code.
Hover over the chart to see the number of queries that resulted in each return code.
Queries per Second
The line graph displays the queries per second over the selected time frame.
Query Type table
|
Query Type |
Query type defines the purpose and expected format of the DNS response. For example:
|
|
Queries |
The number of queries from the source IP. |
|
Error Rate |
The percentage of error responses out of all responses for a specific DNS query type. |