
Usage
Select one or all applications and date range to view its usage details on the Usage tab.
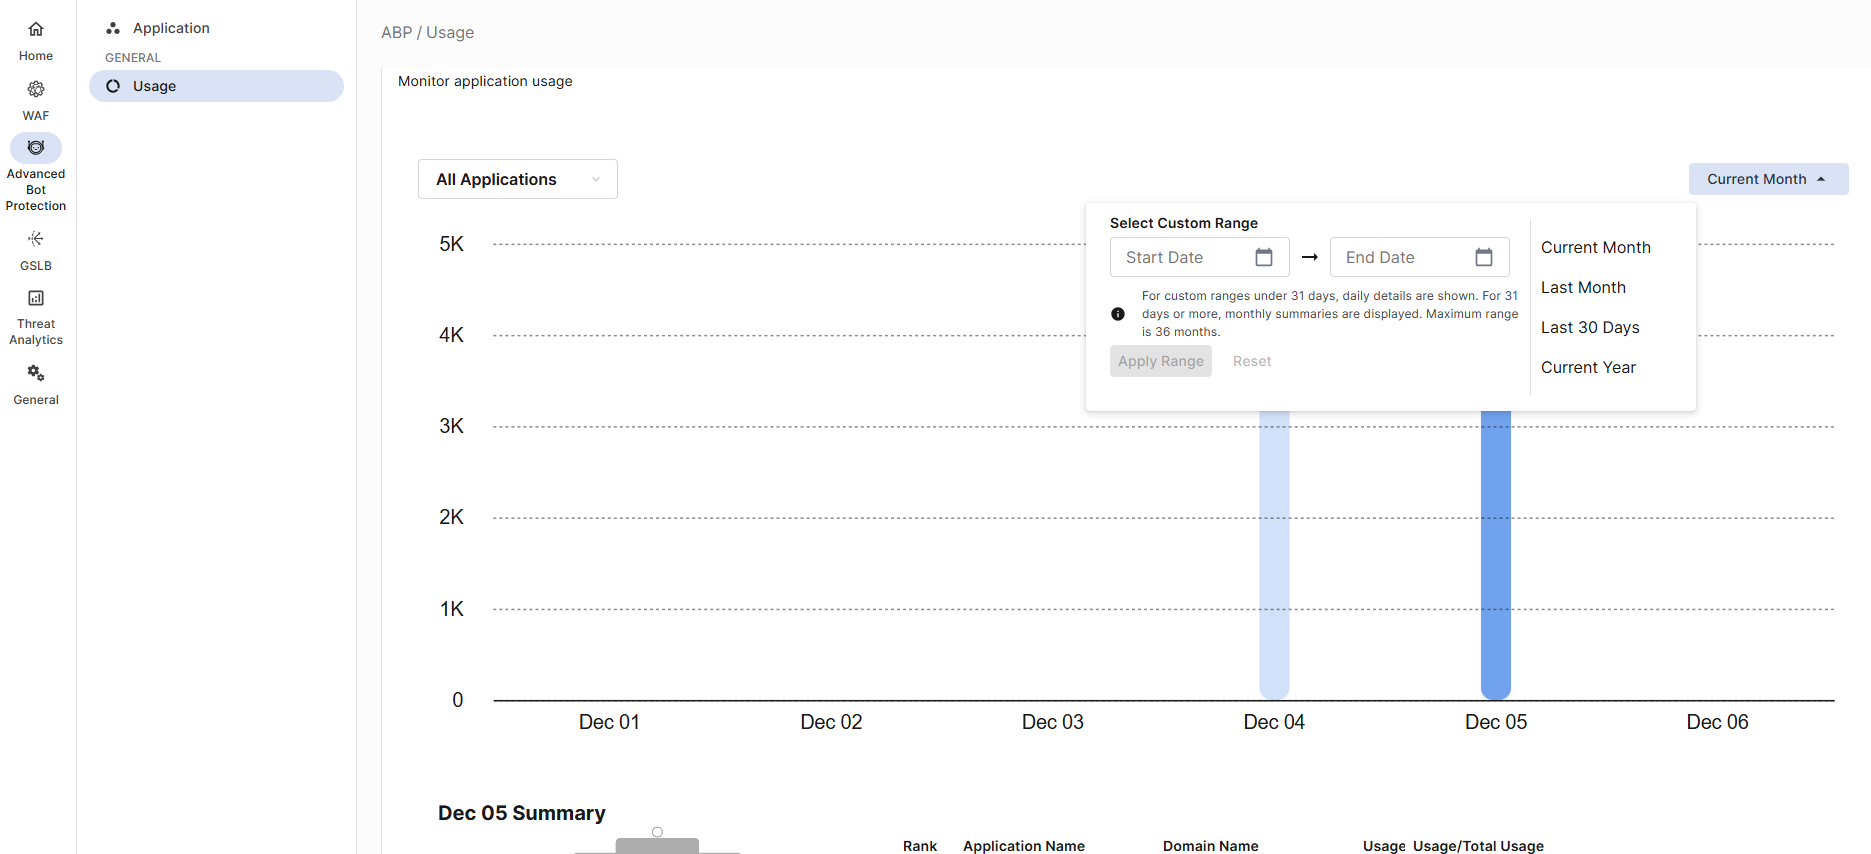
This page includes the following components:
-
A bar graph showing the month-over-month number of requests protected by Advanced Bot Protection for the selected application(s) over the chosen time period.
-
Hover over a bar to see the number of protected requests for the selected month.
-
Click on a bar to change the other components on this page to reflect the data in the selected month.
-
-
Total Usage: the total number of protected requests for the selected application(s) within a pie chart showing the total usage for the month compared to the total capacity purchased in the contract.
-
Click View Details to see the request usage breakdown between each license for the selected month.
-
-
A ranked table displaying the percentage of selected application(s) usage compared to the total usage for the month.