
Usage
The Usage page gives you a clear overview of how your account has been used over time. It breaks down usage for each month of service, helping you easily identify your usage patterns and detect any overages in your account without delay.
The information displayed on this page vary based on the billing structure of your active license.
|
|
Some services have a minimum billable usage, regardless of actual traffic. For example, if a WAF application is deployed, a minimum of 25 Mbps per day of WAF bandwidth will be billed, even if the application receives no traffic. |
Contract-based usage
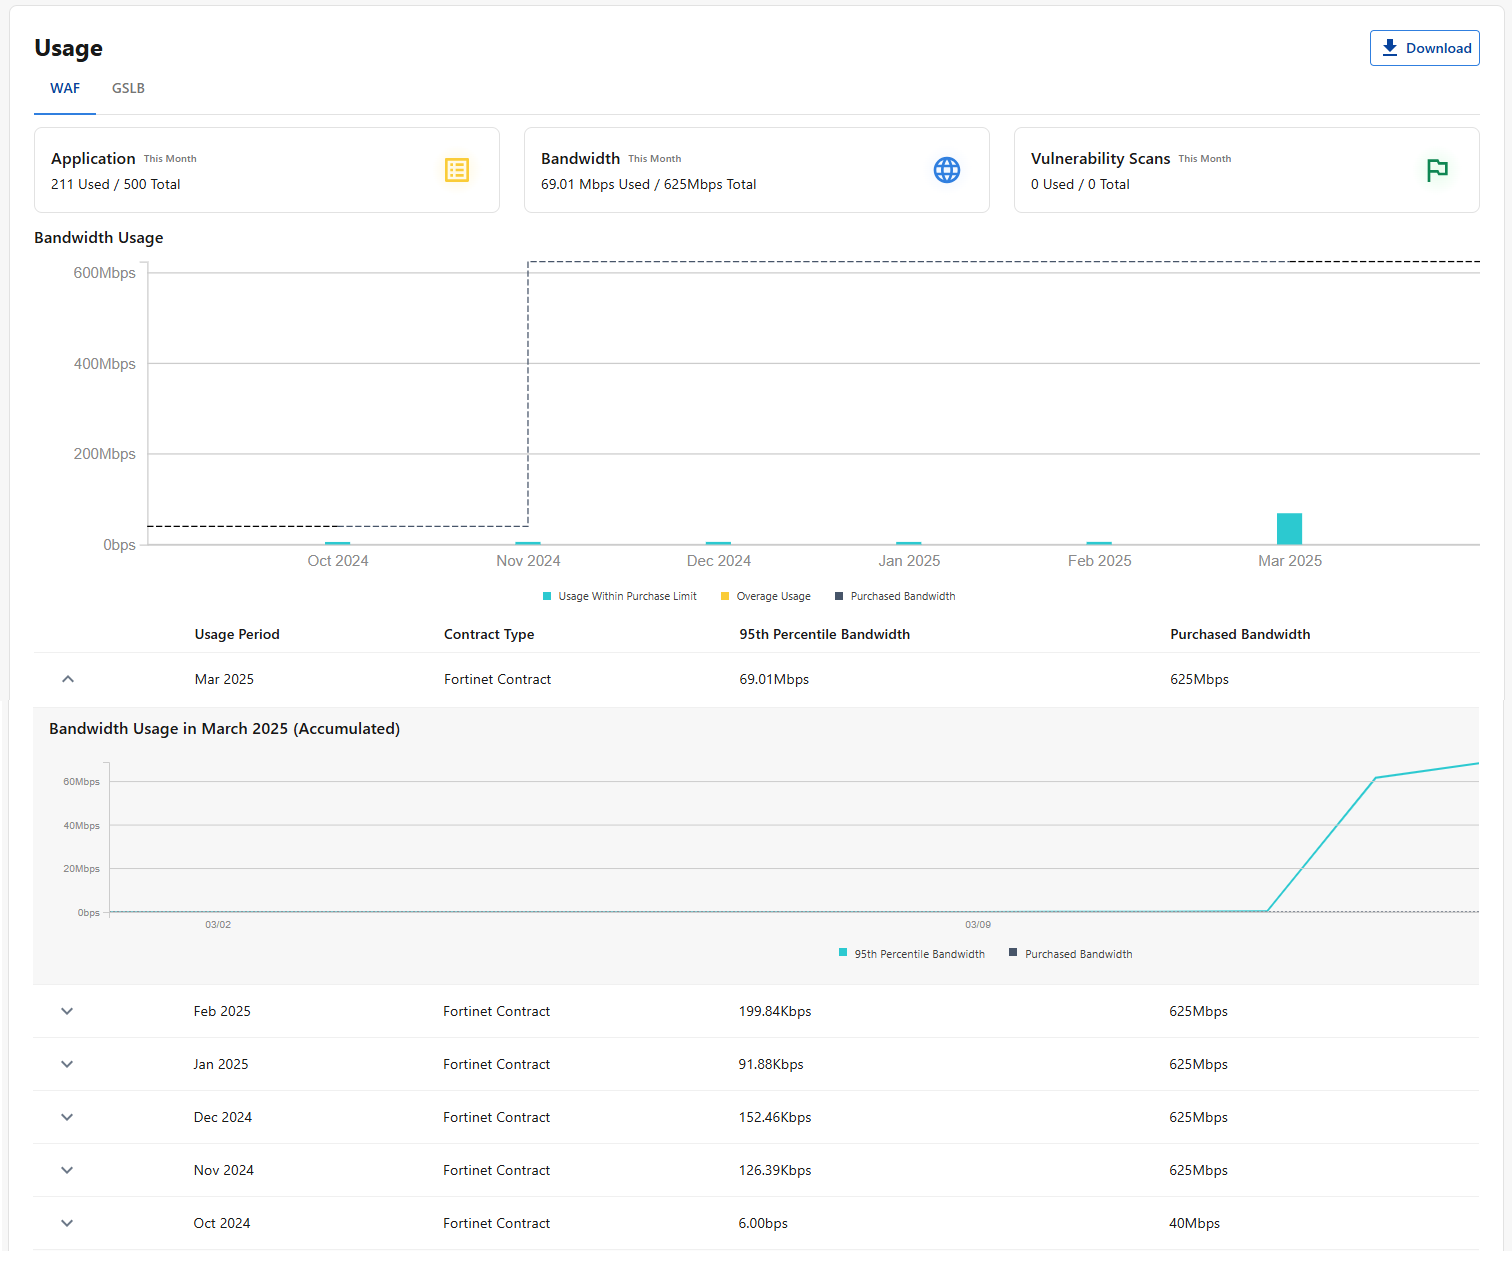
When you are using a license purchased from Fortinet, this page displays usage statistics at the top, tailored to the selected service, showing how much of each resource has been used relative to its limits.
-
WAF
-
Application- the number of applications onboarded to WAF
-
Bandwidth- the amount of data transmitted between your applications and FortiAppSec Cloud for protection and security filtering. This includes data traffic that is analyzed and monitored for threats such as attacks, malicious requests, and other security risks.
-
Vulnerability Scans- the number of times the Vulnerability Scan feature was triggered.
-
-
GSLB
-
Queries - the number of queries exchanged between your GSLB service and WAF/FortiADC/FortiWeb regarding user activity on the protected application.
-
Health Checks- the total number of health checks utilized by your service.
-
-
Advanced Bot Protection
-
Queries- the number of queries exchanged between your ABP service and WAF/FortiADC/FortiWeb regarding user activity on the protected application.
-
The following display for all services:
Account Usage graph
This bar chart displays your account's bandwidth usage history over a period of up to a year. Simply hover over a bar representing a specific month to view the exact usage figures for that month.
Usage table
This table further breaks down the statistics for each month displayed in the Account Usage chart.
|
Field |
Description |
|---|---|
|
Contract Type |
This field specifies the channel you used to subscribe to FortiWeb Cloud, such as Fortinet or FortiFlex. |
|
95th percentile bandwidth |
FortiWeb Cloud measures each account using a burstable model for overall account bandwidth calculation. The model is based on calculating the 95th percentile of bandwidth usage of clean traffic and is also common with other CDNs and Cloud solutions. The 95th percentile bandwidth is calculated in the following way: Traffic for the entire month is measured in 5 minute buckets. At the end of the month, the 5% of buckets with the most Mbps are dropped, and the highest Mbps rate of the remaining buckets represents the 95th percentile value for the account. At the beginning of every month, the 95th percentile bandwidth shown in FortiWeb Cloud might be very low, or even shown as 0. This is because there aren't enough 5-minute buckets collected to calculate a valid value. At the end of the month with more buckets generated, the value becomes more accurate. |
|
Purchased Bandwidth |
The bandwidth included in your contract. |
|
Overage Usage |
The data consumption exceeding your contracted limit. |
|
Status |
Open: The period is ongoing, and information collection is in progress. Closed: The period has ended, and informatione collection is complete. |
Click on any row in this table to view a line graph illustrating usage trends for the selected month, along with the point when you reached the 95th percentile of bandwidth. These statistics can assist you in monitoring your usage habits and determining the appropriate amount of bandwidth to purchase in the future
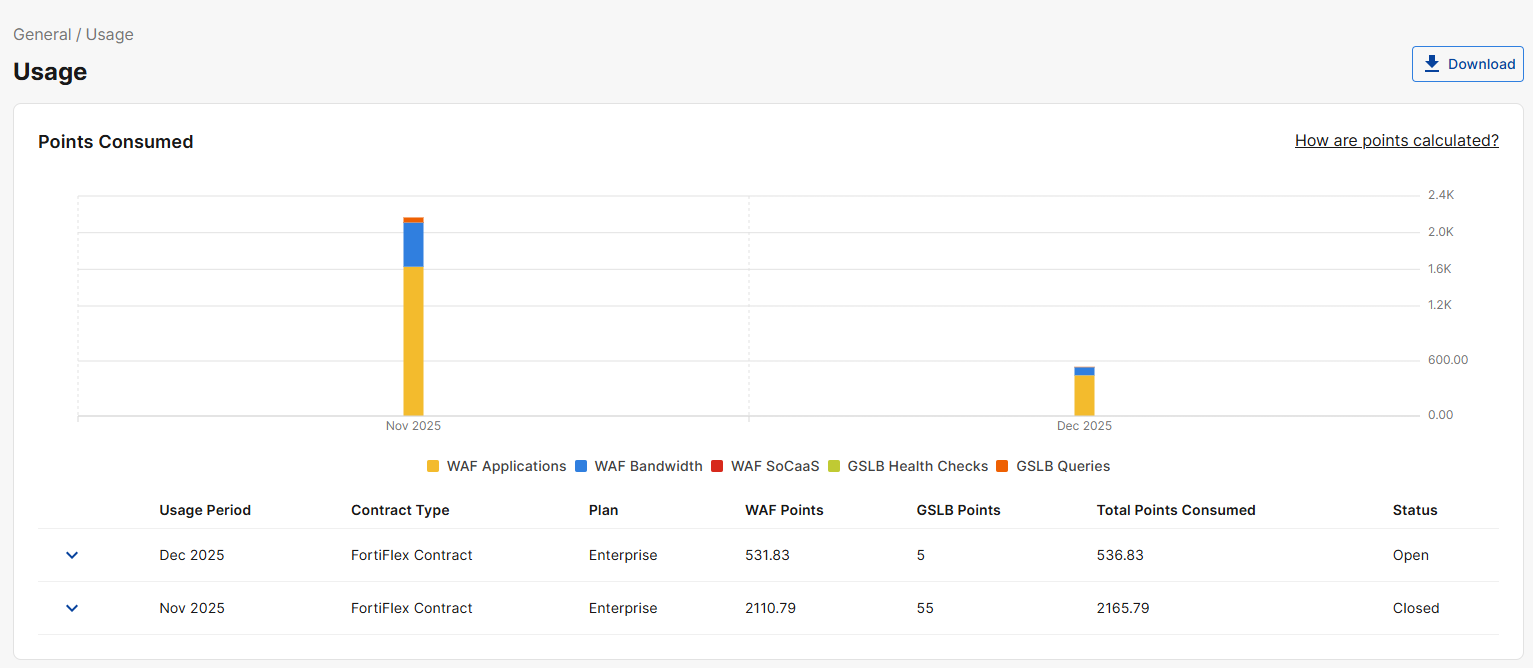
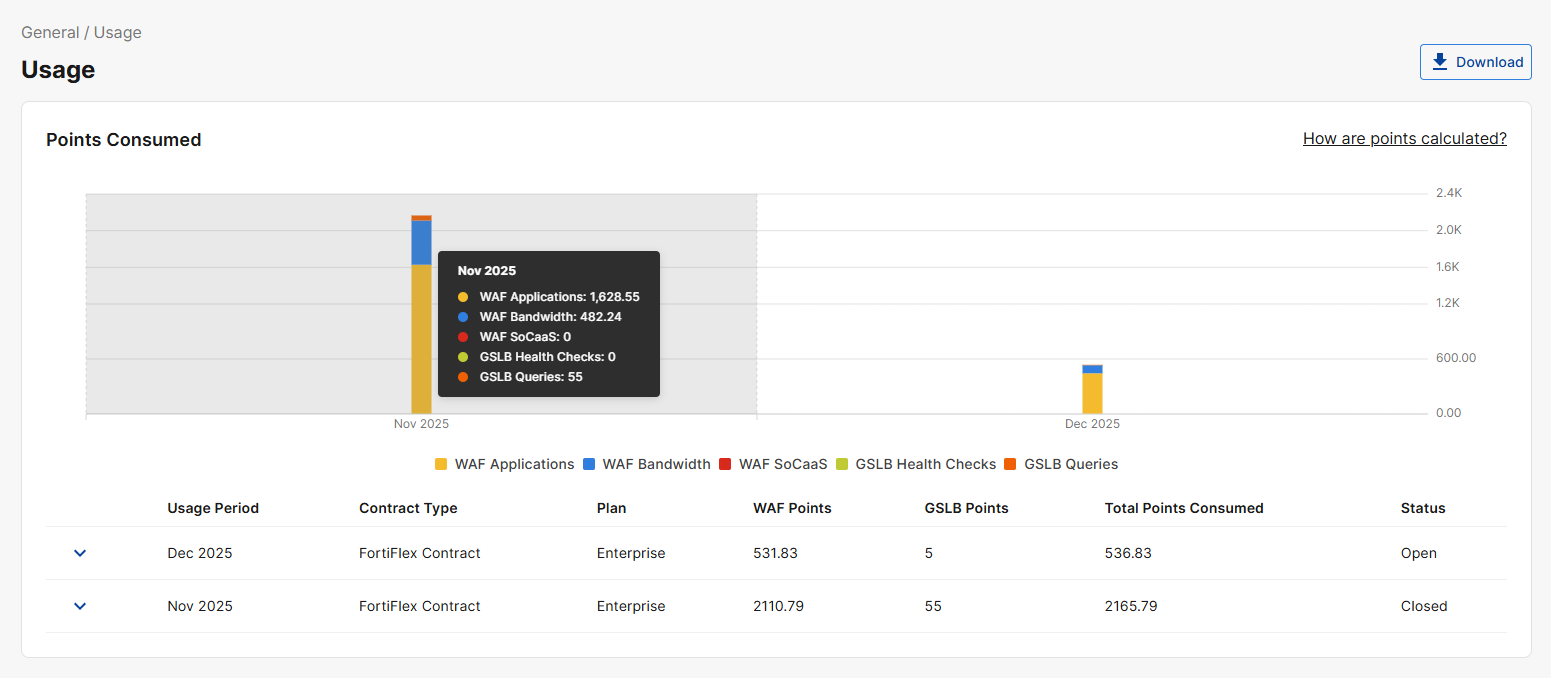
Points-based usage
When you are using an AWS/GCP/Azure marketplace or FortiFlex contract, this page displays the number of points consumed by your application, split by bandwidth, WAF applications, GSLB Queries, and GSLB Health checks.
|
|
For a cost estimate based on manual entry of your usage information:
|
|
Field |
Description |
|---|---|
|
Contract Type |
This field specifies the channel you used to subscribe to FortiWeb Cloud, such as AWS, Azure, or Google Cloud. |
|
Data Used |
The amount of data (in GB) utilized in a given month. |
|
Status |
Open: The period is ongoing, and information collection is in progress. Closed: The period has ended, and information collection is complete. |
Click on any row in the table below the stacked bar chart to expand the usage details of each month.
|
|
The application-level 95th-percentile bandwidth usage is not displayed in the web portal. You can retrieve this data through the API using: For more information, please refer to the FortiAppSec Cloud API documentation. |