


Dashboard
Dashboard > Status appears when you log in to the web UI. It contains a dashboard with widgets that each indicate performance levels or other system statuses.
Each day, check the dashboard for obvious problems.
By default, the Status dashboard contains the following widgets:
- System Information widget
- License widget
- System Resources widget
- Attack Log widget
- HTTP Throughput Monitor widget
- Attack Event History widget
- Policy Sessions widget
- Operation widget
Viewing the dashboard (System > Status > Status)
In the default dashboard setup, widgets display the serial number and current system status of the FortiWeb appliance, including uptime, system resource usage, host name, firmware version, system time, and status of policy sessions. The dashboard also contains a CLI widget that enables you to use the command line interface (CLI) through the web UI.
- To customize the dashboard, select which widgets to display, where they are located on the page, and whether they are minimized or maximized.
- To move a widget, position your mouse cursor on the widget’s title bar, then click and drag the widget to its new location.
- To display any of the widgets not currently shown on Dashboard > Status, click Add Widget. Any widgets currently already displayed on Dashboard > Status are grayed out in the Add Widget menu, as you can only have one of each display on the page.
Adding a widget
- Go to Dashboard > Status.
- In the top-right corner of the dashboard, click Add Widget.
- Click a widget to add it to Dashboard > Status.
- Widgets that are greyed out are currently being displayed on the dashboard.
Note: Click Back to Default to return the active widgets and their positions on the dashboard to the default state.
A minimized widget

| Widget title | The name of the widget. |
| Refresh |
Click to update the displayed information. |
|
Resize |
Click to adjust the size of the widget. |
| Remove | Click to close the widget on the dashboard. FortiWeb prompots you to confirm the action. To display the widget again, click Add Widget near the top of the page. |
To access the dashboard, your administrator's account access profile must have Read permission to items in the System Configuration category. To use features that alter the FortiWeb or perform actions, you may also need Write permissions in various categories. For details, see Permissions.
System Information widget
The System Information widget on the dashboard displays the serial number and the status of basic systems, such as the firmware version, system time, up time, and host name, and high availability (HA) status.
In addition to displaying system information, the System Information widget enables you to configure some basic attributes such as the host name, operation mode, and high availability (HA) mode, and to change the firmware.
FortiWeb administrators whose access profiles permit Write access to items in the System Configuration category, can change the system time, host name, firmware, and operation mode, and high availability (HA) mode.
System Information widget
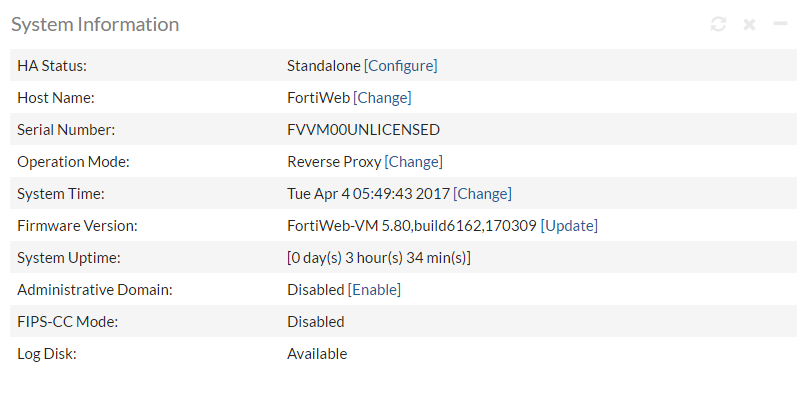
| HA Status |
Displays the status of high availability (HA) for this appliance, either Standalone or Active-Passive. The default value is Standalone. Click Configure to configure the HA status for this appliance. For details, see FortiWeb high availability (HA) . |
| Host Name |
Displays the host name of the FortiWeb appliance. Click Change to change the host name. For details, see Changing the FortiWeb appliance’s host name. |
| Serial Number |
Displays the serial number of the FortiWeb appliance. Use this number when registering the hardware or virtual appliance with Fortinet Customer Service & Support: On hardware appliance models of FortiWeb, the serial number (e.g. FV-3KC3R11111111) is specific to the FortiWeb appliance’s hardware and does not change with firmware upgrades. On virtual appliance models, the serial number indicates the maximum number of vCPUs that can be allocated according to the FortiWeb-VM software license, such as FVVM020000003619 (where “VM02” indicates a limit of 2 vCPUs). If it is FVVM00UNLICENSED, the FortiWeb-VM license has not been successfully validated, and FortiWeb is operating with a limited trial license. |
| Operation Mode |
Displays the current operation mode of the FortiWeb appliance. The default operation mode is Reverse Proxy. For details on the operation modes, see Setting the operation mode. Click Change to switch the operation mode. Caution: Back up the configuration before changing the operation mode. Changing modes deletes any policies not applicable to the new mode, static routes, V-zone IPs, and VLANs. For instructions on backing up the configuration, see Backup & restore. |
| System Time |
Displays the current date and time according to the FortiWeb appliance’s internal clock. Click Change to change the time or configure the FortiWeb appliance to get the time from an NTP server. For details, see Setting the system time & date. |
| Firmware Version |
Displays the version of the firmware currently installed on the FortiWeb appliance. Click Update to install a new version of firmware. For details, see Updating the firmware. Note: Starting with the 6.0 release, FortiWeb supports Google Cloud Platform and Oracle VM VirtualBox. |
| System Uptime | Displays the time in days, hours, and minutes since the FortiWeb appliance last started. |
| Administrative Domain |
To delete existing appliance-wide policies and settings then enable ADOMs, click Enable. See also Administrative domains (ADOMs). To disable ADOMs, first delete ADOM-specific settings and policies, then click Disable. |
| FIPS-CC Mode | Displays whether Federal Information Processing Standards (FIPS) and Common Criteria (CC) compliant mode is enabled. You use a CLI command to enable this mode. |
See also
License widget
The FortiGuard Information widget on the dashboard displays Fortinet Technical Support registration, licensing and FortiGuard service update information.
FortiGuard Information widget
| VM License |
Indicates whether a FortiWeb-VM appliance has a paid software license. The license affects the maximum number of allocatable vCPUs. For details, see the FortiWeb-VM Installation Guide: HTTP://docs.fortinet.com/fortiweb/hardware Possible states are:
This appears only in FortiWeb-VM. |
|
| Support Contract |
Indicates which account registered this appliance with Fortinet Technical Support.
Click Launch Portal to log into the Fortinet Support account that registered this FortiGate unit. |
|
| FortiGuard | ||
| FortiWeb Security Service |
Indicates the validity of the appliance’s contract for FortiGuard FortiWeb Security Service, which provides updates via the Internet from Fortinet’s FDN for:
Possible states are:
To renew, either contact your reseller or go to the Fortinet Customer Service & Support website: Also indicates the current version number of the installed service package, the expiry date of the service contract (if any) for this appliance, and the previous time and method of update. |
|
| FortiWeb Antivirus Service |
Indicates the validity of the appliance’s contract for FortiGuard Antivirus Service, which provides updates via the Internet from Fortinet’s FDN for virus signatures. Possible states are:
To renew, either contact your reseller or go to the Fortinet Customer Service & Support website: Also indicates the current version number of the installed service package, the expiry date of the service contract (if any) for this appliance, and the previous time and method of update. |
|
| FortiWeb IP Reputation Service |
Indicates the validity of the appliance’s contract for FortiGuard IRIS Service, which provides updates via the Internet from Fortinet’s FDN for known botnets, malicious clients, and anonymizing proxies. Possible states are:
To renew, either contact your reseller or go to the Fortinet Customer Service & Support website: Also indicates the current version number of the installed service package, the expiry date of the service contract (if any) for this appliance, and the previous time and method of update. |
|
| FortiWeb Credential Stuffing Defense Service |
Indicates the validity of the appliance's contract for FortiGuard Credential Stuffing Defense database, which prevents against credential stuffing attacks. Possible states are:
Also indicates the current version number of the installed service package, the expiry date of the service contract (if any) for this appliance, and the previous time and method of update. |
|
| FortiSandbox |
Indicates the validity of the appliance’s contract for FortiSandbox Service, which provides updates via the Internet from Fortinet’s FDN. Possible states are:
To renew, either contact your reseller or go to the Fortinet Customer Service & Support website: Also indicates the current version number of the installed service package, the expiry date of the service contract (if any) for this appliance, and the previous time and method of update. |
|
|
Geo DB |
Indicates the validity of the appliance’s contract for Geo DB, which provides updates via the Internet from Fortinet’s FDN. Possible states are:
To renew, either contact your reseller or go to the Fortinet Customer Service & Support website: Also indicates the current version number of the installed service package, the expiry date of the service contract (if any) for this appliance, and the previous time and method of update. |
|
For information on updates, see Connecting to FortiGuard services.
See also
|
|
The CLI Console widget requires that your web browser support JavaScript. |
System Resources widget
The System Resources widget on the dashboard displays information such as CPU and memory usage.
|
|
The widget displays CPU and memory usage as an animated bar and as a percentage of the usage for core processes only. CPU and memory usage for management processes (for example, for HTTPS connections to the web UI) is excluded. |
Normal idle load varies by hardware platform, firmware, and configured features. To determine your specific baseline for idle, configure your system completely, reboot, then view the system load. After at least 1 week of uptime with typical traffic volume, view the system load again to determine the normal non-idle baseline.
System Resources widget

To determine your available disk space, you can alternatively connect to the CLI and enter the command:
diagnose system mount list
| Reboot | Click to halt and restart the operating system of the FortiWeb appliance. |
| ShutDown | Click to halt the operating system of the FortiWeb appliance, preparing its hardware to be powered off. |
| Reset |
Click to revert the configuration of the FortiWeb appliance to the default values for its currently installed firmware version. Caution: Back up the configuration before selecting Reset. This operation cannot be undone. Configuration changes made since the last backup will be lost. For instructions on backing up the configuration, see Restoring a previous configuration. |
Attack Log widget
The Attack Log widget displays the latest attack logs. Attack logs are recorded when there is an attack or intrusion attempt against the web servers protected by the FortiWeb appliance.
Attack logs help you track policy violations. Each message shows the date and time that the attack attempt occurred. For details, see Viewing log messages.
|
|
Attack log messages can also be delivered by email, Syslog, FortiAnalyzer, or SNMP. For details, see Enabling log types, packet payload retention, & resource shortage alerts, Configuring logging, and SNMP traps & queries. |
Attack Log widget

HTTP Throughput Monitor widget
The HTTP Throughput Monitor widget displays HTTP traffic volume throughput in real-time:

Mouse over the graph to see HTTP throughput for the displayed time period.
In the top-right corner of the widget, use the Policy drop-down menu to select either the total HTTP throughput or the HTTP throughput for a specific server policy.
See also
Attack Event History widget
The Attack Event History widget displays information about attacks that are detected and prevented. You can view information by Attack Type or Threat Level using the Attacks by drop-down menu.
Use the Time Interval drop-down menu to view the Attack Event History within the following time periods:
- 1 hour
- 12 hours
- 48 hours
- 1 week
Attack Type

Click elements in the legend of the graph to show/hide those elements in the graph.
In the Attacks by Attack Type window under the graph, select the + icon under the Drilldown column to view the following information about each attack type:
- Server Policy
- Client
- Time
Threat Level

Click elements in the legend of the graph to show/hide those elements in the graph.
In the Attacks by Threat Level window under the graph, select the + icon under the Drilldown column to view the following information about each attack type:
- Server Policy
- Client
- Time
Event Log Console widget
The Event Log Console widget on the dashboard displays log-based messages.
Event logs help you track system events on your FortiWeb appliance such as firmware changes, and network events such as changes to policies. Each message shows the date and time that the event occurred. For details, see Viewing log messages.
|
|
Event log messages can also be delivered by email, Syslog, FortiAnalyzer, or SNMP. For details, see Enabling log types, packet payload retention, & resource shortage alerts, Configuring log destinations, and SNMP traps & queries. |
Event Log Console widget

Policy Sessions widget
The Policy Sessions widget on the dashboard displays the number of HTTP/HTTPS sessions that are currently governed by each policy.
Policy Sessions widget

- Policy Name—Shows the name of the policy. For information on policies, see How operation mode affects server policy behavior.
- Status—Displays whether the policy is enabled or disabled. For details, see Enabling or disabling a policy.
- Concurrent Connections—Shows the total number of connections that the policy currently governs.
- Connections/Sec—Shows the number of connections the policy is governing per second.
Operation widget
The Operation widget on the dashboard displays:
- “Up” (cable plugged in, indicated by green) or
- “Down” (cable unplugged, indicated by grey)
link status of each physical network interface (or, for FortiWeb-VM, virtual adapter).
|
|
The detected physical link status indicator does not indicate whether you have administratively enabled or disabled the network interface. To bring up or bring down a network interface, see To configure a network interface or bridge. |
Hover over a link icon to display the following additional information:
- Name (e.g. port1)
- Link speed (e.g. 1000 Mbps/Full Duplex)
- The IP address and subnet mask
- Packets sent (Tx) and received (Rx)
Operation widget
