


Security
FortiView's Security menu provides information about the specific types of attacks FortiWeb detects, the countries in which attacks originate, the server policies that handle threats, and the specific devices that attackers use.
You can see the total number of threats, threat scores, the types of actions FortiWeb carries out in response to specific types of attacks, and how severe attacks are.
This gives you the ability to modify your FortiWeb configuration to best address specific threats your environment faces.
Countries
Go to FortiView > Security > Countries.
From this window, you can see total threat data and threat data for each country:
Viewing individual countries
There are two ways to drill down into the key elements about a specific country:
- Double-click the country from the list of countries.
- Click the Add Filter icon and select the country.
A country summary provides an overview of the total threats, accumulated threat score, actions, and service used: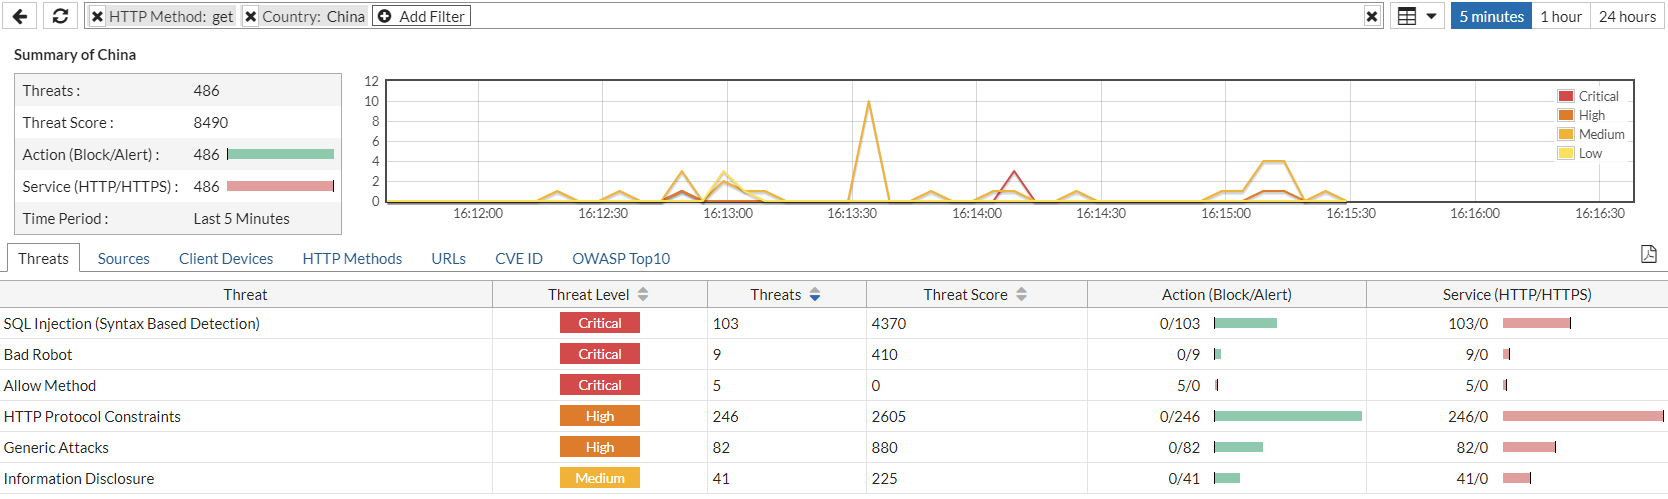
From here, you can also view information about specific types of threats, the source IP of attacks, the client devices that launched attacks, HTTP methods used, and targeted URLs for the specified country under the Threats, Sources, Client Devices, HTTP Methods, URLs, CVE ID, and OWASP Top10 tabs, respectively. You can use either the Add Filter icon to filter for these things, or select the relevant tab and double-click the row of the thing you want to know more about.
You can even filter for a combination of these things. For example, below you can see the server policy that handled a specific type of threat from a particular device that targeted a specific URL:

For any given country, you can drill down into specific threat, source IP, client device ID, HTTP method, URL, CVE ID, and OWASP Top10 entries to learn more information about them via the Log Details. Below is an example.
Go to FortiView > Security > Countries.
To drill down into a country, double-click it.
Select the Sources tab.
|
|
You can select any tab for a country to view the Log Details of an attack. To view the Log Details of an attack, you simply have to select a specific attack. |
Drill down into an IP address.
You will see every attack made from that IP address.
Select a specific attack from the IP address. You will be able to see information about the attack from this IP address. The Log Details will appear along the right side of the window:
Threats
Go to FortiView > Security > Threats.
From this window, you can see total threat data that FortiWeb has detected:
Viewing specific threats
There are two ways to view information about a specific type of threat:
- Double-click the threat type from the list of threats
- Click the Add Filter icon and select the threat type
A summary for a particular threat type shows the threat level, total number of threats, accumulated threat score, actions, and service used for that threat type:
From here, you can also view information about the source IP of attacks, countries from which attacks are launched, the client devices that launched attacks, HTTP methods used, and targeted URLs under the Sources, Countries, Client Devices, HTTP Methods, URLs, CVE ID, and OWASP Top10 for the specified threat. You can use either the Add Filter icon to filter for these things, or select the relevant tab and double-click the row of the thing you want to know more about.
You can even filter for a combination of these things, including the amount of a specific type of threat from a particular device in a given country that targeted a specific URL:
For any given type of threat, you can drill down into specific country, source IP, client device ID, HTTP method, URL, CVE ID, and OWASP Top10 entries to learn more information about the threat via the Log Details. Below is an example:
Go to FortiView > Security > Threats.
Select a threat.
Select the Sources tab.
|
|
You can select any tab for a country to view the Log Details of an attack. To view the Log Details of an attack, you simply have to select a specific attack. |
Double-click an IP address.
You will see every attack made from that IP address.
Select a specific attack from the IP address. You will be able to see information about the attack from this IP address. The Log Details will appear along the right side of the window:
Server Policies
Go to FortiView > Security > Server Policies.
This window shows total threat data and threat data for each server policy:
Viewing threats per server policy
Two ways are available to view key elements about a server policy:
- Double-click the Server Policy name from the Server Policy list.
- Click the Add Filter icon and select the server policy.
The server policy summary page provides an overview of total threats, accumulated threat score, actions, and service used.
Also, you can view information about specific types of threats, the source IP of attacks, the country where the attacks come from, the client devices that launched attacks, HTTP methods used, targeted URLs, and CVE IDs for the specified server policy under the tabs Threats, Sources, Countries, Client Devices, HTTP Methods, URLs, CVE ID, and OWASP Top10 tabs respectively. You can use either the Add Filter icon to filter for these things, or select the relevant tab and double-click the row of the thing you want to know more about.
You can even filter for a combination of these things. The image below shows targeted URL, and source IP of attacks of a server policy.
For any given server policy, you can drill down into specific threat, source IP, country, client device ID, HTTP method, URL, CVE ID, and OWASP Top10 entries to learn more information about them via the Log Details. Below is an example.
Threat Map
Go to FortiView > Security > Threat Map.
The Threat Map displays network activity by geographic region. From this window, you can see a global map that shows threats in real-time from specific countries:

In the top-right corner of the window, you can select:
now—View incoming threats in real-time.
1 hour—View a snapshot of incoming threats from the last hour.
Bot Analysis
Go to FortiView > Security > Bot Analysis.
Bot Analysis displays statistics on access by search engine indexers and malicious bots such as DoS, Spam, Crawler, etc. Statistics are gathered by DoS prevention in anti-DoS rules,and Configuring known bots. Based on this data, if an automated tool is abusing access, you can configure rate limiting with such as Custom Policy.
You can view information on the number of search engines and malicious bots in certain time periods. Click the pie chart, and you can view the second level of one malicious bot.
See also
Scanner Integration
Go to FortiView > Security > Scanner Integration.
If you've configured FortiWeb to receive XML-format reports from third-party web vulnerability scanners, you can visualize the scanner reports here.
From this window, you can see a summary of mitigated and open threats from scanner reports:

In the top-right corner of the window, in the top menu bar, you can use the Vulnerability Status drop-down menu to view either Open or Mitigated threats. You can also use the Add Filter icon in the top menu bar to filter for the following information:
- Action
- Adom Name
- Date/Time
- File Name
- ID
- Profile Name
- Profile Type
- Rule Type
- Scanner Type
- Severity
- Vulnerability Name
Under the Summary Information, you can see the severity of Open and Mitigated threats that the vulnerability scans detect. Mouse over elements of the pie chart to learn more information:

Click elements of the pie chart to drill down into them. When you click an element to drill down into it, use the Statistics by drop-down menu to view threats by:
- Severity
- Scanner Type
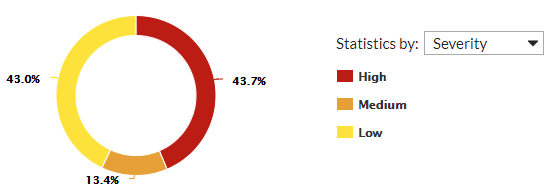
When viewing the pie chart by Severity or Scanner Type, click an element of the pie chart to drill down another level and view the proportion of specific types of vulnerabilities for that element:
