
Stack view
The Stack view displays the following sections of information:
|
Field |
Description |
|---|---|
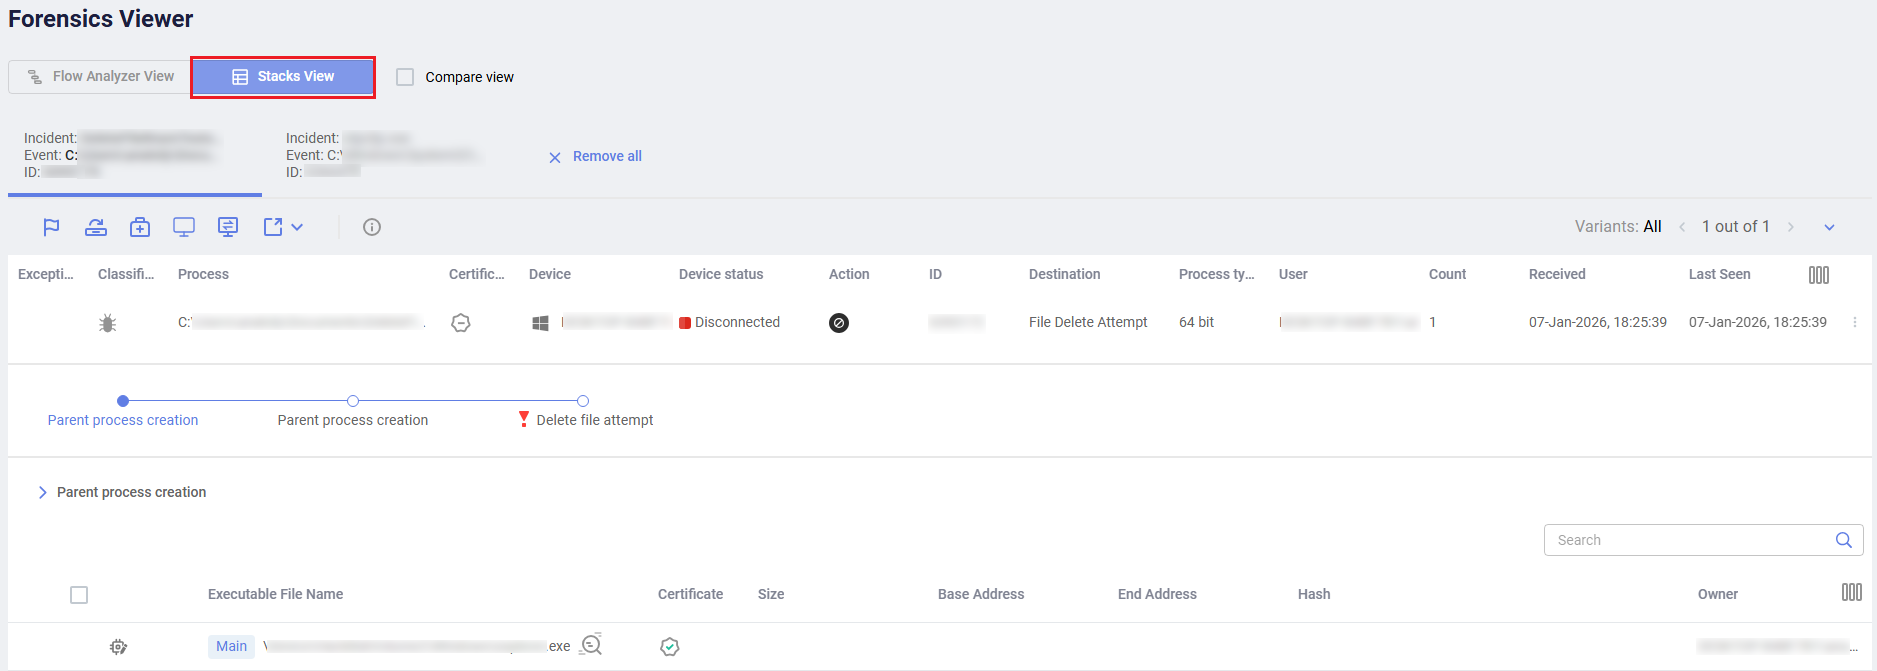
| Incident | Shows the same information as in the Incidents. |
| Stacks | A control toolbar that depicts the stacks that were collected in each step prior to the connection establishment requester file access. A red exclamation mark  means that a rule violation was observed in this stack. You can click the different stack names to see the collected stack data. means that a rule violation was observed in this stack. You can click the different stack names to see the collected stack data. |
| Stack Content Details |
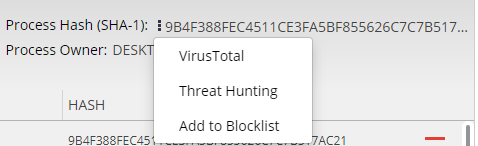
The bottom of the window displays each stack in the flow of the selected step. The stack entries represent the executable files that resided in the stack upon collecting the stack data. Click the stack node to filter the display to show that stack. Click the Process Hash link to display a dropdown menu with the following options:
|
For each executable, you can see the following information:
- Executable File Name
- Writable: Specifies whether the executable code can be modified.
- Certificate: Specifies whether or not the certificate was signed.
- Repetitions: Specifies how many times this executable was detected in the stack.
- Base Address of this entry in memory.
- End Address of this entry in memory.
- Hash: Specifies the file hash.
The row of the executable that triggered the EDR security event is highlighted with a red exclamation mark . This indicates the row that you may want to investigate further. You can expand an executable row to display an even deeper level of information describing that process.