
Forensics
|
|
The Forensics functionality is unavailable for mobile incidents. |
Use the Forensics menu to delve deeply into the actual internals of the communicating devices’ operating system that led up to the security event.
The Forensic Viewer provides an abundance of deep analysis and drill-down options that reveal the process flows, memory stacks and a variety of operating system parameters in a graphic view, such as:
- Infected device and application details.
- Evidence path, which includes the process that the threat actor violated and which type of violation was executed.
- Side-by-side security event comparisons.
The first stage of working with Forensics is to select one or more security event aggregations or security events to analyze. To do so, use one of the methods below:
- In the Incidents view, select a security event aggregation and then click the Forensics button (
 ). Selecting a security event aggregation lets you analyze the aggregation of events triggered on this process.
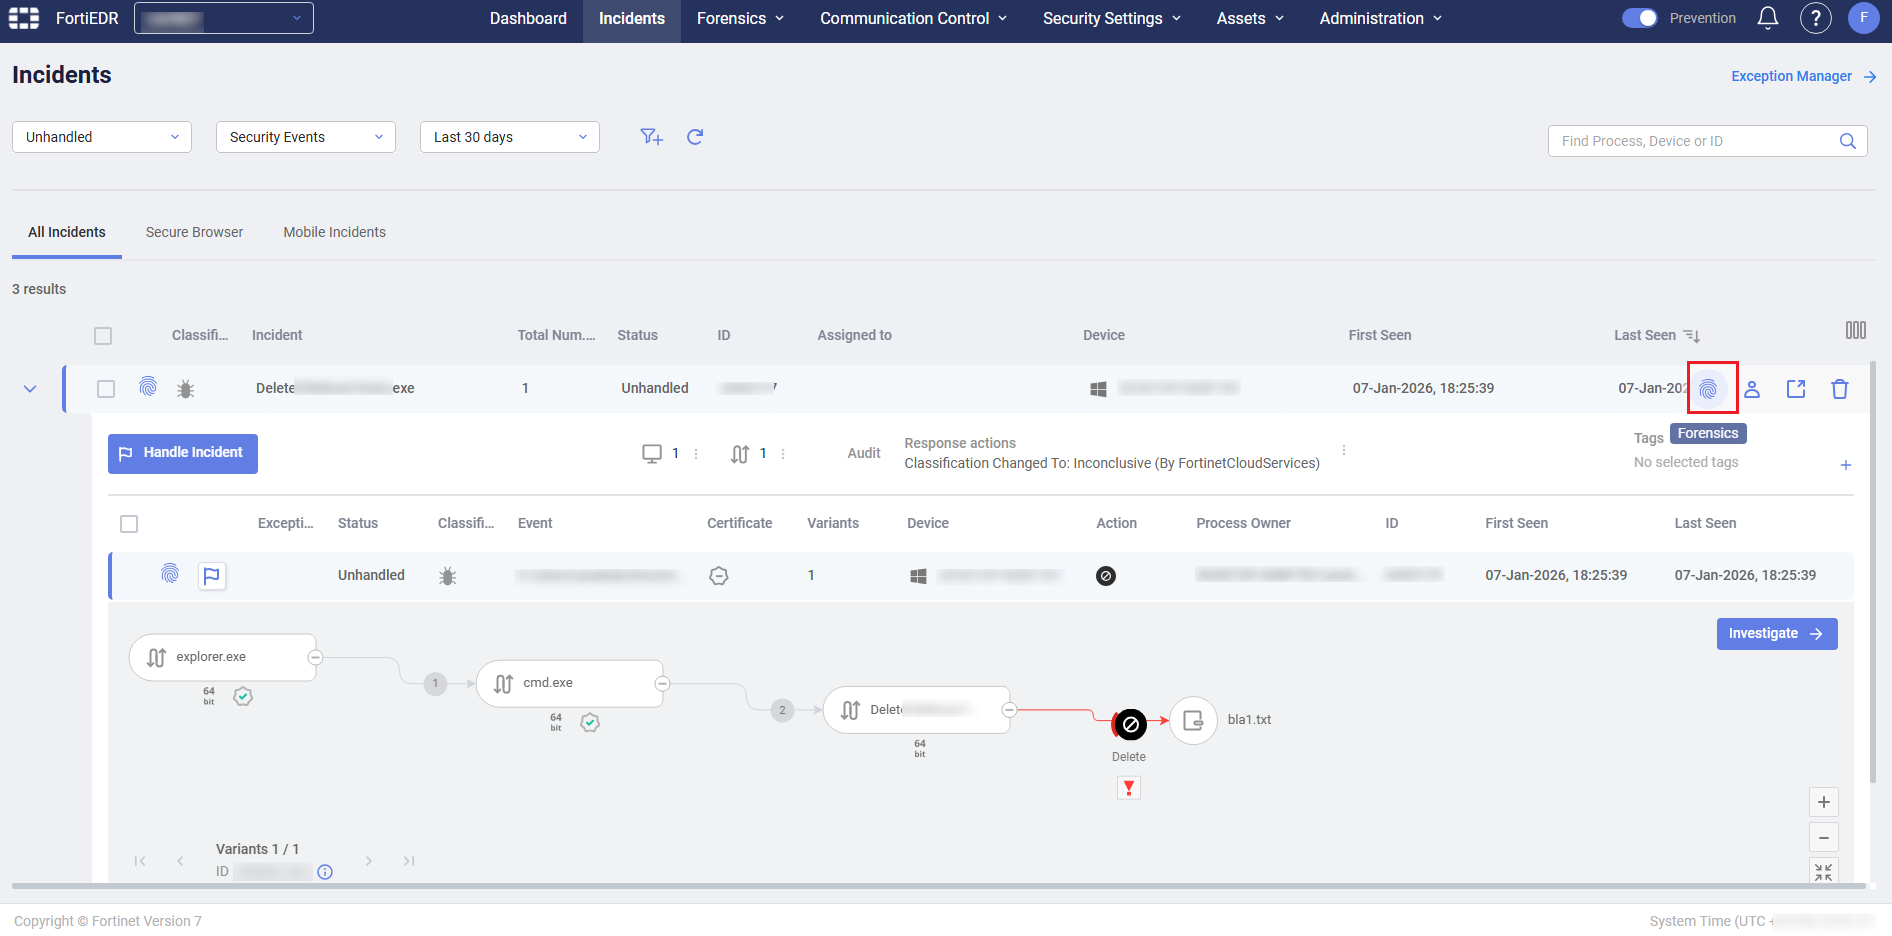
In this case, the Forensics viewer shows a separate tab for each security event associated with the security event aggregation. For example, the figure below shows 4 tabs for a security event aggregation containing two events.
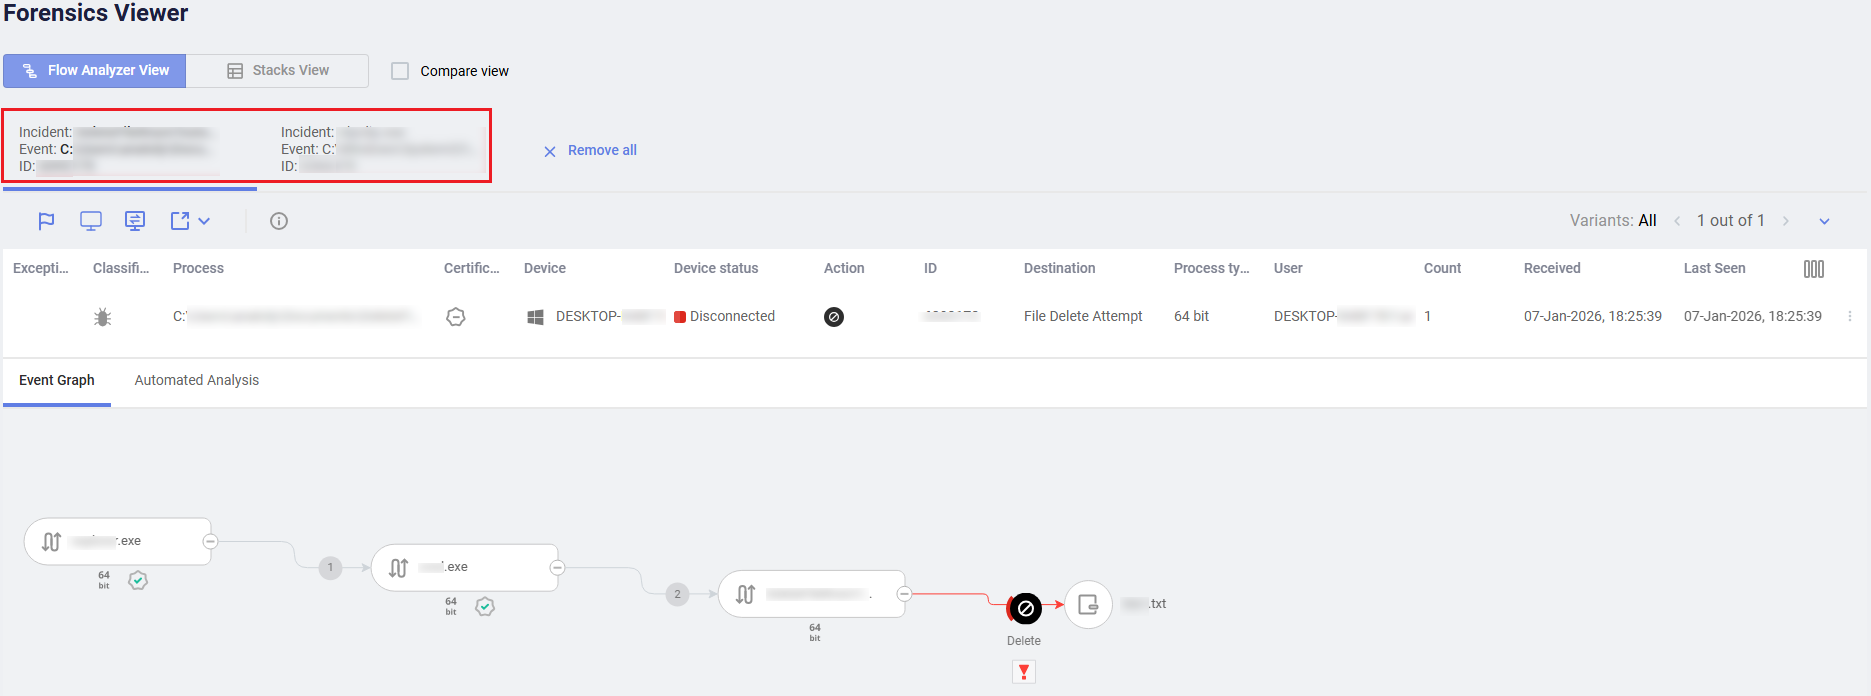
- Select an individual security event in the Event Viewer and then click the Forensics button (). In this case, the Forensics viewer shows a single tab for the selected security event, with all of its related variants.
- Select a variant when in drill down, and then click the Forensics button (). In this case, the Forensics Viewer shows a single tab for the selected security event with a single variant.
To perform deep Forensic analysis:
- Select the security events to analyze using one of the methods described in Incidents.
Selected security events that are currently loaded to the Forensics Viewer are marked in the Incidents with a fingerprint icon.
- Each selected security event is then displayed in the Incidents as a separate tab:
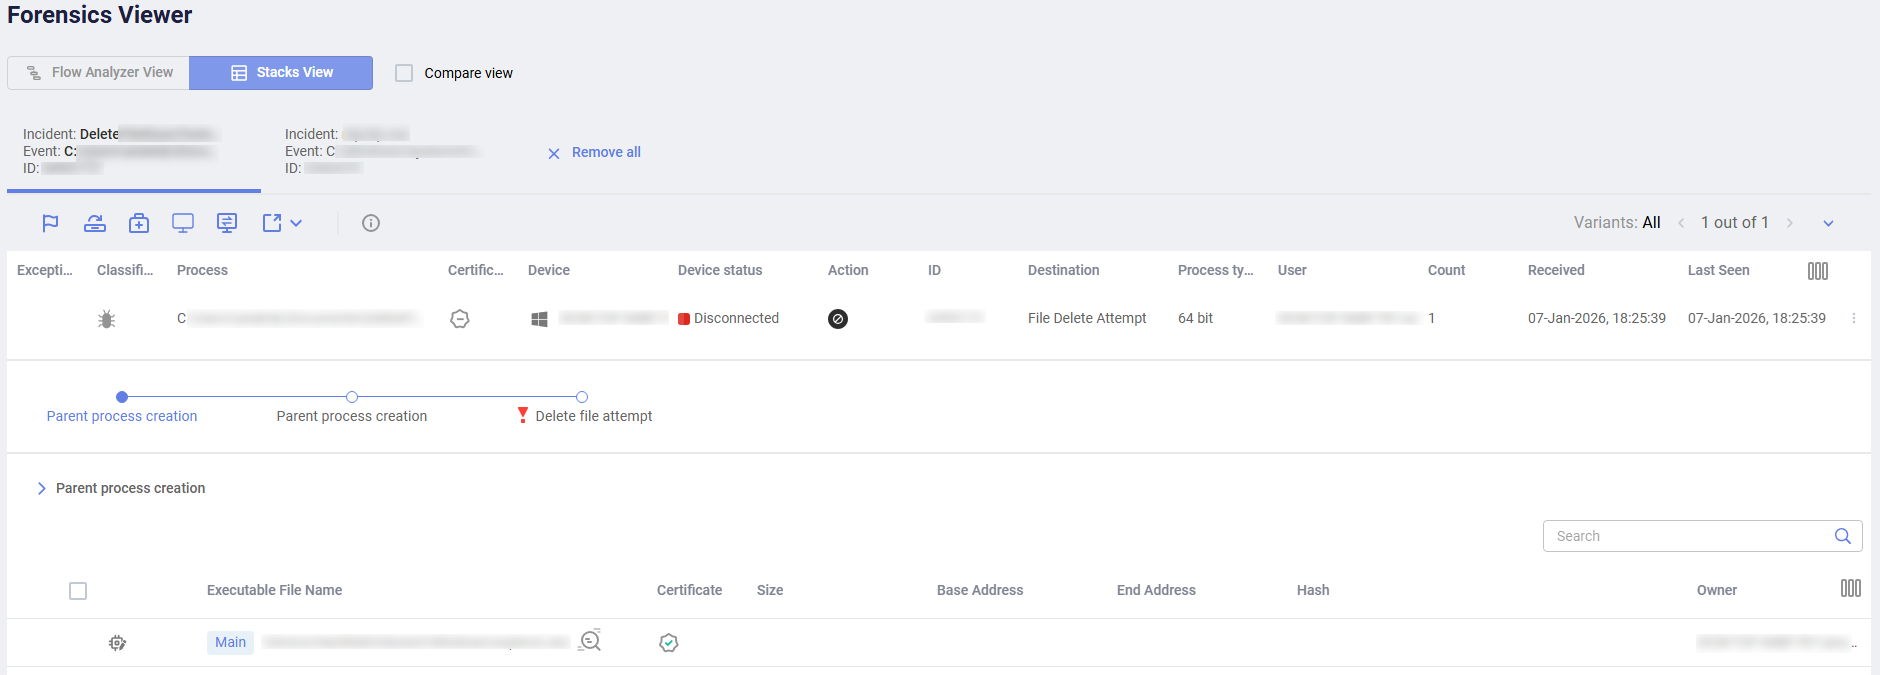
Each tab shows the same information as in the Incidents, with additional information as described below.
The following options for viewing more information are provided:

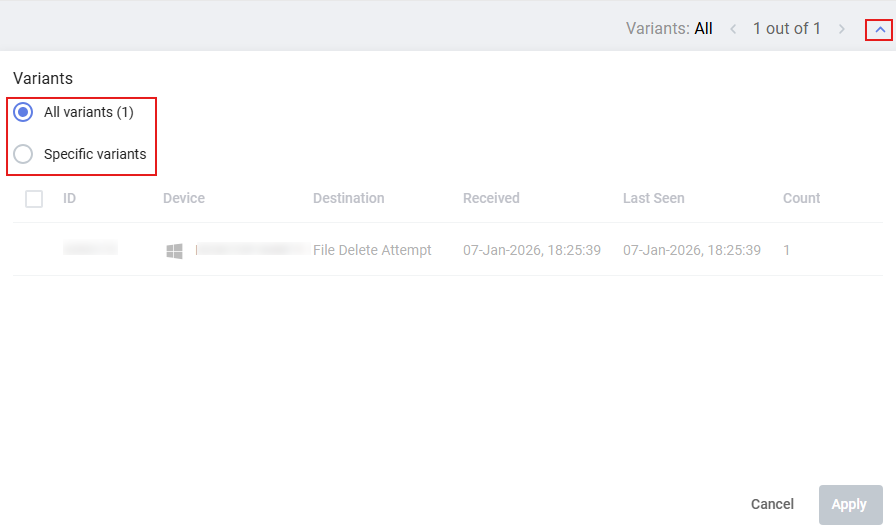
In the Variants area, expand and select all or specific variants to display for a security event.
Click the Threat Hunting
 button to review relevant Activity Events in the Threat Hunting tab.
|
|
The Connect to Device button opens a console that provides direct access to EDR-protected devices. |