
Interfaces
|
|
Unless stated otherwise, the term interface refers to a physical FortiProxy interface. |
In Network > Interfaces, you can configure the interfaces that handle incoming and outgoing traffic.
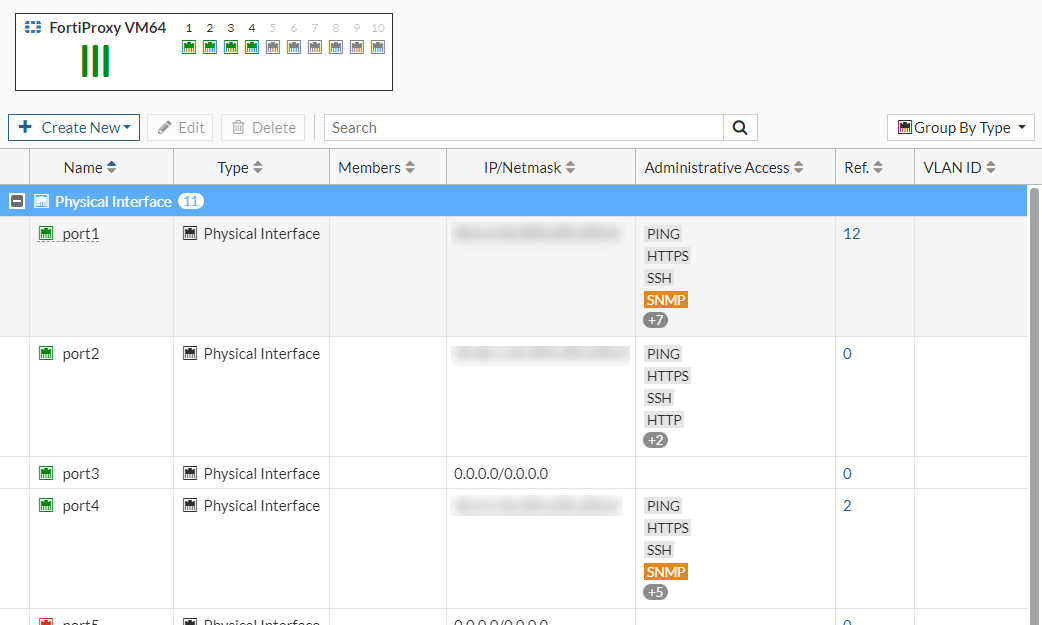
Hover over the leftmost edge of the column heading to display the Configure Table icon, which you can use to select the columns to display or to reset all the columns to their default settings. You can also drag column headings to change their order.
|
|
Starting from 7.0.10, for models that support transceivers, the Transceiver(s) column is available which shows information about transceivers plugged into the FortiProxy, including the vendor name and part number. You can hover over the transceiver to view additional information, such as the type, serial number, and port name. |
The following options are available:
|
Create New |
Select to create an interface or a zone. See Create or edit an interface and Create or edit a zone. |
|
Edit |
Modifies settings within the interface or zone. See Create or edit an interface and Create or edit a zone. |
|
Delete |
Removes an interface from the list. To remove multiple interfaces, select multiple rows in the list by holding down the Ctrl or Shift keys and then select Delete. |
|
Search |
Enter a search term to find in the list. |
|
Grouping |
Select Group By Type, Group By Role, Group By Status, Group By Zone, or No Grouping to change how the rows are displayed on the interface list. |
|
Status |
The administrative status for the interface. If the administrative status is green, the interface is up and can accept network traffic. If the administrative status is red, the interface is administratively down and cannot accept traffic. To change the administrative status of an interface, right-click the icon and select the Set Status setting for the interface. |
|
Name |
The names of the physical interfaces on your FortiProxy unit. The names include any alias names that have been configured. |
|
Type |
The type of the interface, such as Physical Interface. |
|
Members |
Interfaces that belong to the virtual interface of the software switch. |
|
IP/Netmask |
The current IP address/netmask of the interface. When IPv6 Support is enabled on the GUI, IPv6 addresses are displayed in this column. |
|
Administrative Access |
The administrative access configuration for the interface. |
|
Ref. |
Displays the number of times the object is referenced to other objects. To view the location of the referenced object, select the number in Ref., and the Object Usage window appears displaying the various locations of the referenced object. |
|
Bytes |
The number of bytes being used. |
|
Description |
A description of the interface. |
|
DHCP Clients |
If the interface has been configured as a DHCP client. |
|
DHCP Ranges |
The range of IPv4 addresses. |
|
Errors |
Any errors detected. |
|
IPv6 Access |
The types of administrative access permitted for IPv6 connections to this interface. |
|
IPv6 Address |
The IPv6 address/subnet mask for the interface. |
|
IPv6 DHCP Clients |
If the interface has been configured as a DHCP client. |
|
IPv6 DHCP Ranges |
The range of IPv6 addresses. |
|
Link Status |
The status is Up when a valid cable is plugged in. The status is Down when an invalid cable is plugged in. |
|
MAC Address |
The MAC address of the interface. |
|
Packets |
The total number of packets that have been sent and received. Hover over the bar chart to see the separate packet numbers. |
|
Role |
The role can be LAN, WAN, DMZ, or Undefined. |
|
Secondary IP(s) |
The secondary IPv4 addresses added to the interface. |
|
Secondary IPv6 Addresses |
The secondary IPv6 addresses added to the interface. |
|
Security Mode |
The mode is either None or Captive Portal. |
|
VLAN ID |
The configured VLAN ID for VLAN subinterfaces. |
|
VRRP |
Whether the Virtual Router Redundancy Protocol is being used. |
|
Zone |
The name of the zone that the interface belongs to. |
To change the VLAN ID:
- Go to Network > Interfaces, select a VLAN, and then click Edit.
- Beside the VLAN ID field, click Edit. The Update VLAN ID window opens.
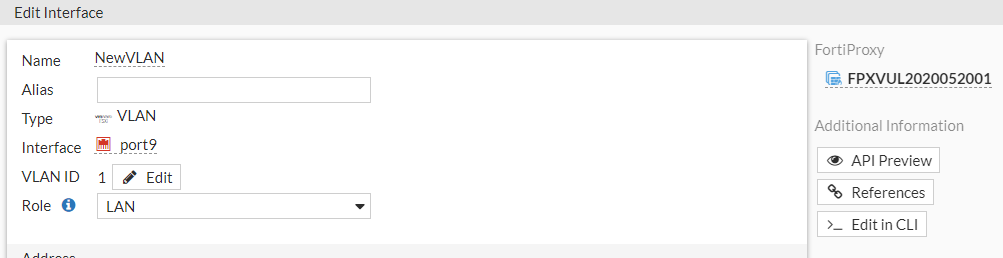
- Enter the new ID and click Next.

- Verify the changes and then click Update and OK.

- The target object status changes to Updated entry. Click Close.
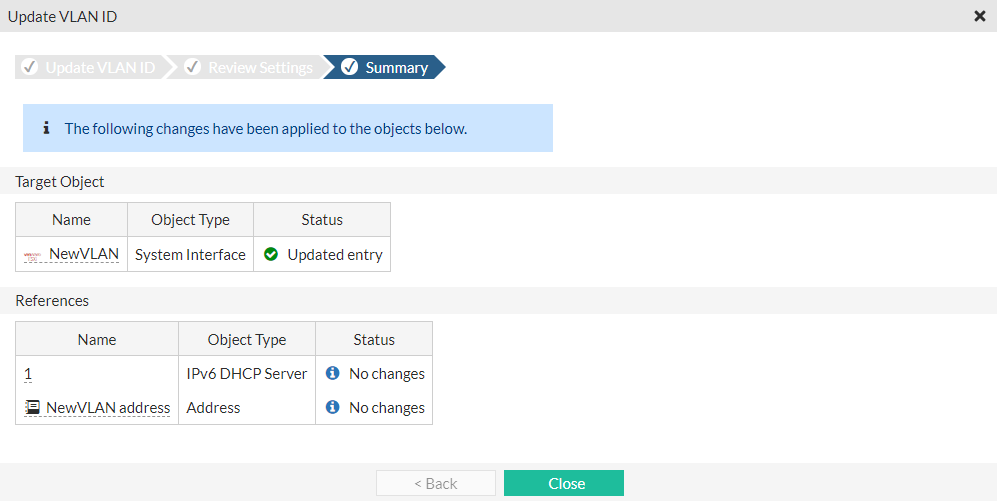
In the interface settings, the new VLAN ID is displayed.

Link health monitor
A link health monitor confirms the connectivity of the device’s interface. You can detect possible routing loops with link health monitors. You can configure the FortiProxy unit to ping a gateway at regular intervals to ensure that it is online and working. When the gateway is not accessible, that interface is marked as down.
Set the interval (how often to send a ping) and failtime (how many lost pings are considered a failure). A smaller interval and smaller number of lost pings results in faster detection but creates more traffic on your network. You might also want to log CPU and memory usage, as a network outage causes your CPU activity to spike.
To configure a link health monitor using the CLI:
config system link-monitor
edit <link_monitor_name>
set srcintf <interface_name>
set server <server_IP_address>
set protocol {ping | tcp-echo | udp-echo | http | twamp}
set gateway-ip <gateway_IPv4_address>
set source-ip <IPv4_address>
set interval <seconds>
set timeout <seconds>
set failtime <retry_attempts>
set recoverytime <number_of_successful_responses>
set ha-priority <priority>
set update-cascade-interface {enable | disable}
set update-static-route {enable | disable}
set status {enable | disable}
next
end
| CLI option | Description |
|---|---|
| srcintf | The name of the interface to add the link health monitor to. |
| server | One or more IP addresses of the servers to be monitored. If the link health monitor cannot connect to all of the servers, remote IP monitoring considers the link to be down. You can add multiple IP addresses to a single link monitor to monitor more than one IP address from a single interface. If you add multiple IP addresses, the health checking will be with all of the addresses at the same time. The link monitor only fails when no responses are received from all of the addresses. |
| protocol | One or more protocols to be used to test the link. The default is ping. |
| gateway-ip | The IPv4 address of the remote gateway that the link monitor must communicate with to contact the server. Only required if there is no other route on for this communication. |
| source-ip | Optionally add a source IPv4 address for the monitoring packets. Normally the source address is the address of the source interface. You can add a different source address if required. |
| interval | The time between sending link health check packets. The default is 5 seconds. The range is 1 to 3600 seconds. |
| timeout | The time to wait before receiving a response from the server. The default is 1 second. The range is 1 to 255 seconds. |
| failtime | The number of times that a health check can fail before a failure is detected (the failover threshold). The default is 5. The range is 1 to 10. |
| recoverytime | The number of times that a health check must succeed after a failure is detected to verify that the server is back up. The default is 5. The range is 1 to 10. |
| ha-priority | The priority of this link health monitor when the ling health monitor is part of a remote link monitor configuration. The default is 1. The range is 1 to 50. |
| update-cascade-interface | Enable to bring down the source interface if the link health monitor fails. Disable to keep the interface up if the link health monitor fails. The default is enable. |
| update-static-route | Enable to remove static routes from the routing table that use this interface if the link monitor fails. The default is enable. |
| status | Enable or disable this link monitor. The default is enable. |
Selecting the source interface and address for Telnet and SSH
The execute telnet-options and execute ssh-options commands allow administrators to set the source interface and address for their connection:
# execute telnet-options {interface <outgoing interface> | reset | source <source interface IP> | view-settings}# execute ssh-options {interface <outgoing interface> | reset | source <source interface IP> | view-settings}
To edit the Telnet options:
# execute telnet-options interface port1
# execute telnet-options source 1.1.1.1
To confirm that the Telnet packets are using the configured port and address:
# diagnose sniffer packet any "port 23" 4
4.070426 port1 out 1.1.1.1.13938 -> 15.15.15.2.23: syn 400156130
4.070706 port1 in 15.15.15.2.23 -> 1.1.1.1.13938: syn 2889776642 ack 400156131
To edit the SSH options:
# execute ssh-options interface port1
# execute ssh-options source 1.1.1.1
To confirm that the SSH packets are using the configured port and address:
# diagnose sniffer packet any "port 22" 4
6.898985 port1 out 1.1.1.1.20625 -> 15.15.15.2.22: syn 1704095779
6.899286 port1 in 15.15.15.2.22 -> 1.1.1.1.20625: syn 753358246 ack 1704095780